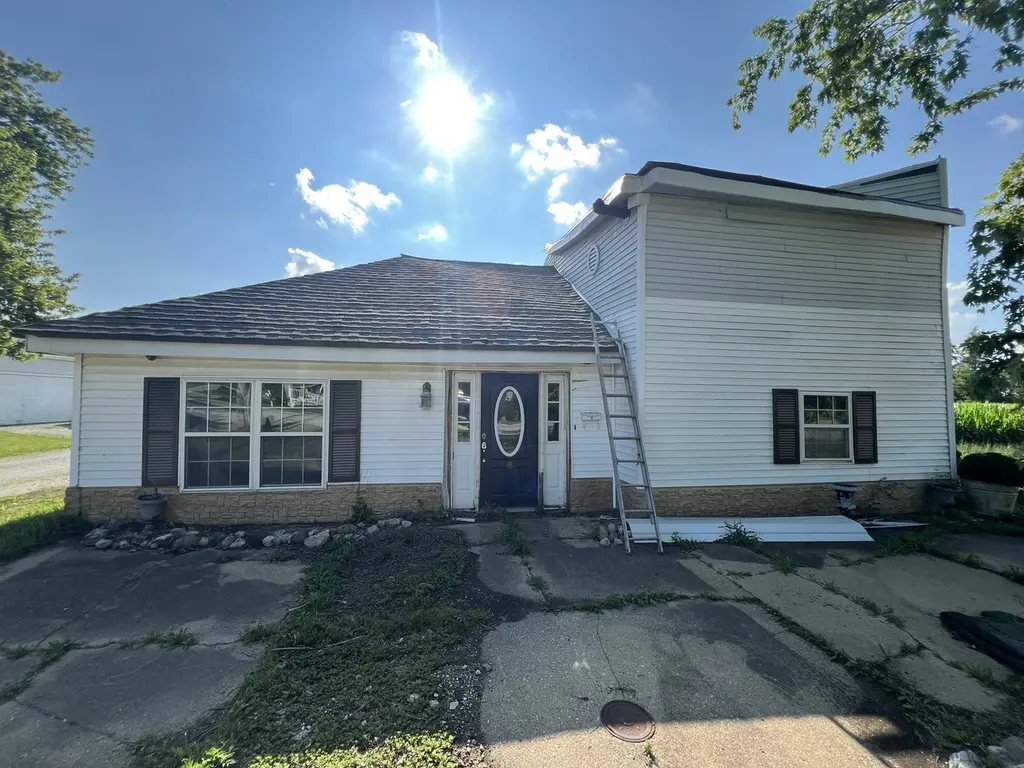
303 N Main St · Seymour, IL
Flood risk No data
- FEMA flood zone
- —
- Chance of flooding over 30 yrs
- —
- Est. flood insurance / yr
- —
Fire risk No data
- Est. fire insurance / yr
- —
Heat risk No data
- Hot days now (above threshold)
- —
- Hot days in 30 yrs
- —
Wind risk No data
- Chance of severe wind over 30 yrs
- —
Air-quality risk No data
- Unhealthy air days now
- —
- Unhealthy air days in 30 yrs
- —
Risk factors via First Street. Map © Google.
Why this score? — see what drove the D+ grade
The composite is a weighted blend of 9 inputs, each scored 0–100. Each bar is that input's sub-score; the figure is the points it added to the 100-point composite (weight × sub-score).
- Cash flow +15.0/30.0
- ARV discount +7.5/15.0
- Appreciation +7.2/10.0
- 1% rule +5.0/10.0
- DSCR +5.0/10.0
- Schools +3.5/10.0
- Livability +3.3/5.0
- Rent growth +2.5/5.0
- Condition / age +1.0/5.0
$30,000
🖨 Deal sheet 📄 Offer letter ✓ Due diligence
Listing remarks MLS
Investment opportunity! This unique property could offer great potential for investors or buyers looking to bring their ideas to life. In the highly sought-after Mahomet School District, most of the property is stripped down to the studs and there are a few walls with drywall. No electrical or water. Home is being sold as-is. Bring your vision and make it shine!
Key facts
- 3,659 sq ft lot
- Listed 108 days
Neighborhood map
What this means for you Summary
Snapshot
- This is a 3-bed/1.5-bath other listed at $30k. Condition is rated poor.
Deal economics
- At list price, monthly cash flow is $829 ($10k/yr) — positive.
- The deal already cash-flows at list — no discount required.
- Meets the 1% rule at list price ($1k rent vs $30k).
- Recommended offer: $27k (9.0% below list) — sets the bar for market timing.
Location & tenants
- Location reads 66/100 on livability (#542 in IL) — a middle-class / working-renter tenant base. Strengths: employment A+, cost of living A+, housing A+; Watch: schools F, amenities F, commute F.
- Mahomet-Seymour CUSD 3 (town): math 40% / reading 35% proficiency, ranked #140 of 620 in IL (top 23%) — families likely to look elsewhere, expect single-tenant / working-renter base with shorter leases; only 19% free/reduced lunch — higher-income household profile.
- Market conditions: 3 active listings in the ZIP; 573 units permitted in Champaign County in 2024 (359 in 5+ unit buildings).
Forward outlook
- In year one you build about $2k of equity ($207 loan paydown + $1k appreciation (4.4% local appreciation)).
- Champaign County population projected at +15% by 2050 — modest demand growth; plan on rents tracking national, not racing it.
- At projected returns (4.4% appreciation + 3.0% rent growth), your $8k cash investment doubles in ~1 year — after that, you're playing with house money.
Negotiation context
- It's been on market 108 days — a 9% lower offer ($27k) is reasonable based on typical stale-listing flexibility.
- 3 sale attempts since 2y ago with the ask held roughly flat each time — persistent listings suggest the price (not the market) is what's stuck; bring a comps-based counter.
Questions for the listing agent
- It's been on market 108 days. Have you received any prior offers? Is the seller open to a 9% concession, seller financing, or rate buy-down credit?
- Have any recent inspections been done? Can we get a copy of the seller's disclosures and any deferred-maintenance estimates?
- Why hasn't it sold? Are there any deal-killer items the seller is aware of (foundation, flood, title, zoning, code violations)?
- Is there a deadline driving the sale (1031 exchange, divorce, estate, relocation)? That informs how much negotiation room exists.
- Schools are F-rated, which usually means shorter tenancies and higher turnover. Who's the typical renter profile here, and what's been the actual vacancy rate?
- The area grade is low — what's the realistic commute time and amenity access for the typical tenant pool here? Any planned neighborhood developments (good or bad) we should know about?
- What's the average days-on-market for RENTAL listings here right now (not sales)? A rising rental-DOM trend means longer vacancies and softer asking-rent achievability than the comps imply.
- What's the recent tenant-quality profile in this submarket — average credit score on applications, eviction rate, late-payment / NSF rate, and stable-employment percentage? A property-management company in the area should have these aggregated.
- How much new for-sale + rental construction is in the pipeline within 1–3 miles? Heavy new supply typically softens prices + rents 12–24 months out; constrained supply supports both.
Investment metrics
- 1% rule
- 4.31% ✓
- Cap rate
- 39.43%
- Cash-on-cash
- 118.36%
- DSCR
- 6.27
- GRM
- 1.9
CMA / ARV
- ARV (median comp)
- $171,931
- List price
- $30,000
- Delta
- -82.55%
- Verdict
- UNDERPRICED
- Comps
- 10 within 1.0 mi
Projected returns pro-forma
4.36% appreciation · 3.0% rent growth · sell at horizon
- IRR
- —
- Equity multiple
- 7.98×
- Total profit
- $58,611
- Equity at exit
- $15,846
- IRR
- —
- Equity multiple
- 16.73×
- Total profit
- $132,137
- Equity at exit
- $26,438
Cash invested: $8,400 (down + closing). Projections, not guarantees.
Landlord ↔ Tenant lean methodology
- Overall (STATE)
- 43 Moderately Tenant-Leaning
- State Illinois
- 43 Moderately Tenant-Leaning · D+7
- County
- — inherits STATE
- City
- — inherits STATE
ZIP-level market 61875
- Home prices YoY
- 2.2%
- Active inventory
- 3
- Price-to-rent
- 1.9×
Monthly cashflow live
- Estimated rent
- $1,294 medium interval (Pro) →
- Mortgage (P&I)
- −$157
- Tax from tax record
- −$24 /mo · $286/yr
- Insurance
- −$12
- HOA
- −$0
- Vacancy / Maint / Mgmt
- −$272
- Net cashflow
- $829
Break-even live
UW: 25.0% down · 7.5% · 30yr · 1.5% tax · 5.0% vac · 8.0% maint · 8.0% mgmt
Financing live
Cash to close
- Down payment
- $7,500
- Closing costs
- $900
- Reserves months
- —
- Total cash needed
- —
Loan-product check · same deal, 3 products live
Conventional
25% down · 7.5% · 30yr
- Down + closing
- —
- Monthly P&I
- —
- Monthly cashflow
- —
- DSCR
- —
- Eligible?
- —
Personal DTI + credit; lowest rate.
DSCR
20% down · 8.5% · 30yr
- Down + closing
- —
- Monthly P&I
- —
- Monthly cashflow
- —
- DSCR
- —
- Eligible?
- —
No personal income docs; deal must DSCR.
Hard money
10% down · 12.0% · 12mo
- Down + closing
- —
- Monthly P&I
- —
- Monthly cashflow
- —
- DSCR
- —
- Eligible?
- —
Short-term bridge; refi at stabilization.
Listing history 19 events
-
2026-06-18days on market $30,000 Active 108 DOM
-
2026-06-17days on market $30,000 Active 107 DOM
-
2026-06-16days on market $30,000 Active 106 DOM
-
2026-06-15days on market $30,000 Active 105 DOM
-
2026-06-14days on market $30,000 Active 103 DOM
-
2026-06-13days on market $30,000 Active 102 DOM
-
2026-06-10days on market $30,000 Active 100 DOM
-
2026-06-09days on market $30,000 Active 99 DOM
-
2026-06-08days on market $30,000 Active 98 DOM
-
2026-06-07days on market $30,000 Active 97 DOM
-
2026-06-02days on market $30,000 Active 92 DOM
-
2026-06-01days on market $30,000 Active 91 DOM
-
2026-05-31days on market $30,000 Active 90 DOM
-
2026-05-30days on market $30,000 Active 89 DOM
-
2026-03-02$30,000 Active 364-char remark
Show marketing remark (364 chars)
Investment opportunity! This unique property could offer great potential for investors or buyers looking to bring their ideas to life. In the highly sought-after Mahomet School District, most of the property is stripped down to the studs and there are a few walls with drywall. No electrical or water. Home is being sold as-is. Bring your vision and make it shine!
-
2025-12-29historical
-
2025-07-20Active
-
2025-04-01historical
-
2024-10-22Active
ⓘ Source: listings_history table (triggers on properties + properties_extension) + one-shot
backfill from property_details.listing_events for pre-trigger history.
Tax reassessment forecast IL · Partial reset (capped growth)
- Current annual tax
- $286 · $24/mo
- Projected year-2 tax
- $483 · $40/mo
- Expected delta
- +$198/yr (+$16/mo · 69.2%)
ⓘ Screening estimate from a state-policy table — verify with the county assessor before closing.
Nearby sold comps map
Loading sold comps map…
Walkable amenities ~0.75 mi
Loading nearby amenities…
Taxation est. · year 1
- Rental income
- $15,527
- − Mortgage interest
- −$1,680
- − Property taxes
- −$286
- − Insurance
- −$150
- − Repairs & maintenance
- −$1,242
- − Management
- −$1,242
- − Depreciation
- −$873
- Taxable income
- $10,054
- Est. tax owed @ 24.0%
- −$2,413
- After-tax cash flow
- $7,530/yr
For passive investors: Depreciation is non-cash, so a rental often shows a tax loss while cash-flowing — sheltering income. Rental losses are passive: they offset passive income freely, and up to $25,000/yr can offset ordinary (W-2) income if you actively participate and your MAGI is under $100k (phasing out to $0 by $150k); unused losses carry forward. On sale, claimed depreciation is recaptured at up to 25%, and gains may owe capital-gains tax (a 1031 exchange can defer both). Figures are a year-1 estimate at your 24.0% rate — not tax advice; consult a CPA.
Condition & rehab AI · 12 photos
This property requires extensive renovation, including structural repairs and updates to all systems, to become move-in ready and increase its value.
Repairs flagged
- Major Exposed framing — Structural integrity compromised
- Major Exposed electrical wiring — No electrical systems
- Major Exposed plumbing — No water systems
Value-add opportunities
- Both Complete renovation of kitchen and bathrooms — Modernizing spaces for both resale and rental
- Both Landscaping and curb appeal improvements — Enhances property's visual appeal
- Both Electrical and plumbing upgrades — Ensures safety and functionality
- Both HVAC system replacement — Improves comfort and energy efficiency
Renovation cost estimate screening
| Repair item | Severity | Est. cost |
|---|---|---|
| Exposed framing · Structural integrity compromised | Major | $15,000–50,000 |
| Exposed electrical wiring · No electrical systems | Major | $15,000–50,000 |
| Exposed plumbing · No water systems | Major | $15,000–50,000 |
| Total estimated repair cost · 3 items | $45,000–150,000 |
Value-add ROI direction
- Both Complete renovation of kitchen and bathrooms — Modernizing spaces for both resale and rental ↑
- Both Landscaping and curb appeal improvements — Enhances property's visual appeal ↑
- Both Electrical and plumbing upgrades — Ensures safety and functionality ↑
- Both HVAC system replacement — Improves comfort and energy efficiency ↑
ⓘ Cost ranges are severity-bucket heuristics (US national rule-of-thumb). Get contractor quotes + a written scope before underwriting a rehab budget.
Schools (NCES district)
- District
- Mahomet-Seymour CUSD 3
- NCES district ID
- 1724060
- Math proficiency
- 40% ▼ -8.00%
- Reading proficiency
- 35% ▼ -15.00%
- Median HH income
- $73,748
- Composite
- 34.72/100
- National rank
- #5134
- State rank
- #140 of 620 in IL
Livability — Seymour
- Score
- 66/100
- State rank
- #542
- US rank
- #11247
Category grades
Schools grade is shown separately in the Schools card above.
Census & demographics
- Population (ZIP)
- 974
Population outlook (Champaign County) Hauer SSP2
- Today (2025)
- 223,848 people
- By 2030
- 231,416 · +3.4%
- By 2040
- 244,321 · +9.1%
- By 2050
- 256,432 · +14.6%
- By 2075
- 285,823 · +27.7%
- By 2100
- 296,406 · +32.4%
Race, ethnicity, and origin ACS 2023
- Neighborhood character
- Predominantly White (94%)
- Race & ethnicity
- White 94% Two or more races 6% Hispanic / Latino 5%
- Common ancestry
- Serbian 17% Subsaharan African 3% Lithuanian 2%
- Foreign-born
- 8% · Canada
Political lean MEDSL · Champaign
- 2024 margin
- Strong D (+24.1) · D 61.3% · R 37.2% · Other 1.5%
- 2008→2024 swing
- +6.6pp toward D · 2008: 17.5pp · 2024: 24.1pp
- All cycles
- 2024: D+24.1 2020: D+22.8 2016: D+18.4 2012: D+6.8 2008: D+17.5
Not yet ingested
- Civics
- —
Market trends
- HPI YoY
- ▲ 4.36%
- Current HPI
- 202.5732
- Rent YoY
- —
- Metro
- —
- State GDP YoY
- ▲ 1.59%
- F500 in state
- 60
Industry mix (Fortune 500 HQ in IL)
| Industry | F500 HQs | Revenue |
|---|---|---|
| Insurance | 4 | $201B |
|
||
| Consumer Goods | 4 | $87B |
|
||
| Industrial Machinery | 3 | $64B |
|
||
| Healthcare | 2 | $55B |
|
||
| Retail / Pharmacy | 1 | $148B |
|
||
| Agriculture / Food | 1 | $86B |
|
||
Price history
5 events — show timeline
- 2026-03-02 Listed $30,000 MRED as Distributed by MLS Grid
- 2025-12-29 Listing Removed — MRED as Distributed by MLS Grid
- 2025-07-20 Listed — MRED as Distributed by MLS Grid
- 2025-04-01 Listing Removed — MRED as Distributed by MLS Grid
- 2024-10-22 Listed — MRED as Distributed by MLS Grid
Cash-flow waterfall
monthlySold comps — $/sqft
last 12 mo · ≤1 miLoading sold comps…