 🏷️ Likely Rental
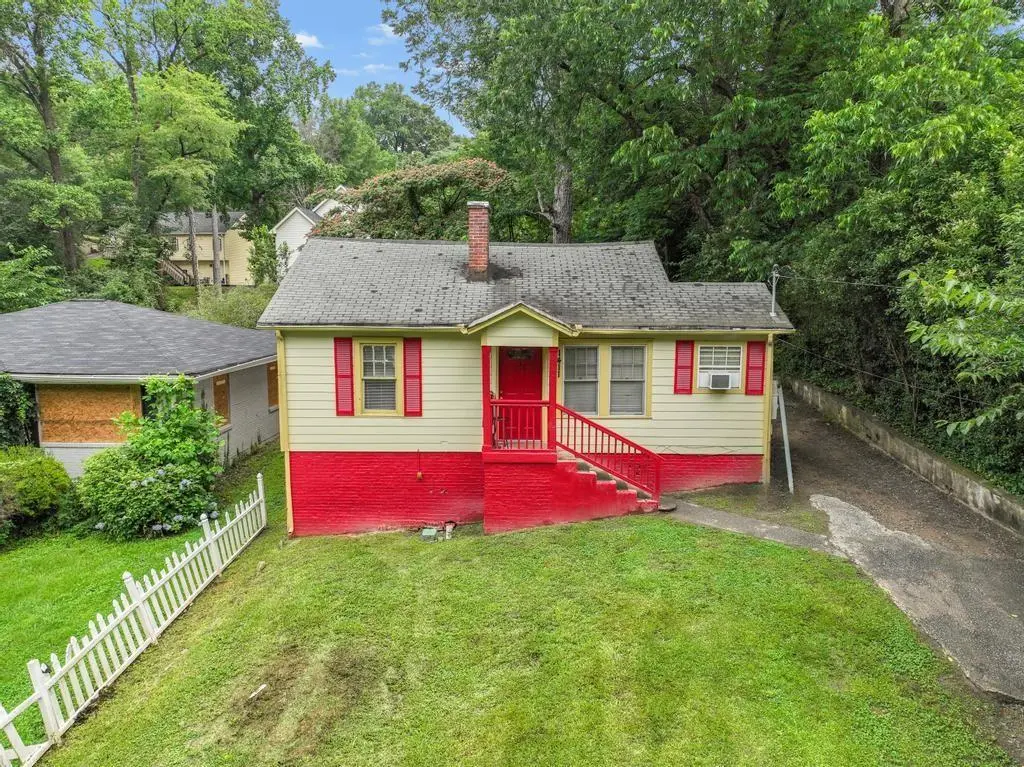
1411 Lavender Dr NW · Atlanta, GA
Flood risk 1/10 · Minimal
- FEMA flood zone
- X (unshaded)
- Chance of flooding over 30 yrs
- 0.0%
- Est. flood insurance / yr
- $473 – $860
Fire risk 1/10 · Minimal
- Est. fire insurance / yr
- $963 – $1,789
Heat risk 5/10 · Moderate
- Hot days now (above 103°F)
- 7 days/yr
- Hot days in 30 yrs
- 16 days/yr
Wind risk 6/10 · Moderate
- Chance of severe wind over 30 yrs
- 27.0%
Air-quality risk 4/10 · Minor
- Unhealthy air days now
- 5 days/yr
- Unhealthy air days in 30 yrs
- 7 days/yr
Risk factors via First Street. Map © Google.
Why this score? — see what drove the C grade
The composite is a weighted blend of 9 inputs, each scored 0–100. Each bar is that input's sub-score; the figure is the points it added to the 100-point composite (weight × sub-score).
- Cash flow +24.8/30.0
- DSCR +8.0/10.0
- ARV discount +7.5/15.0
- 1% rule +6.9/10.0
- Livability +4.2/5.0
- Rent growth +3.1/5.0
- Schools +2.7/10.0
- Condition / age +2.5/5.0
- Appreciation +0.0/10.0
$199,000
🖨 Deal sheet 📄 Offer letter ✓ Due diligence
Listing remarks MLS
Turnkey investment opportunity in Atlanta’s thriving Hunter Hills neighborhood! This tenant-occupied 6-bedroom property is currently generating $3,200 per month in rental income, providing immediate cash flow for investors. Located just steps from the Atlanta BeltLine and only minutes from Downtown Atlanta, Midtown, Georgia Tech, Mercedes-Benz Stadium, and major employment centers, this property is ideally positioned in one of the city’s fastest-growing areas. The spacious six-bedroom layout appeals to a wide range of tenants, supporting strong rental demand and long-term investment potential. Whether you’re looking to expand your portfolio or acquire your first income-producing property, this cash-flowing asset offers an excellent combination of current returns and future appreciation potential in Atlanta’s dynamic Westside market.
Key facts
- Tenant occupied
- Spacious layout
- 6,499 sq ft lot
Tags
Property features AI
Exterior
- Parking: Driveway; Four total parking spaces; Open parking available
- Utilities: Public water; Public sewer; 220-volt electric service; Sewer and water available
- Home design: One-level home; Resale property
- Construction: Composition roof; Block foundation; Other/unspecified construction materials
- Exterior features: Front porch; Other/unspecified exterior features; Paved city street frontage; Near Beltline, public transport, schools, shopping, trails/greenway, park, and pool
Interior
- Kitchen: Kitchen with other/custom features; Appliances: other/unspecified
- Bedrooms: Six main-level bedrooms
- Flooring: Other/unspecified flooring
- Bathrooms: Six full bathrooms (all on the main level); Master bathroom with custom/other features
- Heating & cooling: Central heating (natural gas); Central air conditioning
- Interior features: No common walls; Crawl space foundation
- Laundry & utility: Laundry with other/unspecified features
Neighborhood map
What this means for you Summary
Snapshot
- This is a 4-bed/2.5-bath single-family listed at $199k.
Deal economics
- At list price, monthly cash flow is $418 ($5k/yr) — positive.
- The deal already cash-flows at list — no discount required.
- Meets the 1% rule at list price ($2k rent vs $199k).
- Cap rate 8.8% vs local median 3.1% in Atlanta — top-decile yield for the area; either an underpriced asset or a hidden risk that comps aren't pricing in. Stress-test before assuming the spread holds.
Location & tenants
- Location reads 83/100 on livability (#6 in GA, #919 nationally) — a professional / high-income tenant draw. Strengths: amenities A+, commute A+, housing A+; Watch: schools C-, cost of living C-.
- Atlanta Public Schools (urban): math 28% / reading 35% proficiency, ranked #80 of 174 in GA (top 46%) — families likely to look elsewhere, expect single-tenant / working-renter base with shorter leases; 71% free/reduced lunch — lower-income household profile, screen leases tightly.
- Market conditions: Rents rising (+2.5%/yr); 293 active listings in the ZIP; 40 comparable units currently listed for rent nearby; rentals at typical pace (median 25d on market — plan ~3-4 weeks tenant-placement turnaround); lower-income renter base — watch delinquency; 11,565 units permitted in Fulton County in 2024 (8,159 in 5+ unit buildings).
- At $2,363/mo this rent would consume 67% of the median local household income ($42k/yr) (locally 1293% of renters already pay >50% of income on rent) — very limited rent-growth headroom before tenants either downsize or default.
Forward outlook
- Local home prices are declining (-3.0%/yr); year-one equity from $1k of loan paydown is wiped out by about $6k of value loss. Plan a longer hold.
- Fulton County population projected at +38% by 2050 — long-run rental-demand tailwind backs the buy-and-hold thesis.
Negotiation context
- Only 6 days on market — expect competitive offers; lowballing is unlikely to land.
- 13 sale attempts since 17y ago with the ask held roughly flat each time — persistent listings suggest the price (not the market) is what's stuck; bring a comps-based counter.
- Current owner paid $21k; list at $199k implies a 848% gain — meaningful room to come down on a strong offer.
Risks & watch-outs
- Watch-outs: built in 1940 — expect roof / HVAC / electrical / plumbing capex.
- Climate carrying-cost: major wind risk, 27% chance of damaging wind over 30y; extreme-heat days projected 7→16/yr by 2055 (HVAC capex compounding) — expect insurance premiums to compound above CPI over the hold.
Questions for the listing agent
- Built in 1940 — when were the roof, HVAC, electrical panel, plumbing, and water heater last replaced?
- Is there a deadline driving the sale (1031 exchange, divorce, estate, relocation)? That informs how much negotiation room exists.
- What's the average days-on-market for RENTAL listings here right now (not sales)? A rising rental-DOM trend means longer vacancies and softer asking-rent achievability than the comps imply.
- What's the recent tenant-quality profile in this submarket — average credit score on applications, eviction rate, late-payment / NSF rate, and stable-employment percentage? A property-management company in the area should have these aggregated.
- How much new for-sale + rental construction is in the pipeline within 1–3 miles? Heavy new supply typically softens prices + rents 12–24 months out; constrained supply supports both.
Investment metrics
- 1% rule
- 1.19% ✓
- Cap rate
- 8.81%
- Cash-on-cash
- 9.00%
- DSCR
- 1.40
- GRM
- 7.0
CMA / ARV
- ARV (on-the-fly)
- $401,940
- Comps found
- 12
Show comp detail 12 sales within ~0.75 mi
| Address | Dist | Beds/Ba | Sqft | Sold | Price | $/sf | Match |
|---|---|---|---|---|---|---|---|
| 224 Chappell Rd NW | 0.03mi | 5/2.5 (+1) | 1,748 (-12%) | 9mo | $215,000 | $123 | 67 |
| 1373 M L King Jr Dr | 0.52mi | 3/2.5 (-1) | 2,054 (+4%) | 0mo | $407,000 | $198 | 64 |
| 198 Scott St NW | 0.11mi | 4/3.0 | 1,740 (-12%) | 11mo | $353,000 | $203 | 63 |
| 195 Childs Dr NW | 0.14mi | 4/3.5 | 2,200 (+11%) | 13mo | $499,000 | $227 | 60 |
| 1413 Kennesaw Dr NW | 0.38mi | 4/3.0 | 2,200 (+11%) | 4mo | $496,000 | $225 | 58 |
| 1497 Eason St NW | 0.32mi | 3/2.0 (-1) | 1,710 (-14%) | 6mo | $300,000 | $175 | 51 |
| 95 Arcadia Cir NW | 0.46mi | 3/2.0 (-1) | 1,766 (-11%) | 6mo | $195,000 | $110 | 48 |
| 1514 Mozley Pl SW | 0.74mi | 4/3.0 | 2,139 (+8%) | 2mo | $429,000 | $201 | 48 |
| 1713 North Ave NW | 0.75mi | 3/2.5 (-1) | 1,900 (-4%) | 7mo | $409,000 | $215 | 48 |
| 106 Stafford St NW | 0.54mi | 3/2.0 (-1) | 1,750 (-12%) | 2mo | $399,000 | $228 | 47 |
| 59 Stafford St NW | 0.60mi | 3/2.5 (-1) | 2,108 (+6%) | 12mo | $468,500 | $222 | 46 |
| 558 Elbridge Dr NW | 0.62mi | 4/3.0 | 2,236 (+13%) | 9mo | $325,000 | $145 | 40 |
Match score weights: distance 35% · size 25% · config 20% · recency 20%. Top-matched comps best support the ARV.
Projected returns pro-forma
-3.0% appreciation · 2.53% rent growth · sell at horizon
- IRR
- -3.2%
- Equity multiple
- 0.88×
- Total profit
- $-6,654
- Equity at exit
- $29,672
- IRR
- 6.0%
- Equity multiple
- 1.44×
- Total profit
- $24,295
- Equity at exit
- $17,206
Cash invested: $55,720 (down + closing). Projections, not guarantees.
Landlord ↔ Tenant lean methodology
- Overall (STATE)
- 90 Strongly Landlord-Friendly
- State Georgia
- 90 Strongly Landlord-Friendly · R+3
- County
- — inherits STATE
- City
- — inherits STATE
ZIP-level market 30314
- Home prices YoY
- -22.9%
- Rents YoY
- 2.5%
- Active inventory
- 293
- Price-to-rent
- 7.0×
Monthly cashflow live
- Estimated rent
- $2,363 high interval (Pro) →
- Mortgage (P&I)
- −$1,044
- Tax from tax record
- −$322 /mo · $3,867/yr
- Insurance
- −$83
- HOA
- −$0
- Vacancy / Maint / Mgmt
- −$496
- Net cashflow
- $418
Break-even live
UW: 25.0% down · 7.5% · 30yr · 1.5% tax · 5.0% vac · 8.0% maint · 8.0% mgmt
Financing live
Cash to close
- Down payment
- $49,750
- Closing costs
- $5,970
- Reserves months
- —
- Total cash needed
- —
Loan-product check · same deal, 3 products live
Conventional
25% down · 7.5% · 30yr
- Down + closing
- —
- Monthly P&I
- —
- Monthly cashflow
- —
- DSCR
- —
- Eligible?
- —
Personal DTI + credit; lowest rate.
DSCR
20% down · 8.5% · 30yr
- Down + closing
- —
- Monthly P&I
- —
- Monthly cashflow
- —
- DSCR
- —
- Eligible?
- —
No personal income docs; deal must DSCR.
Hard money
10% down · 12.0% · 12mo
- Down + closing
- —
- Monthly P&I
- —
- Monthly cashflow
- —
- DSCR
- —
- Eligible?
- —
Short-term bridge; refi at stabilization.
Rent comps 40 comps
| Address | Beds | Baths | Sqft | Rent | $/sqft | DOM | Units | Dist |
|---|---|---|---|---|---|---|---|---|
| 1448 Rome Dr NW Unit 1448 Atlanta, GA | 3.0 | 2.5 | 1400 | $2,300 | $1.64 | 12d | 1 | 0.15mi |
| 1332 Akridge St NW Atlanta, GA | 3.0 | 2.0 | 1400 | $1,775 | $1.27 | 24d | 1 | 0.24mi |
| 120 Burbank Dr NW Atlanta, GA | 3.0 | 2.0 | 1331 | $1,795 | $1.35 | 24d | 1 | 0.31mi |
| 66 Holly Rd NW Atlanta, GA | 3.0 | 2.5 | 1632 | $2,228 | $1.37 | 2d | 1 | 0.36mi |
| 1603 Ezra Church Dr NW Atlanta, GA | 5.0 | 4.0 | 2448 | $6,000 | $2.45 | 24d | 1 | 0.37mi |
| 29 Chappell Rd NW Atlanta, GA | 3.0 | 2.0 | 1670 | $1,953 | $1.17 | 22d | 1 | 0.42mi |
| 1400 North Ave NW Unit A Atlanta, GA | 3.0 | 2.0 | 2456 | $2,600 | $1.06 | 24d | 1 | 0.46mi |
| 492 Pierce Ave NW Unit A Atlanta, GA | 4.0 | 2.5 | 2470 | $1,800 | $0.73 | 18d | 1 | 0.54mi |
| 221 Stafford St NW Atlanta, GA | 3.0 | 2.0 | 2293 | $2,400 | $1.05 | 24d | 1 | 0.54mi |
| 195 W Lake Ave NW Unit 1 Atlanta, GA | 3.0 | 2.0 | 1245 | $2,654 | $2.13 | 24d | 1 | 0.55mi |
| 390 W Lake Ave NW Apt A1 Atlanta, GA | 3.0 | 1.5 | 1256 | $1,299 | $1.03 | 24d | 1 | 0.61mi |
| 390 W Lake Ave NW Unit A10 Atlanta, GA | 3.0 | 1.5 | 1256 | $1,275 | $1.02 | 24d | 1 | 0.61mi |
| 1770 Springview Rd NW Atlanta, GA | 3.0 | 2.0 | 1262 | $2,000 | $1.58 | 24d | 1 | 0.64mi |
| 557 Chappell Rd NW Atlanta, GA | 3.0 | 2.0 | 1264 | $1,850 | $1.46 | 5d | 1 | 0.65mi |
| 1064 Westmoor Dr NW Atlanta, GA | 3.0 | 3.0 | 1770 | $2,300 | $1.30 | 24d | 1 | 0.66mi |
| 1380 Mozley Pl SW Atlanta, GA | 3.0 | 2.0 | 1941 | $1,400 | $0.72 | 7d | 1 | 0.70mi |
| 167 Rockmart Dr SW Atlanta, GA | 4.0 | 3.5 | 2347 | $3,033 | $1.29 | 24d | 1 | 0.75mi |
| 0 W Lake Ave NW Atlanta, GA | 3.0 | 2.5 | 1300 | $1,900 | $1.46 | 2d | 1 | 0.76mi |
| 1005 Westmoor Dr NW Unit A Atlanta, GA | 4.0 | 2.0 | 1348 | $1,695 | $1.26 | 24d | 1 | 0.77mi |
| 557 W Lake Ave NW Atlanta, GA | 1.0–3.0 | 1.0–2.0 | 1190 | $1,556 | $1.31 | 4d | 9 | 0.79mi |
| 198 Wellington St SW Atlanta, GA | 3.0 | 2.5 | 1787 | $2,700 | $1.51 | 24d | 1 | 0.80mi |
| 1004 Desoto St NW Atlanta, GA | 3.0 | 2.0 | 1550 | $1,995 | $1.29 | 24d | 1 | 0.82mi |
| 176 Racine St SW Atlanta, GA | 3.0 | 2.0 | 1423 | $2,800 | $1.97 | 24d | 1 | 0.84mi |
| 15 Ollie St NW Atlanta, GA | 3.0 | 2.5 | 1594 | $3,150 | $1.98 | 24d | 1 | 0.84mi |
| 211 Laurel Ave SW Atlanta, GA | 5.0 | 3.0 | 2000 | $3,100 | $1.55 | 24d | 1 | 0.88mi |
| 2111 Martin Luther King Junior Dr NW Atlanta, GA | 3.0 | 1.0 | 1470 | $1,800 | $1.22 | 24d | 1 | 0.88mi |
| 155 Rosser St SW Atlanta, GA | 3.0 | 2.0 | 1500 | $2,073 | $1.38 | 24d | 1 | 0.90mi |
| 220 Napoleon Dr SW Atlanta, GA | 4.0 | 3.0 | 2500 | $3,199 | $1.28 | 11d | 1 | 0.93mi |
| 272 Joseph E Lowery Blvd NW Atlanta, GA | 3.0 | 1.0 | 1230 | $1,800 | $1.46 | 24d | 1 | 0.94mi |
| 891 Rock St NW Atlanta, GA | 2.0–3.0 | 2.0 | 1104 | $1,491 | $1.35 | 24d | 4 | 1.01mi |
| 1000 Palmetto Ave SW Atlanta, GA | 3.0 | 2.0 | 1566 | $1,925 | $1.23 | 24d | 1 | 1.01mi |
| 308 Anderson Ave NW Unit A Atlanta, GA | 4.0 | 3.0 | 1250 | $2,200 | $1.76 | 24d | 1 | 1.03mi |
| 1181 Westview Dr SW Atlanta, GA | 4.0 | 2.0 | 1392 | $2,400 | $1.72 | 24d | 1 | 1.03mi |
| 455 Joseph E Lowery Blvd NW Atlanta, GA | 3.0 | 2.5 | 1890 | $1,950 | $1.03 | 12d | 1 | 1.06mi |
| 740 Liberty Commons Dr NW #1101 Atlanta, GA | 3.0 | 3.5 | 1890 | $2,600 | $1.38 | 24d | 1 | 1.12mi |
| 954 Parsons St SW Atlanta, GA | 4.0 | 3.5 | 1376 | $2,800 | $2.03 | 22d | 1 | 1.12mi |
| 884 T P Burruss SR Dr SW Atlanta, GA | 3.0 | 2.0 | 1366 | $2,299 | $1.68 | 24d | 1 | 1.12mi |
| 2001 Chicago Ave NW Atlanta, GA | 4.0 | 3.0 | 2504 | $2,323 | $0.93 | 22d | 1 | 1.13mi |
| 1911 Baker Rd NW Atlanta, GA | 3.0 | 2.5 | 2200 | $2,795 | $1.27 | 18d | 1 | 1.14mi |
| 60 Paschal Blvd NW Atlanta, GA | 1.0–3.0 | 1.0–2.5 | 945 | $1,625 | $1.72 | 24d | 25 | 1.15mi |
Listing history 6 events
-
2026-06-18days on market $199,000 Active 6 DOM
-
2026-06-17days on market $199,000 Active 5 DOM
-
2026-06-16days on market $199,000 Active 4 DOM
-
2026-06-15days on market $199,000 Active 3 DOM
-
2026-06-13remarks 681-char remark
-
2026-06-13$199,000 Active 1 DOM
ⓘ Source: listings_history table (triggers on properties + properties_extension) + one-shot
backfill from property_details.listing_events for pre-trigger history.
Tax reassessment forecast GA · Resets to sale price
- Current annual tax
- $3,867 · $322/mo
- Projected year-2 tax
- $3,867 · $322/mo
- Expected delta
- $0/yr ($0/mo · -0.0%)
ⓘ Screening estimate from a state-policy table — verify with the county assessor before closing.
Climate risk First Street
- Flood 1/10 Low FEMA zone X (unshaded) · 0% chance over 30 yrs
- Wildfire 1/10 Low
- Heat 5/10 Major 7 d/yr ≥103°F today · 16 d/yr by 30 yrs out
- Wind 6/10 Major 27% chance of damaging wind over 30 yrs
- Air quality 4/10 Moderate 5 unhealthy d/yr today · 7 by 30 yrs out
Nearby sold comps map
Loading sold comps map…
Walkable amenities ~0.75 mi
Loading nearby amenities…
Taxation est. · year 1
- Rental income
- $28,356
- − Mortgage interest
- −$11,147
- − Property taxes
- −$3,867
- − Insurance
- −$995
- − Repairs & maintenance
- −$2,268
- − Management
- −$2,268
- − Depreciation
- −$5,789
- Taxable income
- $2,021
- Est. tax owed @ 24.0%
- −$485
- After-tax cash flow
- $4,531/yr
For passive investors: Depreciation is non-cash, so a rental often shows a tax loss while cash-flowing — sheltering income. Rental losses are passive: they offset passive income freely, and up to $25,000/yr can offset ordinary (W-2) income if you actively participate and your MAGI is under $100k (phasing out to $0 by $150k); unused losses carry forward. On sale, claimed depreciation is recaptured at up to 25%, and gains may owe capital-gains tax (a 1031 exchange can defer both). Figures are a year-1 estimate at your 24.0% rate — not tax advice; consult a CPA.
Schools (NCES district)
- District
- Atlanta Public Schools
- NCES district ID
- 1300120
- Math proficiency
- 28% ▼ -6.00%
- Reading proficiency
- 35% ▼ -2.00%
- Median HH income
- $48,306
- Composite
- 27.27/100
- National rank
- #7006
- State rank
- #80 of 174 in GA
Livability — Atlanta
- Score
- 83/100
- State rank
- #6
- US rank
- #919
Category grades
Schools grade is shown separately in the Schools card above.
Census & demographics
- Census place
- Atlanta, GA
- County
- Fulton County · 1,094,430 people
- City population
- 629,525
- Metro
- Atlanta-Sandy Springs-Alpharetta, GA
- Population (ZIP)
- 23,333
- Household income
- $42,089
- Rent vs Own
- Severe rent burden
- 1293.0
Population outlook (Fulton County) Hauer SSP2
- Today (2025)
- 1,203,707 people
- By 2030
- 1,299,706 · +8.0%
- By 2040
- 1,488,256 · +23.6%
- By 2050
- 1,664,580 · +38.3%
- By 2075
- 2,036,072 · +69.2%
- By 2100
- 2,222,402 · +84.6%
Race, ethnicity, and origin ACS 2023
- Neighborhood character
- Predominantly Black (76%)
- Race & ethnicity
- Black 76% White 11% Hispanic / Latino 7% Asian 4% Two or more races 3%
- Hispanic origin (detail)
- Mexican 4% Dominican 1%
- Common ancestry
- Lithuanian 1%
- Foreign-born
- 6% · Canada, China, South Korea
- Languages at home
- 89% English-only · Spanish 5% Other Indo-European 1% Chinese 1%
Political lean MEDSL · Fulton
- 2024 margin
- Solid D (+44.9) · D 71.9% · R 27.0% · Other 1.1%
- 2008→2024 swing
- +9.8pp toward D · 2008: 35.0pp · 2024: 44.9pp
- All cycles
- 2024: D+44.9 2020: D+46.4 2016: D+42.1 2012: D+29.6 2008: D+35.0
Not yet ingested
- Civics
- —
Market trends
- HPI YoY
- ▼ -95.32%
- Current HPI
- 321.4626
- Rent YoY
- ▲ 2.53%
- Metro
- Atlanta-Sandy Springs-Alpharetta, GA
- State GDP YoY
- ▲ 2.66%
- F500 in state
- 28
Industry mix (Fortune 500 HQ in GA)
| Industry | F500 HQs | Revenue |
|---|---|---|
| Paper / Packaging | 2 | $29B |
|
||
| Retail | 1 | $160B |
|
||
| Transportation / Logistics | 1 | $91B |
|
||
| Airlines | 1 | $62B |
|
||
| Consumer Goods | 1 | $47B |
|
||
| Utilities | 1 | $25B |
|
||
Price history
+504.9% since first listed48 events — show timeline
- 2026-06-12 Listed $199,000 FMLS
- 2026-06-12 Listed $199,000 GAMLS
- 2026-06-12 Listed $199,000 FMLS
- 2016-05-07 Price Changed $21,000 GAMLS
- 2016-05-05 Sold (MLS) $21,000 GAMLS
- 2016-04-12 Pending — GAMLS
- 2016-04-11 Price Changed $35,000 GAMLS
- 2016-04-06 Price Changed $35,000 GAMLS
- 2016-04-06 Price Changed $26,000 GAMLS
- 2016-03-23 Listed $30,000 GAMLS
- 2016-01-21 Listing Removed — GAMLS
- 2015-12-28 Relisted — GAMLS
- 2015-12-22 Pending — GAMLS
- 2015-12-15 Listed $25,000 GAMLS
- 2015-02-20 Price Changed $17,000 GAMLS
- 2015-02-04 Price Changed $17,000 FMLS
- 2015-02-04 Listing Removed — FMLS
- 2015-01-30 Sold (MLS) $17,000 GAMLS
- 2015-01-30 Sold (MLS) $17,000 FMLS
- 2015-01-30 Price Changed $23,100 FMLS
- 2015-01-13 Pending — FMLS
- 2015-01-13 Pending — GAMLS
- 2015-01-13 Price Changed $23,100 GAMLS
- 2015-01-07 Relisted — GAMLS
- 2015-01-07 Listing Removed — GAMLS
- 2015-01-02 Listed $23,100 FMLS
- 2014-12-30 Listing Removed — FMLS
- 2014-11-27 Price Changed $23,100 FMLS
- 2014-11-27 Price Changed $23,000 FMLS
- 2014-11-02 Price Changed $23,100 FMLS
- 2014-11-02 Price Changed $23,000 FMLS
- 2014-10-06 Listed $23,100 GAMLS
- 2014-10-04 Price Changed $23,100 FMLS
- 2014-10-01 Listing Removed — GAMLS
- 2014-09-28 Price Changed $23,000 GAMLS
- 2014-09-28 Listed $23,000 FMLS
- 2014-05-09 Listing Removed — FMLS
- 2014-03-13 Price Changed $56,000 GAMLS
- 2014-03-12 Price Changed $56,000 FMLS
- 2014-01-19 Listed $55,000 GAMLS
- 2013-12-30 Price Changed $55,000 FMLS
- 2013-12-22 Listed $49,000 FMLS
- 2009-06-04 Sold (MLS) $19,500 FMLS
- 2009-03-05 Listed $20,900 FMLS
- 2006-09-20 Sold (Public Records) $191,000 Public Records
- 2004-11-17 Sold (Public Records) $185,000 Public Records
- 2002-09-30 Sold (Public Records) $179,800 Public Records
- 1995-05-10 Sold (Public Records) $32,900 Public Records
Property tax history
+5.1%/yrLatest (2025): $3,867 · -0.1% YoY. Source: county tax records.
Cash-flow waterfall
monthlySold comps — $/sqft
last 12 mo · ≤1 miLoading sold comps…