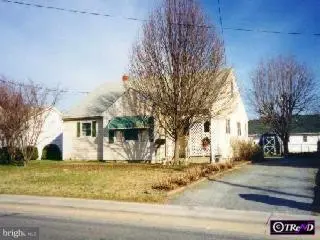
609 N Washington St · Milford, DE
Flood risk 1/10 · Minimal
- FEMA flood zone
- X (unshaded)
- Chance of flooding over 30 yrs
- 0.0%
- Est. flood insurance / yr
- $473 – $860
Fire risk 1/10 · Minimal
- Est. fire insurance / yr
- $476 – $884
Heat risk 8/10 · Major
- Hot days now (above 102°F)
- 7 days/yr
- Hot days in 30 yrs
- 17 days/yr
Wind risk 7/10 · Major
- Chance of severe wind over 30 yrs
- 76.0%
Air-quality risk 2/10 · Minimal
- Unhealthy air days now
- 1 days/yr
- Unhealthy air days in 30 yrs
- 1 days/yr
Risk factors via First Street. Map © Google.
Why this score? — see what drove the D+ grade
The composite is a weighted blend of 9 inputs, each scored 0–100. Each bar is that input's sub-score; the figure is the points it added to the 100-point composite (weight × sub-score).
- ARV discount +14.8/15.0
- Cash flow +13.6/30.0
- DSCR +4.1/10.0
- Livability +3.1/5.0
- 1% rule +2.6/10.0
- Rent growth +2.5/5.0
- Condition / age +2.5/5.0
- Schools +2.2/10.0
- Appreciation +0.0/10.0
$230,000
🖨 Deal sheet (PDF) 📄 Offer letter ✓ Due diligence
Listing remarks MLS
Don't Wait. .. . Four Bedroom With Central Air. Good In-Town Location. Well Kept. Some New Carpeting. Upstairs Rec Room Could Be 5th Bedroom. City Taxes Are $349.32 Annually.
Key facts
- 8,407 sq ft lot
- Built 1949
Neighborhood map
What this means for you Summary
Snapshot
- This is a 2-bed/1.5-bath single-family listed at $230k.
Deal economics
- At list price, monthly cash flow is $12 ($149/yr) — positive.
- The deal already cash-flows at list — no discount required.
- To meet the 1% rule (rent ≥ 1% of price), the offer needs to be $175k (23.7% below list).
- Recommended offer: $175k (23.7% below list) — sets the bar for 1% rule.
- Cap rate 6.4% vs local median 3.7% in Milford — top-decile yield for the area; either an underpriced asset or a hidden risk that comps aren't pricing in. Stress-test before assuming the spread holds.
Location & tenants
- Location reads 62/100 on livability (#61 in DE) — a middle-class / working-renter tenant base. Strengths: cost of living A+, health & safety A+, housing A-; Watch: schools D+, crime F, amenities F.
- Milford School District (town): math 18% / reading 32% proficiency, ranked #22 of 26 in DE (top 85%) — low school quality limits family demand, transient renter base, plan for 1-2y turnover.
- Market conditions: 207 active listings in the ZIP; 5 comparable units currently listed for rent nearby; rentals lingering (median 45d on market — plan ~5-8 weeks vacancy on turnover, expect pricing pressure); 100% of comp listings sitting > 30 days — soft ceiling on asking rent; 1,201 units permitted in Kent County in 2024 (116 in 5+ unit buildings).
Forward outlook
- Local home prices are declining (-3.0%/yr); year-one equity from $2k of loan paydown is wiped out by about $7k of value loss. Plan a longer hold.
- Kent County population projected at +22% by 2050 — long-run rental-demand tailwind backs the buy-and-hold thesis.
Negotiation context
- Only 0 days on market — expect competitive offers; lowballing is unlikely to land.
- 3 sale attempts since 26y ago with the ask held roughly flat each time — persistent listings suggest the price (not the market) is what's stuck; bring a comps-based counter.
- Current owner paid $132k; list at $230k implies a 75% gain — meaningful room to come down on a strong offer.
Risks & watch-outs
- Watch-outs: built in 1949 — expect roof / HVAC / electrical / plumbing capex.
- Climate carrying-cost: major wind risk, 76% chance of damaging wind over 30y; extreme-heat days projected 7→17/yr by 2055 (HVAC capex compounding) — expect insurance premiums to compound above CPI over the hold.
Questions for the listing agent
- Built in 1949 — when were the roof, HVAC, electrical panel, plumbing, and water heater last replaced?
- Is there a deadline driving the sale (1031 exchange, divorce, estate, relocation)? That informs how much negotiation room exists.
- Schools are D-rated, which usually means shorter tenancies and higher turnover. Who's the typical renter profile here, and what's been the actual vacancy rate?
- Crime grade is F in this area — have there been break-ins, vandalism, or insurance claims at this property in the last 3 years? What carrier currently insures it and at what premium?
- The area grade is low — what's the realistic commute time and amenity access for the typical tenant pool here? Any planned neighborhood developments (good or bad) we should know about?
- What's the average days-on-market for RENTAL listings here right now (not sales)? A rising rental-DOM trend means longer vacancies and softer asking-rent achievability than the comps imply.
- What's the recent tenant-quality profile in this submarket — average credit score on applications, eviction rate, late-payment / NSF rate, and stable-employment percentage? A property-management company in the area should have these aggregated.
- How much new for-sale + rental construction is in the pipeline within 1–3 miles? Heavy new supply typically softens prices + rents 12–24 months out; constrained supply supports both.
Investment metrics
- 1% rule
- 0.76% ✗
- Cap rate
- 6.36%
- Cash-on-cash
- 0.23%
- DSCR
- 1.01
- GRM
- 10.9
CMA / ARV
- ARV (on-the-fly)
- $274,688
- Comps found
- 12
Show comp detail 12 sales within ~0.75 mi
| Address | Dist | Beds/Ba | Sqft | Sold | Price | $/sf | Match |
|---|---|---|---|---|---|---|---|
| 211 N Washington St | 0.31mi | 3/1.0 (+1) | 1,180 (-0%) | 6mo | $255,000 | $216 | 74 |
| 419 N Walnut St | 0.20mi | 3/1.0 (+1) | 1,248 (+5%) | 7mo | $221,450 | $177 | 69 |
| 1 Governor Burton Ct | 0.15mi | 3/2.0 (+1) | 1,292 (+9%) | 8mo | $330,990 | $256 | 64 |
| 803 N Washington St | 0.22mi | 3/2.0 (+1) | 1,288 (+9%) | 6mo | $286,000 | $222 | 63 |
| 208 East St | 0.31mi | 3/1.0 (+1) | 1,110 (-6%) | 10mo | $250,000 | $225 | 60 |
| 213 N Washington St | 0.30mi | 3/2.0 (+1) | 1,100 (-7%) | 10mo | $306,000 | $278 | 59 |
| 37 General Torbert Dr | 0.16mi | 3/2.0 (+1) | 1,326 (+12%) | 9mo | $340,000 | $256 | 58 |
| 205 N Washington St | 0.33mi | 3/2.0 (+1) | 1,040 (-12%) | 8mo | $275,000 | $264 | 51 |
| 515 Truitt Ave | 0.41mi | 3/2.0 (+1) | 1,268 (+7%) | 14mo | $294,500 | $232 | 50 |
| 106 Brady Dr | 0.38mi | 3/2.0 (+1) | 1,352 (+14%) | 3mo | $287,000 | $212 | 49 |
| 435 North St | 0.28mi | 3/1.0 (+1) | 1,008 (-15%) | 12mo | $250,000 | $248 | 45 |
| 120 Mccolley St | 0.74mi | 2/1.0 | 1,056 (-11%) | 13mo | $170,000 | $161 | 35 |
Match score weights: distance 35% · size 25% · config 20% · recency 20%. Top-matched comps best support the ARV.
Projected returns pro-forma
-3.0% appreciation · 3.0% rent growth · sell at horizon
- IRR
- -16.0%
- Equity multiple
- 0.43×
- Total profit
- $-36,587
- Equity at exit
- $34,294
- IRR
- -7.7%
- Equity multiple
- 0.51×
- Total profit
- $-31,275
- Equity at exit
- $19,886
Cash invested: $64,400 (down + closing). Projections, not guarantees.
Landlord ↔ Tenant lean methodology
- Overall (STATE)
- 70 Landlord-Friendly
- State Delaware
- 70 Landlord-Friendly · D+7
- County
- — inherits STATE
- City
- — inherits STATE
ZIP-level market 19963
- Active inventory
- 207
- Price-to-rent
- 10.9×
Monthly cashflow live
- Estimated rent
- $1,754 high interval (Pro) →
- Mortgage (P&I)
- −$1,206
- Tax from tax record
- −$71 /mo · $856/yr
- Insurance
- −$96
- HOA
- −$0
- Vacancy / Maint / Mgmt
- −$368
- Net cashflow
- $12
Break-even live
Sensitivity live
| Price | -10% $143 | -5% $77 | +0% $12 | +5% $-53 | +10% $-118 |
|---|---|---|---|---|---|
| Rent | -10% $-126 | -5% $-57 | +0% $12 | +5% $82 | +10% $151 |
| Rate | -1.0pp $128 | -0.5pp $71 | base $12 | +0.5pp $-47 | +1.0pp $-108 |
UW: 25.0% down · 7.5% · 30yr · 1.5% tax · 5.0% vac · 8.0% maint · 8.0% mgmt
Financing live
Cash to close
- Down payment
- $57,500
- Closing costs
- $6,900
- Reserves months
- —
- Total cash needed
- —
Loan-product check · same deal, 3 products live
Conventional
25% down · 7.5% · 30yr
- Down + closing
- —
- Monthly P&I
- —
- Monthly cashflow
- —
- DSCR
- —
- Eligible?
- —
Personal DTI + credit; lowest rate.
DSCR
20% down · 8.5% · 30yr
- Down + closing
- —
- Monthly P&I
- —
- Monthly cashflow
- —
- DSCR
- —
- Eligible?
- —
No personal income docs; deal must DSCR.
Hard money
10% down · 12.0% · 12mo
- Down + closing
- —
- Monthly P&I
- —
- Monthly cashflow
- —
- DSCR
- —
- Eligible?
- —
Short-term bridge; refi at stabilization.
Rent comps 5 comps
| Address | Beds | Baths | Sqft | Rent | $/sqft | DOM | Units | Dist |
|---|---|---|---|---|---|---|---|---|
| 409 N Washington St Milford, DE | 3.0 | 1.5 | 1050 | $1,500 | $1.43 | 45d | 1 | 0.20mi |
| 400 N Walnut St Milford, DE | 3.0 | 2.0 | 1200 | $2,100 | $1.75 | 45d | 1 | 0.28mi |
| 139 NW Front St Milford, DE | 1.0 | 1.0 | 700 | $1,450 | $2.07 | 45d | 1 | 0.51mi |
| 100 Valley Dr Milford, DE | 1.0–3.0 | 1.0–2.0 | 1011 | $1,754 | $1.74 | 45d | 13 | 0.64mi |
| 17151 Windward Blvd Unit 8-203 Milford, DE | 3.0 | 2.0 | 1456 | $2,195 | $1.51 | 45d | 1 | 1.34mi |
Listing history 11 events
-
2026-05-28historical
-
2026-05-28$230,000
-
2004-07-06soldstatus $131,500
-
2004-06-30soldstatus $131,500 174-char remark
Show marketing remark (174 chars)
Don't Wait. .. . Four Bedroom With Central Air. Good In-Town Location. Well Kept. Some New Carpeting. Upstairs Rec Room Could Be 5th Bedroom. City Taxes Are $349.32 Annually.
-
2004-05-25historical 174-char remark
Show marketing remark (174 chars)
Don't Wait. .. . Four Bedroom With Central Air. Good In-Town Location. Well Kept. Some New Carpeting. Upstairs Rec Room Could Be 5th Bedroom. City Taxes Are $349.32 Annually.
-
2004-05-15$131,500 174-char remark
Show marketing remark (174 chars)
Don't Wait. .. . Four Bedroom With Central Air. Good In-Town Location. Well Kept. Some New Carpeting. Upstairs Rec Room Could Be 5th Bedroom. City Taxes Are $349.32 Annually.
-
2000-05-31soldstatus $85,500
-
2000-05-31soldstatus $85,500
-
2000-05-30soldstatus $85,500 148-char remark
Show marketing remark (148 chars)
Great Starter Home; Great Location. Ready To Move In. (Home Has One Full Bath And Potential For Additional 1/2 Bath -- All That's Needed Is Commode)
-
2000-04-05historical 148-char remark
Show marketing remark (148 chars)
Great Starter Home; Great Location. Ready To Move In. (Home Has One Full Bath And Potential For Additional 1/2 Bath -- All That's Needed Is Commode)
-
2000-02-28$85,500 148-char remark
Show marketing remark (148 chars)
Great Starter Home; Great Location. Ready To Move In. (Home Has One Full Bath And Potential For Additional 1/2 Bath -- All That's Needed Is Commode)
ⓘ Source: listings_history table (triggers on properties + properties_extension) + one-shot
backfill from property_details.listing_events for pre-trigger history.
Tax reassessment forecast DE · Partial reset (capped growth)
- Current annual tax
- $856 · $71/mo
- Projected year-2 tax
- $1,095 · $91/mo
- Expected delta
- +$239/yr (+$20/mo · 27.9%)
ⓘ Screening estimate from a state-policy table — verify with the county assessor before closing.
Climate risk First Street
- Flood 1/10 Low FEMA zone X (unshaded) · 0% chance over 30 yrs
- Wildfire 1/10 Low
- Heat 8/10 Severe 7 d/yr ≥102°F today · 17 d/yr by 30 yrs out
- Wind 7/10 Severe 76% chance of damaging wind over 30 yrs
- Air quality 2/10 Low 1 unhealthy d/yr today · 1 by 30 yrs out
Nearby sold comps map
Loading sold comps map…
Walkable amenities ~0.75 mi
Loading nearby amenities…
Taxation est. · year 1
- Rental income
- $21,049
- − Mortgage interest
- −$12,884
- − Property taxes
- −$856
- − Insurance
- −$1,150
- − Repairs & maintenance
- −$1,684
- − Management
- −$1,684
- − Depreciation
- −$6,691
- Taxable loss
- −$3,900
- Est. tax savings @ 24.0%
- +$936
- After-tax cash flow
- $1,085/yr
For passive investors: Depreciation is non-cash, so a rental often shows a tax loss while cash-flowing — sheltering income. Rental losses are passive: they offset passive income freely, and up to $25,000/yr can offset ordinary (W-2) income if you actively participate and your MAGI is under $100k (phasing out to $0 by $150k); unused losses carry forward. On sale, claimed depreciation is recaptured at up to 25%, and gains may owe capital-gains tax (a 1031 exchange can defer both). Figures are a year-1 estimate at your 24.0% rate — not tax advice; consult a CPA.
Schools (NCES district)
- District
- Milford School District
- NCES district ID
- 1001080
- Math proficiency
- 18% ▼ -26.00%
- Reading proficiency
- 32% ▼ -19.00%
- Median HH income
- $51,794
- Composite
- 22.18/100
- National rank
- #8162
- State rank
- #22 of 26 in DE
Livability — Milford
- Score
- 62/100
- State rank
- #61
- US rank
- #16211
Category grades
Schools grade is shown separately in the Schools card above.
Census & demographics
- Census place
- Milford, DE
- Population (ZIP)
- 22,544
Population outlook (Kent County) Hauer SSP2
- Today (2025)
- 194,477 people
- By 2030
- 204,351 · +5.1%
- By 2040
- 222,135 · +14.2%
- By 2050
- 236,483 · +21.6%
- By 2075
- 266,327 · +36.9%
- By 2100
- 275,335 · +41.6%
Race, ethnicity, and origin ACS 2023
- Neighborhood character
- Diverse neighborhood (Simpson 0.56)
- Race & ethnicity
- White 62% Black 20% Hispanic / Latino 10% Two or more races 7% Asian 3%
- Hispanic origin (detail)
- Mexican 4% Puerto Rican 2%
- Common ancestry
- Hispanic 3% Romanian 2% Slovak 1%
- Foreign-born
- 11% · Canada, China
- Languages at home
- 84% English-only · Spanish 7% French/Haitian/Cajun 5% Other Indo-European 2%
Political lean MEDSL · Kent
- 2024 margin
- Toss-up / Even · D 50.2% · R 48.2% · Other 1.7%
- 2008→2024 swing
- -7.8pp toward R · 2008: 9.8pp · 2024: 2.0pp
- All cycles
- 2024: D+2.0 2020: D+4.1 2016: R+4.9 2012: D+4.9 2008: D+9.8
Not yet ingested
- Civics
- —
Market trends
- HPI YoY
- ▼ -135.01%
- Current HPI
- 227.2369
- Rent YoY
- —
- Metro
- —
- State GDP YoY
- —
- F500 in state
- 0
Price history
+169.0% since first listed11 events — show timeline
- 2026-05-28 Listing Removed — BRIGHT MLS
- 2026-05-28 Listed $230,000 BRIGHT MLS
- 2004-07-06 Sold (Public Records) $131,500 Public Records
- 2004-06-30 Sold (MLS) $131,500 BRIGHT MLS
- 2004-05-25 Listing Removed — BRIGHT MLS
- 2004-05-15 Listed $131,500 BRIGHT MLS
- 2000-05-31 Sold (Public Records) $85,500 Public Records
- 2000-05-31 Sold (Public Records) $85,500 Public Records
- 2000-05-30 Sold (MLS) $85,500 BRIGHT MLS
- 2000-04-05 Listing Removed — BRIGHT MLS
- 2000-02-28 Listed $85,500 BRIGHT MLS
Property tax history
+5.0%/yrLatest (2025): $856 · -4.2% YoY. Source: county tax records.
Cash-flow waterfall
monthlySold comps — $/sqft
last 12 mo · ≤1 miLoading sold comps…