 🌊 Lakefront
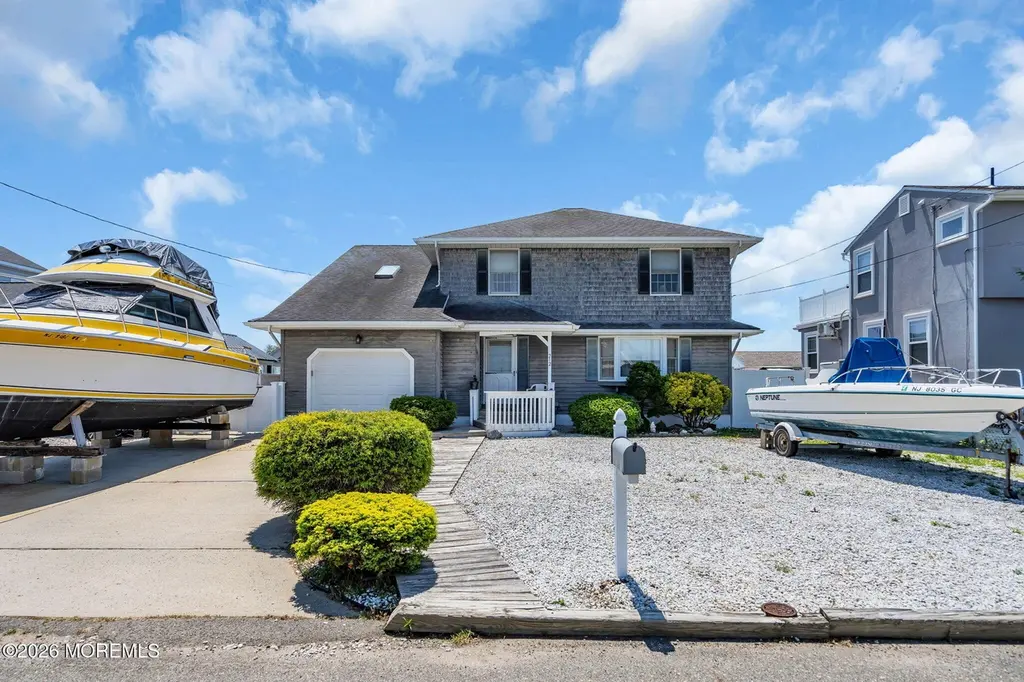
212 Cypress Dr · Ocean Gate, NJ
Flood risk 9/10 · Severe
- FEMA flood zone
- AE
- Chance of flooding over 30 yrs
- 0.99%
- Est. flood insurance / yr
- $1,737 – $8,500
Fire risk 2/10 · Minimal
- Est. fire insurance / yr
- $526 – $976
Heat risk 8/10 · Major
- Hot days now (above 98°F)
- 7 days/yr
- Hot days in 30 yrs
- 15 days/yr
Wind risk 8/10 · Major
- Chance of severe wind over 30 yrs
- 80.0%
Air-quality risk 3/10 · Minor
- Unhealthy air days now
- 3 days/yr
- Unhealthy air days in 30 yrs
- 3 days/yr
Risk factors via First Street. Map © Google.
Why this score? — see what drove the D- grade
The composite is a weighted blend of 9 inputs, each scored 0–100. Each bar is that input's sub-score; the figure is the points it added to the 100-point composite (weight × sub-score).
- Cash flow +17.9/30.0
- DSCR +5.6/10.0
- 1% rule +4.3/10.0
- Livability +3.1/5.0
- Schools +2.6/10.0
- Rent growth +2.5/5.0
- Condition / age +2.5/5.0
- ARV discount +0.0/15.0
- Appreciation +0.0/10.0
$880,000
🖨 Deal sheet 📄 Offer letter ✓ Due diligence
Listing remarks
This structurally sound custom home sits on a deep water lagoon located in the Glen Cove section & was built by the owner with love and grit and offers a sturdy roof, strong framing and a solid foundation built on reinforced pilings over and above with what was required. Sprinkler System & heat in the garage. Weil McClain Heating System w/ maintenance plan through NJR, home has been extra insulated, it has a recirculating hot water system, 4' high, easy access crawl space, dry & vented and offers additional storage. 4 BRs, 3 baths, new floor in living room, new insulated garage door, pull down attic w/ storage. 2 Sheds, double wide concrete driveway, 60' dock, w/ upper de
Key facts
- Deep water lagoon
- Strong framing
- Solid foundation
Tags
Property features AI
Exterior
- Parking: Attached 1-car garage
- Utilities: Public sewer
- Home design: Fee simple ownership
- Construction: Shingle roof; Crawl space or no basement
- Exterior features: Lagoon waterfront
Interior
- Kitchen: Stove; Gas cooking; Microwave; Dishwasher; Refrigerator; Stove hood
- Bedrooms: 4 bedrooms
- Flooring: Vinyl; Ceramic tile; Wood
- Bathrooms: 2 full bathrooms and 1 half bathroom (3 total)
- Heating & cooling: Baseboard heating with 2 heat zones; Central air conditioning
- Interior features: Window treatments and blinds/shades; Ceiling fans; Central vacuum; Attic fan; Garage door opener; Gas cooking
- Laundry & utility: Washer; Dryer
Neighborhood map
What this means for you Summary
Snapshot
- This is a 4-bed/2.0-bath single-family listed at $880k.
Deal economics
- At list price, monthly cash flow is $311 ($4k/yr) — positive.
- The deal already cash-flows at list — no discount required.
- To meet the 1% rule (rent ≥ 1% of price), the offer needs to be $821k (6.7% below list).
- Recommended offer: $821k (6.7% below list) — sets the bar for 1% rule.
- Cap rate 7.3% vs local median 3.0% in Ocean Gate — top-decile yield for the area; either an underpriced asset or a hidden risk that comps aren't pricing in. Stress-test before assuming the spread holds.
Location & tenants
- Location reads 62/100 on livability (#439 in NJ) — a middle-class / working-renter tenant base. Strengths: crime B+, housing B+, health & safety B+; Watch: schools C-, employment C-, amenities F.
- Central Regional School District (suburban): math 17% / reading 43% proficiency, ranked #357 of 472 in NJ (top 76%) — families likely to look elsewhere, expect single-tenant / working-renter base with shorter leases.
- Market conditions: 175 active listings in the ZIP; 2 comparable units currently listed for rent nearby; 4,434 units permitted in Ocean County in 2024 (868 in 5+ unit buildings).
Forward outlook
- Local home prices are declining (-3.0%/yr); year-one equity from $6k of loan paydown is wiped out by about $26k of value loss. Plan a longer hold.
- Ocean County population projected to shrink 8% by 2050 — rents likely to lag national; underwrite the cash flow, not the appreciation.
Negotiation context
- It's been on market 30 days — a 2% lower offer ($867k) is reasonable based on typical stale-listing flexibility.
Risks & watch-outs
- Watch-outs: flood insurance adds $427/mo.
- Climate carrying-cost: in FEMA flood zone AE (mandatory federal flood insurance); severe wind risk, 80% chance of damaging wind over 30y; extreme-heat days projected 7→15/yr by 2055 (HVAC capex compounding) — expect insurance premiums to compound above CPI over the hold.
Questions for the listing agent
- What's the actual annual flood-insurance premium (NFIP or private), and is the property in a SFHA with mandatory coverage?
- Is there a deadline driving the sale (1031 exchange, divorce, estate, relocation)? That informs how much negotiation room exists.
- The area grade is low — what's the realistic commute time and amenity access for the typical tenant pool here? Any planned neighborhood developments (good or bad) we should know about?
- This sits on a lake — are riparian / water-frontage rights deeded with the parcel? Any dock permits, shoreline easements, or HOA water-use restrictions?
- What's the documented flood / surge / shoreline-erosion history here (FEMA AND non-FEMA — e.g., storm surge, creek backup, septic-field saturation)?
- Any water-quality or seasonal algae-bloom issues that affect tenant satisfaction or short-term-rental demand?
- What's the average days-on-market for RENTAL listings here right now (not sales)? A rising rental-DOM trend means longer vacancies and softer asking-rent achievability than the comps imply.
- What's the recent tenant-quality profile in this submarket — average credit score on applications, eviction rate, late-payment / NSF rate, and stable-employment percentage? A property-management company in the area should have these aggregated.
- How much new for-sale + rental construction is in the pipeline within 1–3 miles? Heavy new supply typically softens prices + rents 12–24 months out; constrained supply supports both.
Investment metrics
- 1% rule
- 0.93% ✗
- Cap rate
- 7.30%
- Cash-on-cash
- 3.59%
- DSCR
- 1.16
- GRM
- 8.9
CMA / ARV
- ARV (on-the-fly)
- $602,742
- Comps found
- 4
Show comp detail 4 sales within ~0.75 mi
| Address | Dist | Beds/Ba | Sqft | Sold | Price | $/sf | Match |
|---|---|---|---|---|---|---|---|
| 211 Pine Dr | 0.40mi | 4/3.0 | 1,715 (+8%) | 3mo | $827,000 | $482 | 61 |
| 215 Fernwood Dr | 0.29mi | 3/2.0 (-1) | 1,508 (-5%) | 23mo | $575,000 | $381 | 55 |
| 217 N Bay Dr | 0.57mi | 3/2.0 (-1) | 1,744 (+10%) | 6mo | $635,000 | $364 | 46 |
| 299 Parisen Ave | 0.53mi | 3/2.0 (-1) | 1,488 (-6%) | 19mo | $399,000 | $268 | 45 |
Match score weights: distance 35% · size 25% · config 20% · recency 20%. Top-matched comps best support the ARV.
Projected returns pro-forma
-3.0% appreciation · 3.0% rent growth · sell at horizon
- IRR
- -13.9%
- Equity multiple
- 0.50×
- Total profit
- $-122,637
- Equity at exit
- $131,211
- IRR
- -5.0%
- Equity multiple
- 0.67×
- Total profit
- $-80,585
- Equity at exit
- $76,086
Cash invested: $246,400 (down + closing). Projections, not guarantees.
Landlord ↔ Tenant lean methodology
- Overall (STATE)
- 21 Tenant-Leaning
- State New Jersey
- 21 Tenant-Leaning · D+6
- County
- — inherits STATE
- City
- — inherits STATE
ZIP-level market 08721
- Active inventory
- 175
- Price-to-rent
- 8.9×
Monthly cashflow live
- Estimated rent
- $8,209 medium interval (Pro) →
- Mortgage (P&I)
- −$4,615
- Tax from tax record
- −$767 /mo · $9,200/yr
- Insurance
- −$367
- Flood insurance flood zone
- −$427 /mo · $5,118/yr
- HOA
- −$0
- Vacancy / Maint / Mgmt
- −$1,724
- Net cashflow
- $311
Break-even live
UW: 25.0% down · 7.5% · 30yr · 1.5% tax · 5.0% vac · 8.0% maint · 8.0% mgmt
Financing live
Cash to close
- Down payment
- $220,000
- Closing costs
- $26,400
- Reserves months
- —
- Total cash needed
- —
Loan-product check · same deal, 3 products live
Conventional
25% down · 7.5% · 30yr
- Down + closing
- —
- Monthly P&I
- —
- Monthly cashflow
- —
- DSCR
- —
- Eligible?
- —
Personal DTI + credit; lowest rate.
DSCR
20% down · 8.5% · 30yr
- Down + closing
- —
- Monthly P&I
- —
- Monthly cashflow
- —
- DSCR
- —
- Eligible?
- —
No personal income docs; deal must DSCR.
Hard money
10% down · 12.0% · 12mo
- Down + closing
- —
- Monthly P&I
- —
- Monthly cashflow
- —
- DSCR
- —
- Eligible?
- —
Short-term bridge; refi at stabilization.
Rent comps 2 comps
| Address | Beds | Baths | Sqft | Rent | $/sqft | DOM | Units | Dist |
|---|---|---|---|---|---|---|---|---|
| 830 Atlantic City Blvd Bayville, NJ | 3.0 | 2.0 | 1736 | $2,800 | $1.61 | 43d | 1 | 1.09mi |
| 406 Lawrence Dr Lanoka Harbor, NJ | 3.0 | 2.0 | 1836 | $16,000 | $8.71 | 1d | 1 | 1.48mi |
Listing history 15 events
-
2026-06-18days on market $880,000 Active 30 DOM
-
2026-06-17days on market $880,000 Active 29 DOM
-
2026-06-16days on market $880,000 Active 28 DOM
-
2026-06-15days on market $880,000 Active 27 DOM
-
2026-06-13days on market $880,000 Active 25 DOM
-
2026-06-13days on market $880,000 Active 24 DOM
-
2026-06-09days on market $880,000 Active 21 DOM
-
2026-06-08days on market $880,000 Active 20 DOM
-
2026-06-07days on market $880,000 Active 19 DOM
-
2026-06-04days on market $880,000 Active 16 DOM
-
2026-06-03days on market $880,000 Active 15 DOM
-
2026-06-02days on market $880,000 Active 14 DOM
-
2026-06-01days on market $880,000 Active 13 DOM
-
2026-05-31days on market $880,000 Active 12 DOM
-
2026-05-19$880,000 Active
ⓘ Source: listings_history table (triggers on properties + properties_extension) + one-shot
backfill from property_details.listing_events for pre-trigger history.
Tax reassessment forecast NJ · Partial reset (capped growth)
- Current annual tax
- $9,200 · $767/mo
- Projected year-2 tax
- $15,556 · $1,296/mo
- Expected delta
- +$6,356/yr (+$530/mo · 69.1%)
ⓘ Screening estimate from a state-policy table — verify with the county assessor before closing.
Climate risk First Street
- Flood 9/10 Extreme FEMA zone AE · 99% chance over 30 yrs
- Wildfire 2/10 Low
- Heat 8/10 Severe 7 d/yr ≥98°F today · 15 d/yr by 30 yrs out
- Wind 8/10 Severe 80% chance of damaging wind over 30 yrs
- Air quality 3/10 Moderate 3 unhealthy d/yr today · 3 by 30 yrs out
Nearby sold comps map
Loading sold comps map…
Walkable amenities ~0.75 mi
Loading nearby amenities…
Taxation est. · year 1
- Rental income
- $98,510
- − Mortgage interest
- −$49,294
- − Property taxes
- −$9,200
- − Insurance
- −$9,518
- − Repairs & maintenance
- −$7,881
- − Management
- −$7,881
- − Depreciation
- −$25,600
- Taxable loss
- −$10,864
- Est. tax savings @ 24.0%
- +$2,607
- After-tax cash flow
- $6,334/yr
For passive investors: Depreciation is non-cash, so a rental often shows a tax loss while cash-flowing — sheltering income. Rental losses are passive: they offset passive income freely, and up to $25,000/yr can offset ordinary (W-2) income if you actively participate and your MAGI is under $100k (phasing out to $0 by $150k); unused losses carry forward. On sale, claimed depreciation is recaptured at up to 25%, and gains may owe capital-gains tax (a 1031 exchange can defer both). Figures are a year-1 estimate at your 24.0% rate — not tax advice; consult a CPA.
Schools (NCES district)
- District
- Central Regional School District
- NCES district ID
- 3402910
- Math proficiency
- 17% ▼ -14.00%
- Reading proficiency
- 43% ▲ 7.00%
- Median HH income
- $44,676
- Composite
- 25.59/100
- National rank
- #7422
- State rank
- #357 of 472 in NJ
Livability — Ocean Gate
- Score
- 62/100
- State rank
- #439
- US rank
- #16152
Category grades
Schools grade is shown separately in the Schools card above.
Census & demographics
- City population
- 1,768
- Population (ZIP)
- 22,464
Population outlook (Ocean County) Hauer SSP2
- Today (2025)
- 586,991 people
- By 2030
- 581,403 · -1.0%
- By 2040
- 564,913 · -3.8%
- By 2050
- 538,149 · -8.3%
- By 2075
- 468,845 · -20.1%
- By 2100
- 350,297 · -40.3%
Race, ethnicity, and origin ACS 2023
- Neighborhood character
- Predominantly White (83%)
- Race & ethnicity
- White 83% Hispanic / Latino 8% Two or more races 6% Asian 4% Black 2%
- Hispanic origin (detail)
- Puerto Rican 3%
- Common ancestry
- Romanian 7% Scotch-Irish 2% Slovak 2%
- Foreign-born
- 7% · Canada, South Korea, Jamaica
- Languages at home
- 90% English-only · Spanish 4% Other Indo-European 2% Tagalog/Filipino 2%
Political lean MEDSL · Ocean
- 2024 margin
- Solid R (+36.0) · D 31.4% · R 67.4% · Other 1.2%
- 2008→2024 swing
- -17.6pp toward R · 2008: -18.4pp · 2024: -36.0pp
- All cycles
- 2024: R+36.0 2020: R+28.7 2016: R+34.0 2012: R+17.7 2008: R+18.4
Not yet ingested
- Civics
- —
Market trends
- HPI YoY
- ▼ -320.09%
- Current HPI
- 346.8393
- Rent YoY
- —
- Metro
- —
- State GDP YoY
- ▲ 2.05%
- F500 in state
- 34
Industry mix (Fortune 500 HQ in NJ)
| Industry | F500 HQs | Revenue |
|---|---|---|
| Consumer Goods | 3 | $31B |
|
||
| Pharmaceuticals | 2 | $153B |
|
||
| Technology | 2 | $21B |
|
||
| Insurance | 2 | $20B |
|
||
| Healthcare | 2 | $19B |
|
||
| Financial Services | 1 | $70B |
|
||
Price history
1 event — show timeline
- 2026-05-19 Listed $880,000 MOMLS
Property tax history
+4.1%/yrLatest (2025): $9,200 · +7.4% YoY. Source: county tax records.
Cash-flow waterfall
monthlySold comps — $/sqft
last 12 mo · ≤1 miLoading sold comps…