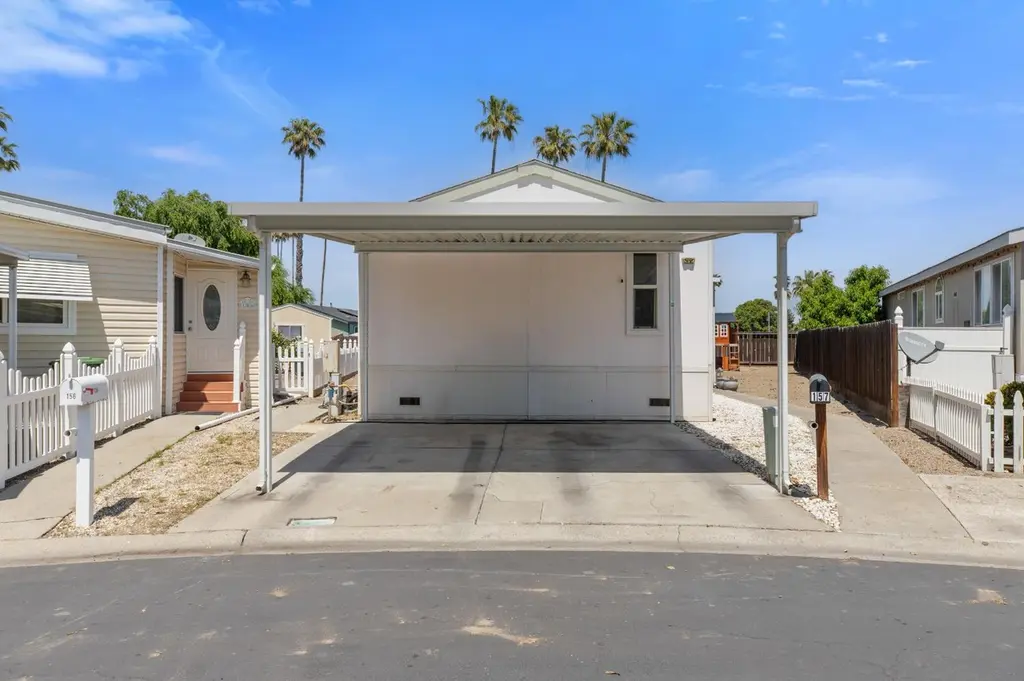
2929 N Macarthur Dr #157 · Tracy, CA
Flood risk 1/10 · Minimal
- FEMA flood zone
- X (unshaded)
- Chance of flooding over 30 yrs
- 0.0%
- Est. flood insurance / yr
- $507 – $1,088
Fire risk 2/10 · Minimal
- Est. fire insurance / yr
- $659 – $1,223
Heat risk 6/10 · Moderate
- Hot days now (above 103°F)
- 7 days/yr
- Hot days in 30 yrs
- 15 days/yr
Wind risk 1/10 · Minimal
- Chance of severe wind over 30 yrs
- —
Air-quality risk 10/10 · Severe
- Unhealthy air days now
- 25 days/yr
- Unhealthy air days in 30 yrs
- 26 days/yr
Risk factors via First Street. Map © Google.
Why this score? — see what drove the B- grade
The composite is a weighted blend of 9 inputs, each scored 0–100. Each bar is that input's sub-score; the figure is the points it added to the 100-point composite (weight × sub-score).
- Cash flow +29.8/30.0
- DSCR +10.0/10.0
- 1% rule +8.4/10.0
- ARV discount +5.7/15.0
- Condition / age +3.8/5.0
- Rent growth +3.3/5.0
- Livability +3.1/5.0
- Schools +2.8/10.0
- Appreciation +0.0/10.0
$185,000
🖨 Deal sheet 📄 Offer letter ✓ Due diligence
Listing remarks
Discover an exceptional opportunity at 2929 N MacArthur Dr #157, Tracy, CA, where the allure of mobile home living is redefined. All ages Green Oaks Mobile Home Park! This property offers a unique blend of comfort and convenience, perfect for those seeking a vibrant lifestyle. Step outside to your private yard, an ideal space for relaxation or entertaining, offering a personal sanctuary. The attached carport provides practical and sheltered parking, ensuring ease and protection for your vehicle. Embrace a distinctive living experience that combines privacy with practicality in this inviting mobile home.
Key facts
- Attached carport
- Private yard
- Parking
Tags
Property features AI
Finance
- Other: Located at 2929 N MacArthur Dr #157, Tracy, CA 95376; Cross street: Grant Line; directions: Grantline to Macarthur
- Financial info: Land lease: No (listed land lease amount present separately)
- HOA & community: No homeowners association; Not a senior community
Exterior
- Parking: Attached covered parking
- Utilities: 220 volts in laundry; Public water; Public sewer
- Home design: Manufactured home located in a park; Double-wide; Built in 2006
- Construction: Vinyl skirting; Karsten manufactured home
- Exterior features: Composition roof; Other lot features
Interior
- Kitchen: Free-standing gas range; Hood over range; Dishwasher; Microwave; Free-standing gas oven
- Bedrooms: 3 bedrooms
- Flooring: Carpet
- Bathrooms: 2 full bathrooms; Tub with shower over
- Heating & cooling: Central heating; Central air conditioning
- Interior features: Great room living area; Dining and family room combined; Synthetic kitchen countertops
- Laundry & utility: Washer and dryer included; Laundry located inside
Neighborhood map
What this means for you Summary
Snapshot
- This is a 3-bed/2.0-bath manufactured listed at $185k. Condition is rated good.
Deal economics
- At list price, monthly cash flow is $681 ($8k/yr) — positive.
- The deal already cash-flows at list — no discount required.
- Meets the 1% rule at list price ($2k rent vs $185k).
- Recommended offer: $179k (3.0% below list) — sets the bar for market timing.
- Cap rate 10.7% vs local median 2.6% in Tracy — top-decile yield for the area; either an underpriced asset or a hidden risk that comps aren't pricing in. Stress-test before assuming the spread holds.
Location & tenants
- Location reads 62/100 on livability (#496 in CA) — a middle-class / working-renter tenant base. Strengths: employment A+, housing A+; Watch: schools D, amenities F, commute F.
- Tracy Joint Unified (suburban): math 22% / reading 37% proficiency, ranked #305 of 517 in CA (top 59%) — low school quality limits family demand, transient renter base, plan for 1-2y turnover.
- Market conditions: Rents rising (+3.2%/yr); 160 active listings in the ZIP; 16 comparable units currently listed for rent nearby; rentals leasing fast (median 3d on market — plan ~1-2 weeks tenant-placement turnaround); solid renter incomes; 3,779 units permitted in San Joaquin County in 2024 (0 in 5+ unit buildings).
Forward outlook
- Local home prices are declining (-3.0%/yr); year-one equity from $1k of loan paydown is wiped out by about $6k of value loss. Plan a longer hold.
- San Joaquin County population projected at +17% by 2050 — long-run rental-demand tailwind backs the buy-and-hold thesis.
- At projected returns (-3.0% appreciation + 3.2% rent growth), your $52k cash investment doubles in ~8 years — after that, you're playing with house money.
Negotiation context
- It's been on market 55 days — a 3% lower offer ($179k) is reasonable based on typical stale-listing flexibility.
Risks & watch-outs
- Climate carrying-cost: extreme-heat days projected 7→15/yr by 2055 (HVAC capex compounding) — expect insurance premiums to compound above CPI over the hold.
Questions for the listing agent
- It's been on market 55 days. Have you received any prior offers? Is the seller open to a 3% concession, seller financing, or rate buy-down credit?
- Is there a deadline driving the sale (1031 exchange, divorce, estate, relocation)? That informs how much negotiation room exists.
- Schools are D-rated, which usually means shorter tenancies and higher turnover. Who's the typical renter profile here, and what's been the actual vacancy rate?
- What's the average days-on-market for RENTAL listings here right now (not sales)? A rising rental-DOM trend means longer vacancies and softer asking-rent achievability than the comps imply.
- What's the recent tenant-quality profile in this submarket — average credit score on applications, eviction rate, late-payment / NSF rate, and stable-employment percentage? A property-management company in the area should have these aggregated.
- How much new for-sale + rental construction is in the pipeline within 1–3 miles? Heavy new supply typically softens prices + rents 12–24 months out; constrained supply supports both.
Investment metrics
- 1% rule
- 1.34% ✓
- Cap rate
- 10.71%
- Cash-on-cash
- 15.77%
- DSCR
- 1.70
- GRM
- 6.2
CMA / ARV
- ARV (on-the-fly)
- $178,020
- Comps found
- 3
Show comp detail 3 sales within ~0.75 mi
| Address | Dist | Beds/Ba | Sqft | Sold | Price | $/sf | Match |
|---|---|---|---|---|---|---|---|
| 2929 N Macarthur Dr #19 | 0.01mi | 3/2.0 | 990 (-4%) | 15mo | $170,000 | $172 | 80 |
| 2929 N Macarthur Dr #92 | 0.01mi | 2/2.0 (-1) | 1,060 (+2%) | 19mo | $170,000 | $160 | 75 |
| 2929 N Macarthur Dr #51 | 0.00mi | 2/2.0 (-1) | 956 (-8%) | 16mo | $200,000 | $209 | 69 |
Match score weights: distance 35% · size 25% · config 20% · recency 20%. Top-matched comps best support the ARV.
Projected returns pro-forma
-3.0% appreciation · 3.24% rent growth · sell at horizon
- IRR
- 6.9%
- Equity multiple
- 1.27×
- Total profit
- $14,026
- Equity at exit
- $27,584
- IRR
- 16.5%
- Equity multiple
- 2.36×
- Total profit
- $70,683
- Equity at exit
- $15,995
Cash invested: $51,800 (down + closing). Projections, not guarantees.
Landlord ↔ Tenant lean methodology
- Overall (STATE)
- 18 Strongly Tenant-Friendly
- State California
- 18 Strongly Tenant-Friendly · D+13
- County
- — inherits STATE
- City
- — inherits STATE
ZIP-level market 95376
- Rents YoY
- 3.2%
- Active inventory
- 160
- Price-to-rent
- 6.2×
Monthly cashflow live
- Estimated rent
- $2,480 high interval (Pro) →
- Mortgage (P&I)
- −$970
- Tax est. 1.5%
- −$231 /mo · $2,775/yr
- Insurance
- −$77
- HOA
- −$0
- Vacancy / Maint / Mgmt
- −$521
- Net cashflow
- $681
Break-even live
UW: 25.0% down · 7.5% · 30yr · 1.5% tax · 5.0% vac · 8.0% maint · 8.0% mgmt
Financing live
Cash to close
- Down payment
- $46,250
- Closing costs
- $5,550
- Reserves months
- —
- Total cash needed
- —
Loan-product check · same deal, 3 products live
Conventional
25% down · 7.5% · 30yr
- Down + closing
- —
- Monthly P&I
- —
- Monthly cashflow
- —
- DSCR
- —
- Eligible?
- —
Personal DTI + credit; lowest rate.
DSCR
20% down · 8.5% · 30yr
- Down + closing
- —
- Monthly P&I
- —
- Monthly cashflow
- —
- DSCR
- —
- Eligible?
- —
No personal income docs; deal must DSCR.
Hard money
10% down · 12.0% · 12mo
- Down + closing
- —
- Monthly P&I
- —
- Monthly cashflow
- —
- DSCR
- —
- Eligible?
- —
Short-term bridge; refi at stabilization.
Rent comps 16 comps
| Address | Beds | Baths | Sqft | Rent | $/sqft | DOM | Units | Dist |
|---|---|---|---|---|---|---|---|---|
| 321 E Grant Line Rd Tracy, CA | 2.0 | 2.0 | 963 | $2,200 | $2.28 | 2d | 1 | 0.32mi |
| 80 Portola Way Tracy, CA | 2.0 | 2.0 | 1050 | $1,995 | $1.90 | 2d | 1 | 0.52mi |
| 3255 Holly Dr Tracy, CA | 2.0 | 1.0 | 975 | $2,200 | $2.26 | 2d | 1 | 0.61mi |
| 115 E Emerson Ave Tracy, CA | 3.0 | 2.0 | 1112 | $2,475 | $2.23 | 21d | 1 | 0.77mi |
| 3440 Buthmann Ave Tracy, CA | 3.0 | 2.0 | 1068 | $2,550 | $2.39 | 19d | 1 | 0.85mi |
| 2921 Alene Ave Tracy, CA | 3.0 | 1.5 | 1084 | $2,400 | $2.21 | 23d | 1 | 0.93mi |
| 498 Hintz Ave Tracy, CA | 3.0 | 1.5 | 1084 | $2,420 | $2.23 | 2d | 1 | 0.93mi |
| 2800 N Tracy Blvd Tracy, CA | 1.0–2.0 | 1.0–2.0 | 824 | $2,495 | $3.03 | 2d | 9 | 0.99mi |
| 2910 N Tracy Blvd Unit 44 Tracy, CA | 2.0 | 1.0 | 850 | $1,750 | $2.06 | 14d | 1 | 1.02mi |
| 1720 Bessie Ave Tracy, CA | 3.0 | 1.0 | 1080 | $2,475 | $2.29 | 2d | 1 | 1.14mi |
| 1650 Bessie Ave Tracy, CA | 2.0 | 1.0 | 800 | $2,100 | $2.62 | 10d | 1 | 1.18mi |
| 950 W Grant Line Rd Tracy, CA | 1.0–3.0 | 1.0–2.0 | 821 | $2,685 | $3.27 | 2d | 15 | 1.25mi |
| 2680 Bonifacio Dr Tracy, CA | 3.0 | 2.0 | 1332 | $3,000 | $2.25 | 3d | 1 | 1.36mi |
| 1145 Parker Ave Tracy, CA | 2.0 | 1.0 | 700 | $2,095 | $2.99 | 2d | 1 | 1.43mi |
| 1143 Parker Ave Tracy, CA | 2.0 | 1.0 | 700 | $2,095 | $2.99 | 2d | 1 | 1.43mi |
| 1143 Wall St Tracy, CA | 2.0 | 2.0 | 995 | $2,600 | $2.61 | 2d | 1 | 1.48mi |
Listing history 15 events
-
2026-06-18days on market $185,000 Active 55 DOM
-
2026-06-17days on market $185,000 Active 54 DOM
-
2026-06-16days on market $185,000 Active 53 DOM
-
2026-06-15days on market $185,000 Active 52 DOM
-
2026-06-14days on market $185,000 Active 50 DOM
-
2026-06-13days on market $185,000 Active 49 DOM
-
2026-06-10days on market $185,000 Active 47 DOM
-
2026-06-09days on market $185,000 Active 46 DOM
-
2026-06-08days on market $185,000 Active 45 DOM
-
2026-06-07days on market $185,000 Active 44 DOM
-
2026-06-05days on market $185,000 Active 41 DOM
-
2026-06-03days on market $185,000 Active 40 DOM
-
2026-06-03days on market $185,000 Active 39 DOM
-
2026-06-01days on market $185,000 Active 38 DOM
-
2026-05-31days on market $185,000 Active 37 DOM
ⓘ Source: listings_history table (triggers on properties + properties_extension) + one-shot
backfill from property_details.listing_events for pre-trigger history.
Climate risk First Street
- Flood 1/10 Low FEMA zone X (unshaded) · 0% chance over 30 yrs
- Wildfire 2/10 Low
- Heat 6/10 Major 7 d/yr ≥103°F today · 15 d/yr by 30 yrs out
- Wind 1/10 Low
- Air quality 10/10 Extreme 25 unhealthy d/yr today · 26 by 30 yrs out
Nearby sold comps map
Loading sold comps map…
Walkable amenities ~0.75 mi
Loading nearby amenities…
Taxation est. · year 1
- Rental income
- $29,763
- − Mortgage interest
- −$10,363
- − Property taxes
- −$2,775
- − Insurance
- −$925
- − Repairs & maintenance
- −$2,381
- − Management
- −$2,381
- − Depreciation
- −$5,382
- Taxable income
- $5,556
- Est. tax owed @ 24.0%
- −$1,333
- After-tax cash flow
- $6,837/yr
For passive investors: Depreciation is non-cash, so a rental often shows a tax loss while cash-flowing — sheltering income. Rental losses are passive: they offset passive income freely, and up to $25,000/yr can offset ordinary (W-2) income if you actively participate and your MAGI is under $100k (phasing out to $0 by $150k); unused losses carry forward. On sale, claimed depreciation is recaptured at up to 25%, and gains may owe capital-gains tax (a 1031 exchange can defer both). Figures are a year-1 estimate at your 24.0% rate — not tax advice; consult a CPA.
Condition & rehab AI · 12 photos
This mobile home is in good condition with cosmetic updates needed to enhance its curb appeal and value.
Value-add opportunities
- Both Paint exterior — Enhances curb appeal and value
- Both Replace carpet — Improves comfort and aesthetics
Renovation cost estimate screening
Value-add ROI direction
- Both Paint exterior — Enhances curb appeal and value ↑
- Both Replace carpet — Improves comfort and aesthetics ↑
ⓘ Cost ranges are severity-bucket heuristics (US national rule-of-thumb). Get contractor quotes + a written scope before underwriting a rehab budget.
Schools (NCES district)
- District
- Tracy Joint Unified
- NCES district ID
- 0600047
- Math proficiency
- 22% ▼ -9.00%
- Reading proficiency
- 37% ▼ -7.00%
- Median HH income
- $73,095
- Composite
- 27.94/100
- National rank
- #6862
- State rank
- #305 of 517 in CA
Livability — Tracy
- Score
- 62/100
- State rank
- #496
- US rank
- #16717
Category grades
Schools grade is shown separately in the Schools card above.
Census & demographics
- Census place
- Tracy, CA
- County
- San Joaquin County · 729,570 people
- City population
- 133,642
- Metro
- Stockton, CA
- Population (ZIP)
- 54,488
- Household income
- $102,555
- Rent vs Own
- Severe rent burden
- 1328.0
Population outlook (San Joaquin County) Hauer SSP2
- Today (2025)
- 796,965 people
- By 2030
- 828,849 · +4.0%
- By 2040
- 885,611 · +11.1%
- By 2050
- 929,798 · +16.7%
- By 2075
- 994,578 · +24.8%
- By 2100
- 971,291 · +21.9%
Race, ethnicity, and origin ACS 2023
- Neighborhood character
- Diverse neighborhood (Simpson 0.66)
- Race & ethnicity
- Hispanic / Latino 50% White 27% Two or more races 21% Asian 13% Black 5% Native American 1%
- Hispanic origin (detail)
- Mexican 40% Puerto Rican 1%
- Common ancestry
- Russian 3% Lithuanian 2% Italian 1%
- Foreign-born
- 26% · Canada, China, Vietnam
- Languages at home
- 56% English-only · Spanish 30% Other Indo-European 7% Tagalog/Filipino 2%
Political lean MEDSL · San Joaquin
- 2024 margin
- Toss-up / Even · D 48.0% · R 48.9% · Other 3.0%
- 2008→2024 swing
- -11.6pp toward R · 2008: 10.7pp · 2024: -0.9pp
- All cycles
- 2024: R+0.9 2020: D+13.9 2016: D+12.9 2012: D+8.9 2008: D+10.7
Not yet ingested
- Civics
- —
Market trends
- HPI YoY
- ▼ -436.54%
- Current HPI
- 255.8813
- Rent YoY
- ▲ 3.24%
- Metro
- Stockton, CA
- State GDP YoY
- ▲ 3.21%
- F500 in state
- 116
Industry mix (Fortune 500 HQ in CA)
| Industry | F500 HQs | Revenue |
|---|---|---|
| Technology | 27 | $1,492B |
|
||
| Financial Services | 3 | $174B |
|
||
| Retail | 3 | $44B |
|
||
| Insurance | 3 | $26B |
|
||
| Media / Entertainment | 2 | $115B |
|
||
| Pharmaceuticals / Biotech | 2 | $62B |
|
||
Cash-flow waterfall
monthlySold comps — $/sqft
last 12 mo · ≤1 miLoading sold comps…