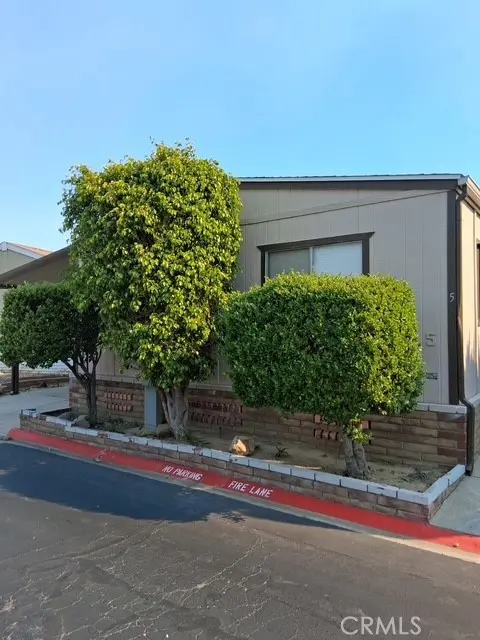
24303 Woolsey Canyon Rd #5 · Los Angeles, CA
Flood risk 1/10 · Minimal
- FEMA flood zone
- D
- Chance of flooding over 30 yrs
- 0.0%
- Est. flood insurance / yr
- $544 – $1,084
Fire risk 7/10 · Major
- Est. fire insurance / yr
- $659 – $1,223
Heat risk 4/10 · Minor
- Hot days now (above 101°F)
- 7 days/yr
- Hot days in 30 yrs
- 20 days/yr
Wind risk 1/10 · Minimal
- Chance of severe wind over 30 yrs
- —
Air-quality risk 4/10 · Minor
- Unhealthy air days now
- 6 days/yr
- Unhealthy air days in 30 yrs
- 6 days/yr
Risk factors via First Street. Map © Google.
Why this score? — see what drove the B+ grade
The composite is a weighted blend of 9 inputs, each scored 0–100. Each bar is that input's sub-score; the figure is the points it added to the 100-point composite (weight × sub-score).
- Cash flow +30.0/30.0
- ARV discount +15.0/15.0
- 1% rule +10.0/10.0
- DSCR +10.0/10.0
- Condition / age +3.8/5.0
- Schools +3.6/10.0
- Livability +3.4/5.0
- Rent growth +1.7/5.0
- Appreciation +0.0/10.0
$130,000
🖨 Deal sheet (PDF) 📄 Offer letter ✓ Due diligence
Listing remarks
This 2 bedroom and 2 bath home has a large open floor plan with incredible views, that would be enough, but this home has so much more. Enjoy this Charming Manufactured Home, peaceful serenity overlooking the San Fernando Valley in West Hills, high above the noise with majestic views. Private, Gated Community, nestled up in the mountains in a very scenic setting, very tranquil and lovely. Breathtaking views from inside and outside the Home.
Key facts
- Open floor plan
- Scenic setting
- 2 parking spots
Tags
Property features AI
Finance
- Other: Directions: Go north on Valley Circle, turn left on Woolsey Canyon and then right to Mountain View Village gate
- Financial info: Monthly land lease (park) applies
- HOA & community: Land lease in park (manager approval required); Park amenities include pool; rent includes pool access; Pets allowed: dogs and cats (number limits apply); Community features: valley and foothills setting
Exterior
- Parking: Carport parking for 2 vehicles; Parking available (park name: Mountain View Village)
- Security: Gated community
- Utilities: Public water (district/public); Public sewer (sewer connected); Electricity connected
- Home design: Manufactured/mobile home (24' x 60', model DEINB); Single-story; Entry at ground level; Access via private road and city streets
- Construction: Composition roof; Raised foundation with pier/post supports; Mobile home remains on site
- Exterior features: Covered front porch; Porch; Community pool; Partial fencing; Paved yard and backyard; Has view
Interior
- Kitchen: Garbage disposal; Electric range and electric oven; Dishwasher
- Bedrooms: All bedrooms located on the ground/entry level
- Flooring: Carpet; Laminate
- Bathrooms: 2 full bathrooms; Bathrooms with stone counters, bathtub and shower
- Heating & cooling: Central heating (central furnace); Central cooling
- Interior features: Open floor plan; All bedrooms on one level; One-level living; Community spa; Gated community; Kitchen open to family room
- Laundry & utility: In-unit laundry; 220V outlet in laundry area
Neighborhood map
What this means for you Summary
Snapshot
- This is a 2-bed/2.0-bath manufactured listed at $130k. Condition is rated good.
Deal economics
- At list price, monthly cash flow is $3k ($34k/yr) — positive.
- The deal already cash-flows at list — no discount required.
- Meets the 1% rule at list price ($5k rent vs $130k).
- Recommended offer: $128k (1.5% below list) — sets the bar for market timing.
- Cap rate 32.6% vs local median 2.1% in Los Angeles — top-decile yield for the area; either an underpriced asset or a hidden risk that comps aren't pricing in. Stress-test before assuming the spread holds.
Location & tenants
- Location reads 68/100 on livability (#273 in CA) — a middle-class / working-renter tenant base. Strengths: amenities A+, commute A+, employment B; Watch: health & safety C-, schools D+, crime F.
- Los Angeles Unified (urban): math 29% / reading 54% proficiency, ranked #223 of 517 in CA (top 43%) — families likely to look elsewhere, expect single-tenant / working-renter base with shorter leases; 67% free/reduced lunch — lower-income household profile, screen leases tightly.
- Market conditions: Rents falling (-3.2%/yr); 121 active listings in the ZIP; 4 comparable units currently listed for rent nearby; rentals lingering (median 45d on market — plan ~5-8 weeks vacancy on turnover, expect pricing pressure); 50% of comp listings sitting > 30 days — soft ceiling on asking rent; solid renter incomes; 19,697 units permitted in Los Angeles County in 2024 (9,426 in 5+ unit buildings).
- At $4,594/mo this rent would consume 61% of the median local household income ($90k/yr) (locally 2821% of renters already pay >50% of income on rent) — very limited rent-growth headroom before tenants either downsize or default.
Forward outlook
- Local home prices are declining (-3.0%/yr); year-one equity from $899 of loan paydown is wiped out by about $4k of value loss. Plan a longer hold.
- Los Angeles County population projected at +9% by 2050 — modest demand growth; plan on rents tracking national, not racing it.
- At projected returns (-3.0% appreciation + 0.0% rent growth), your $36k cash investment doubles in ~2 years — after that, you're playing with house money.
Negotiation context
- It's been on market 23 days — a 2% lower offer ($128k) is reasonable based on typical stale-listing flexibility.
- 3 sale attempts since 2y ago with the ask held roughly flat each time — persistent listings suggest the price (not the market) is what's stuck; bring a comps-based counter.
Risks & watch-outs
- Climate carrying-cost: major wildfire risk — expect insurance premiums to compound above CPI over the hold.
Questions for the listing agent
- Built in 1979 — when were the roof, HVAC, electrical panel, plumbing, and water heater last replaced?
- Is there a deadline driving the sale (1031 exchange, divorce, estate, relocation)? That informs how much negotiation room exists.
- Schools are D-rated, which usually means shorter tenancies and higher turnover. Who's the typical renter profile here, and what's been the actual vacancy rate?
- Crime grade is F in this area — have there been break-ins, vandalism, or insurance claims at this property in the last 3 years? What carrier currently insures it and at what premium?
- What's the average days-on-market for RENTAL listings here right now (not sales)? A rising rental-DOM trend means longer vacancies and softer asking-rent achievability than the comps imply.
- What's the recent tenant-quality profile in this submarket — average credit score on applications, eviction rate, late-payment / NSF rate, and stable-employment percentage? A property-management company in the area should have these aggregated.
- How much new for-sale + rental construction is in the pipeline within 1–3 miles? Heavy new supply typically softens prices + rents 12–24 months out; constrained supply supports both.
Investment metrics
- 1% rule
- 3.53% ✓
- Cap rate
- 32.59%
- Cash-on-cash
- 93.90%
- DSCR
- 5.18
- GRM
- 2.4
CMA / ARV
- ARV (on-the-fly)
- $171,360
- Comps found
- 6
Show comp detail 6 sales within ~0.75 mi
| Address | Dist | Beds/Ba | Sqft | Sold | Price | $/sf | Match |
|---|---|---|---|---|---|---|---|
| 24303 Woolsey Canyon Rd #117 | 0.00mi | 3/2.0 (+1) | 1,440 (0%) | 8mo | $160,000 | $111 | 89 |
| 24425 Woolsey Canyon Rd #200 | 0.28mi | 2/2.0 | 1,440 (0%) | 2mo | $35,000 | $24 | 85 |
| 24425 Woolsey Canyon Rd #168 | 0.28mi | 2/2.0 | 1,440 (0%) | 19mo | $201,000 | $140 | 71 |
| 24303 Woolsey Cyn #26 | 0.00mi | 2/2.0 | 1,248 (-13%) | 19mo | $149,000 | $119 | 62 |
| 24303 Woolsey Canyon Rd #111 | 0.00mi | 2/2.0 | 1,248 (-13%) | 23mo | $159,000 | $127 | 59 |
| 24425 Woolsey Cyn #141 | 0.28mi | 3/2.0 (+1) | 1,296 (-10%) | 14mo | $152,000 | $117 | 54 |
Match score weights: distance 35% · size 25% · config 20% · recency 20%. Top-matched comps best support the ARV.
Projected returns pro-forma
-3.0% appreciation · 0.0% rent growth · sell at horizon
- IRR
- 91.4%
- Equity multiple
- 5.04×
- Total profit
- $146,884
- Equity at exit
- $19,383
- IRR
- 93.7%
- Equity multiple
- 9.50×
- Total profit
- $309,465
- Equity at exit
- $11,240
Cash invested: $36,400 (down + closing). Projections, not guarantees.
Landlord ↔ Tenant lean methodology
- Overall (CITY)
- 0 Strongly Tenant-Friendly
- State California
- 18 Strongly Tenant-Friendly · D+13
- County
- — inherits STATE
- City Los Angeles
- 0 Strongly Tenant-Friendly · D+22
ZIP-level market 91304
- Rents YoY
- -3.2%
- Active inventory
- 121
- Price-to-rent
- 2.4×
Monthly cashflow live
- Estimated rent
- $4,594 medium interval (Pro) →
- Mortgage (P&I)
- −$682
- Tax from tax record
- −$45 /mo · $536/yr
- Insurance
- −$54
- HOA
- −$0
- Vacancy / Maint / Mgmt
- −$965
- Net cashflow
- $2,848
Break-even live
Sensitivity live
| Price | -10% $2,922 | -5% $2,885 | +0% $2,848 | +5% $2,812 | +10% $2,775 |
|---|---|---|---|---|---|
| Rent | -10% $2,485 | -5% $2,667 | +0% $2,848 | +5% $3,030 | +10% $3,211 |
| Rate | -1.0pp $2,914 | -0.5pp $2,881 | base $2,848 | +0.5pp $2,815 | +1.0pp $2,780 |
UW: 25.0% down · 7.5% · 30yr · 1.5% tax · 5.0% vac · 8.0% maint · 8.0% mgmt
Financing live
Cash to close
- Down payment
- $32,500
- Closing costs
- $3,900
- Reserves months
- —
- Total cash needed
- —
Loan-product check · same deal, 3 products live
Conventional
25% down · 7.5% · 30yr
- Down + closing
- —
- Monthly P&I
- —
- Monthly cashflow
- —
- DSCR
- —
- Eligible?
- —
Personal DTI + credit; lowest rate.
DSCR
20% down · 8.5% · 30yr
- Down + closing
- —
- Monthly P&I
- —
- Monthly cashflow
- —
- DSCR
- —
- Eligible?
- —
No personal income docs; deal must DSCR.
Hard money
10% down · 12.0% · 12mo
- Down + closing
- —
- Monthly P&I
- —
- Monthly cashflow
- —
- DSCR
- —
- Eligible?
- —
Short-term bridge; refi at stabilization.
Rent comps 4 comps
| Address | Beds | Baths | Sqft | Rent | $/sqft | DOM | Units | Dist |
|---|---|---|---|---|---|---|---|---|
| 110 Box Canyon Rd Canoga Park, CA | 3.0 | 2.0 | 1500 | $7,000 | $4.67 | 2d | 1 | 0.40mi |
| 8808 Chatlake Dr West Hills, CA | 3.0 | 1.0 | 1250 | $4,250 | $3.40 | 20d | 1 | 0.75mi |
| 9251 Notre Dame Ave Chatsworth, CA | 3.0 | 2.0 | 1310 | $4,200 | $3.21 | 45d | 1 | 1.08mi |
| 9552 Ventura Way Chatsworth, CA | 3.0 | 2.0 | 900 | $4,200 | $4.67 | 45d | 1 | 1.11mi |
Listing history 14 events
-
2026-06-21days on market $130,000 Active 23 DOM
-
2026-06-18days on market $130,000 Active 20 DOM
-
2026-06-17days on market $130,000 Active 19 DOM
-
2026-06-16days on market $130,000 Active 18 DOM
-
2026-06-15days on market $130,000 Active 17 DOM
-
2026-06-13days on market $130,000 Active 15 DOM
-
2026-06-09days on market $130,000 Active 11 DOM
-
2026-06-08days on market $130,000 Active 10 DOM
-
2026-06-07days on market $130,000 Active 9 DOM
-
2026-06-04days on market $130,000 Active 6 DOM
-
2026-06-03days on market $130,000 Active 5 DOM
-
2026-06-02days on market $130,000 Active 4 DOM
-
2026-06-01days on market $130,000 Active 3 DOM
-
2026-05-31days on market $130,000 Active 2 DOM
ⓘ Source: listings_history table (triggers on properties + properties_extension) + one-shot
backfill from property_details.listing_events for pre-trigger history.
Tax reassessment forecast CA · Resets to sale price
- Current annual tax
- $536 · $45/mo
- Projected year-2 tax
- $988 · $82/mo
- Expected delta
- +$452/yr (+$38/mo · 84.3%)
ⓘ Screening estimate from a state-policy table — verify with the county assessor before closing.
Climate risk First Street
- Flood 1/10 Low FEMA zone D · 0% chance over 30 yrs
- Wildfire 7/10 Severe
- Heat 4/10 Moderate 7 d/yr ≥101°F today · 20 d/yr by 30 yrs out
- Wind 1/10 Low
- Air quality 4/10 Moderate 6 unhealthy d/yr today · 6 by 30 yrs out
Nearby sold comps map
Loading sold comps map…
Walkable amenities ~0.75 mi
Loading nearby amenities…
Taxation est. · year 1
- Rental income
- $55,123
- − Mortgage interest
- −$7,282
- − Property taxes
- −$536
- − Insurance
- −$650
- − Repairs & maintenance
- −$4,410
- − Management
- −$4,410
- − Depreciation
- −$3,782
- Taxable income
- $34,054
- Est. tax owed @ 24.0%
- −$8,173
- After-tax cash flow
- $26,008/yr
For passive investors: Depreciation is non-cash, so a rental often shows a tax loss while cash-flowing — sheltering income. Rental losses are passive: they offset passive income freely, and up to $25,000/yr can offset ordinary (W-2) income if you actively participate and your MAGI is under $100k (phasing out to $0 by $150k); unused losses carry forward. On sale, claimed depreciation is recaptured at up to 25%, and gains may owe capital-gains tax (a 1031 exchange can defer both). Figures are a year-1 estimate at your 24.0% rate — not tax advice; consult a CPA.
Condition & rehab AI · 12 photos
This charming manufactured home offers a good condition with a large open floor plan and incredible views. Minor repairs and maintenance are needed, but the home is move-in ready.
Repairs flagged
- Minor Paint — Paint appears faded in some areas
- Minor Flooring — Carpet shows some wear
Value-add opportunities
- Both Paint — Fresh paint can improve curb appeal and interior aesthetics
- Both Flooring — New flooring can enhance the home's value and appeal
Renovation cost estimate screening
| Repair item | Severity | Est. cost |
|---|---|---|
| Paint · Paint appears faded in some areas | Minor | $500–3,000 |
| Flooring · Carpet shows some wear | Minor | $500–3,000 |
| Total estimated repair cost · 2 items | $1,000–6,000 |
Value-add ROI direction
- Both Paint — Fresh paint can improve curb appeal and interior aesthetics ↑
- Both Flooring — New flooring can enhance the home's value and appeal ↑
ⓘ Cost ranges are severity-bucket heuristics (US national rule-of-thumb). Get contractor quotes + a written scope before underwriting a rehab budget.
Schools (NCES district)
- District
- Los Angeles Unified
- NCES district ID
- 0622710
- Math proficiency
- 29% ▼ -4.00%
- Reading proficiency
- 54% ▲ 10.00%
- Median HH income
- $50,403
- Composite
- 35.67/100
- National rank
- #4875
- State rank
- #223 of 517 in CA
Livability — Los Angeles
- Score
- 68/100
- State rank
- #273
- US rank
- #9237
Category grades
Schools grade is shown separately in the Schools card above.
Census & demographics
- County
- Los Angeles County · 9,444,647 people
- City population
- 3,838,149
- Metro
- Los Angeles-Long Beach-Anaheim, CA
- Population (ZIP)
- 52,474
- Household income
- $90,007
- Rent vs Own
- Severe rent burden
- 2821.0
Population outlook (Los Angeles County) Hauer SSP2
- Today (2025)
- 10,940,515 people
- By 2030
- 11,256,481 · +2.9%
- By 2040
- 11,729,929 · +7.2%
- By 2050
- 11,948,407 · +9.2%
- By 2075
- 11,818,114 · +8.0%
- By 2100
- 10,842,928 · -0.9%
Race, ethnicity, and origin ACS 2023
- Neighborhood character
- Diverse neighborhood (Simpson 0.69)
- Race & ethnicity
- Hispanic / Latino 42% White 32% Asian 17% Two or more races 11% Black 4%
- Hispanic origin (detail)
- Mexican 26%
- Common ancestry
- Scotch-Irish 2% Romanian 2% Slovak 1%
- Foreign-born
- 38% · Canada, Vietnam, China
- Languages at home
- 45% English-only · Spanish 34% Other Indo-European 8% Tagalog/Filipino 4%
Political lean MEDSL · Los Angeles
- 2024 margin
- Solid D (+32.9) · D 64.8% · R 31.9% · Other 3.3%
- 2008→2024 swing
- -7.4pp toward R · 2008: 40.4pp · 2024: 32.9pp
- All cycles
- 2024: D+32.9 2020: D+44.2 2016: D+48.0 2012: D+40.0 2008: D+40.4
Not yet ingested
- Civics
- —
Market trends
- HPI YoY
- ▼ -805.65%
- Current HPI
- 351.4216
- Rent YoY
- ▼ -3.21%
- Metro
- Los Angeles-Long Beach-Anaheim, CA
- State GDP YoY
- ▲ 3.21%
- F500 in state
- 116
Industry mix (Fortune 500 HQ in CA)
| Industry | F500 HQs | Revenue |
|---|---|---|
| Technology | 27 | $1,492B |
|
||
| Financial Services | 3 | $174B |
|
||
| Retail | 3 | $44B |
|
||
| Insurance | 3 | $26B |
|
||
| Media / Entertainment | 2 | $115B |
|
||
| Pharmaceuticals / Biotech | 2 | $62B |
|
||
Price history
-33.3% since first listed17 events — show timeline
- 2026-05-29 Listed $130,000 CRMLS
- 2026-04-22 Listing Removed — CRMLS
- 2026-03-21 Price Changed $97,999 CRMLS
- 2026-02-20 Price Changed $98,000 CRMLS
- 2025-12-05 Price Changed $99,000 CRMLS
- 2025-11-20 Price Changed $115,000 CRMLS
- 2025-10-24 Price Changed $129,900 CRMLS
- 2025-09-04 Listed $139,900 CRMLS
- 2025-08-20 Listing Removed — CRMLS
- 2025-06-19 Price Changed $120,000 CRMLS
- 2025-06-02 Price Changed $130,000 CRMLS
- 2025-05-09 Price Changed $140,000 CRMLS
- 2025-02-22 Price Changed $148,000 CRMLS
- 2024-10-02 Price Changed $150,000 CRMLS
- 2024-09-18 Price Changed $160,000 CRMLS
- 2024-09-10 Price Changed $190,000 CRMLS
- 2024-08-25 Listed $195,000 CRMLS
Property tax history
+4.8%/yrLatest (2025): $536 · +4.8% YoY. Source: county tax records.
Cash-flow waterfall
monthlySold comps — $/sqft
last 12 mo · ≤1 miLoading sold comps…