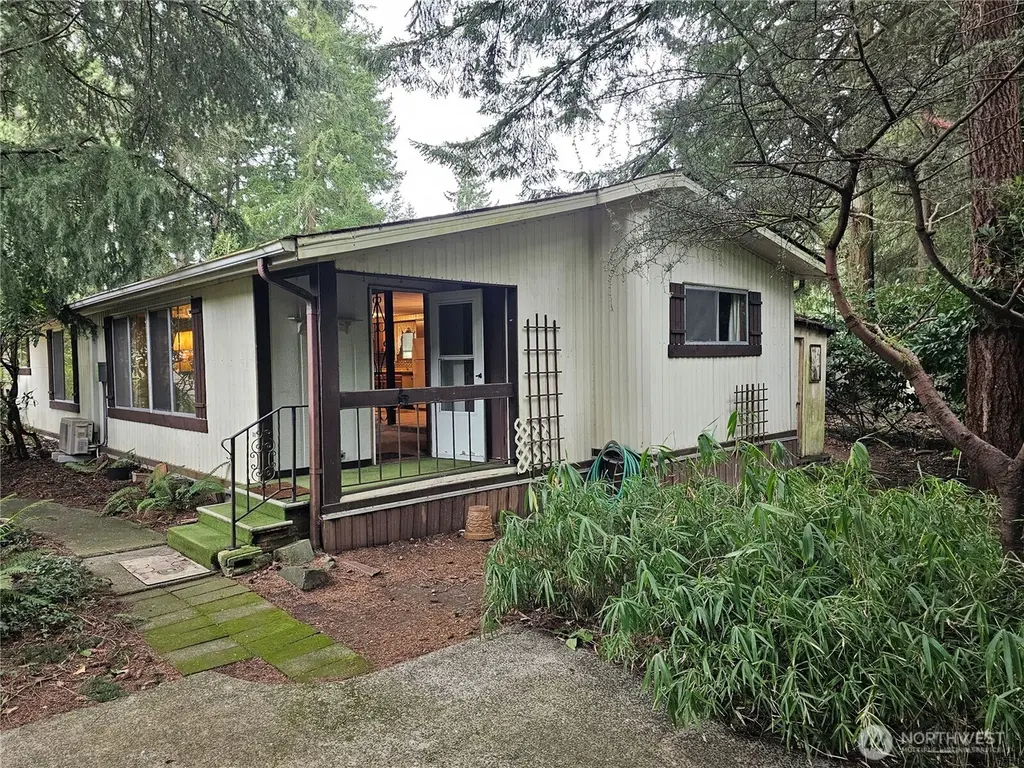
2419 Jahn Ave NW #29 · Wollochet, WA
Flood risk 1/10 · Minimal
- FEMA flood zone
- X (unshaded)
- Chance of flooding over 30 yrs
- 0.0%
- Est. flood insurance / yr
- $507 – $1,088
Fire risk 3/10 · Minor
- Est. fire insurance / yr
- $604 – $1,122
Heat risk 3/10 · Minor
- Hot days now (above 87°F)
- 7 days/yr
- Hot days in 30 yrs
- 14 days/yr
Wind risk 1/10 · Minimal
- Chance of severe wind over 30 yrs
- —
Air-quality risk 10/10 · Severe
- Unhealthy air days now
- 18 days/yr
- Unhealthy air days in 30 yrs
- 28 days/yr
Risk factors via First Street. Map © Google.
Why this score? — see what drove the A- grade
The composite is a weighted blend of 9 inputs, each scored 0–100. Each bar is that input's sub-score; the figure is the points it added to the 100-point composite (weight × sub-score).
- Cash flow +30.0/30.0
- ARV discount +15.0/15.0
- 1% rule +10.0/10.0
- DSCR +10.0/10.0
- Schools +6.0/10.0
- Rent growth +3.7/5.0
- Livability +3.2/5.0
- Condition / age +2.5/5.0
- Appreciation +0.0/10.0
$75,000
🖨 Deal sheet 📄 Offer letter ✓ Due diligence
Listing remarks
West Anchor Mobile Home Park, a desirable 55+ community offering peaceful living with stunning views of the iconic Tacoma Narrows Bridge and beautiful Puget Sound. 2-bedroom, 2-bath home features an attached carport, storage shed, private patio, and covered front porch—perfect for relaxing and taking in the scenery. Inside, you’ll find a spacious living room, formal dining area, and a bright kitchen complete with breakfast bar, breakfast nook, electric range, dishwasher, and refrigerator. The primary suite offers a walk-in closet and private ¾ bath, while the second bedroom provides convenient access to the full bath—ideal for guests or office space. Additional high
Key facts
- Covered front porch
- Breakfast nook
- Walk-in closet
Tags
Neighborhood map
What this means for you Summary
Snapshot
- This is a 2-bed/2.0-bath manufactured listed at $75k.
Deal economics
- At list price, monthly cash flow is $1k ($16k/yr) — positive.
- The deal already cash-flows at list — no discount required.
- Meets the 1% rule at list price ($2k rent vs $75k).
- Recommended offer: $68k (9.0% below list) — sets the bar for market timing.
- Cap rate 27.4% vs local median 1.3% in Wollochet — top-decile yield for the area; either an underpriced asset or a hidden risk that comps aren't pricing in. Stress-test before assuming the spread holds.
Location & tenants
- Location reads 65/100 on livability (#356 in WA) — a middle-class / working-renter tenant base. Strengths: crime A+, employment A+, housing A+; Watch: health & safety C-, amenities F, commute F.
- Peninsula School District (suburban): math 61% / reading 72% proficiency, ranked #21 of 291 in WA (top 7%) — acceptable for families but not a draw, mixed tenant base, ~2y average lease; only 19% free/reduced lunch — higher-income household profile.
- Market conditions: Rents rising fast (+4.7%/yr); 183 active listings in the ZIP; 2 comparable units currently listed for rent nearby; high-income renter base; 3,209 units permitted in Pierce County in 2024 (1,269 in 5+ unit buildings).
Forward outlook
- Local home prices are declining (-3.0%/yr); year-one equity from $519 of loan paydown is wiped out by about $2k of value loss. Plan a longer hold.
- Pierce County population projected at +26% by 2050 — long-run rental-demand tailwind backs the buy-and-hold thesis.
- At projected returns (-3.0% appreciation + 4.7% rent growth), your $21k cash investment doubles in ~2 years — after that, you're playing with house money.
Negotiation context
- It's been on market 106 days — a 9% lower offer ($68k) is reasonable based on typical stale-listing flexibility.
Questions for the listing agent
- It's been on market 106 days. Have you received any prior offers? Is the seller open to a 9% concession, seller financing, or rate buy-down credit?
- Built in 1973 — when were the roof, HVAC, electrical panel, plumbing, and water heater last replaced?
- Why hasn't it sold? Are there any deal-killer items the seller is aware of (foundation, flood, title, zoning, code violations)?
- Is there a deadline driving the sale (1031 exchange, divorce, estate, relocation)? That informs how much negotiation room exists.
- Schools are B-rated — typically a magnet for longer-tenancy family renters. What's the average tenant stay here, and is there a school-zone premium baked into asking?
- What's the average days-on-market for RENTAL listings here right now (not sales)? A rising rental-DOM trend means longer vacancies and softer asking-rent achievability than the comps imply.
- What's the recent tenant-quality profile in this submarket — average credit score on applications, eviction rate, late-payment / NSF rate, and stable-employment percentage? A property-management company in the area should have these aggregated.
- How much new for-sale + rental construction is in the pipeline within 1–3 miles? Heavy new supply typically softens prices + rents 12–24 months out; constrained supply supports both.
Investment metrics
- 1% rule
- 3.10% ✓
- Cap rate
- 27.36%
- Cash-on-cash
- 75.23%
- DSCR
- 4.35
- GRM
- 2.7
CMA / ARV
- ARV (median comp)
- $142,774
- List price
- $75,000
- Delta
- -47.47%
- Verdict
- UNDERPRICED
- Comps
- 1 within 2.0 mi
Projected returns pro-forma
-3.0% appreciation · 4.65% rent growth · sell at horizon
- IRR
- 77.0%
- Equity multiple
- 4.60×
- Total profit
- $75,656
- Equity at exit
- $11,183
- IRR
- 81.0%
- Equity multiple
- 10.08×
- Total profit
- $190,632
- Equity at exit
- $6,485
Cash invested: $21,000 (down + closing). Projections, not guarantees.
Landlord ↔ Tenant lean methodology
- Overall (STATE)
- 28 Tenant-Leaning
- State Washington
- 28 Tenant-Leaning · D+8
- County
- — inherits STATE
- City
- — inherits STATE
ZIP-level market 98335
- Rents YoY
- 4.7%
- Active inventory
- 183
- Price-to-rent
- 2.7×
Monthly cashflow live
- Estimated rent
- $2,323 medium interval (Pro) →
- Mortgage (P&I)
- −$393
- Tax est. 1.5%
- −$94 /mo · $1,125/yr
- Insurance
- −$31
- HOA
- −$0
- Vacancy / Maint / Mgmt
- −$488
- Net cashflow
- $1,317
Break-even live
UW: 25.0% down · 7.5% · 30yr · 1.5% tax · 5.0% vac · 8.0% maint · 8.0% mgmt
Financing live
Cash to close
- Down payment
- $18,750
- Closing costs
- $2,250
- Reserves months
- —
- Total cash needed
- —
Loan-product check · same deal, 3 products live
Conventional
25% down · 7.5% · 30yr
- Down + closing
- —
- Monthly P&I
- —
- Monthly cashflow
- —
- DSCR
- —
- Eligible?
- —
Personal DTI + credit; lowest rate.
DSCR
20% down · 8.5% · 30yr
- Down + closing
- —
- Monthly P&I
- —
- Monthly cashflow
- —
- DSCR
- —
- Eligible?
- —
No personal income docs; deal must DSCR.
Hard money
10% down · 12.0% · 12mo
- Down + closing
- —
- Monthly P&I
- —
- Monthly cashflow
- —
- DSCR
- —
- Eligible?
- —
Short-term bridge; refi at stabilization.
Rent comps 2 comps
| Address | Beds | Baths | Sqft | Rent | $/sqft | DOM | Units | Dist |
|---|---|---|---|---|---|---|---|---|
| 2413 Cliffside Ln NW Gig Harbor, WA | 1.0–2.0 | 1.0 | 809 | $2,378 | $2.94 | 1d | 11 | 0.33mi |
| 4425 Harbor Country Dr Gig Harbor, WA | 1.0 | 1.0 | 632 | $1,635 | $2.59 | 2d | 1 | 1.34mi |
Listing history 16 events
-
2026-06-18days on market $75,000 Active 106 DOM
-
2026-06-17days on market $75,000 Active 105 DOM
-
2026-06-16days on market $75,000 Active 104 DOM
-
2026-06-15days on market $75,000 Active 103 DOM
-
2026-06-13days on market $75,000 Active 101 DOM
-
2026-06-09days on market $75,000 Active 97 DOM
-
2026-06-08days on market $75,000 Active 96 DOM
-
2026-06-07days on market $75,000 Active 95 DOM
-
2026-06-04days on market $75,000 Active 92 DOM
-
2026-06-03days on market $75,000 Active 91 DOM
-
2026-06-02days on market $75,000 Active 90 DOM
-
2026-06-01days on market $75,000 Active 89 DOM
-
2026-05-31pricedays on market $75,000 Active 88 DOM
-
2026-05-15price $79,000
-
2026-03-25price $85,000
-
2026-03-04$89,950 Active
ⓘ Source: listings_history table (triggers on properties + properties_extension) + one-shot
backfill from property_details.listing_events for pre-trigger history.
Climate risk First Street
- Flood 1/10 Low FEMA zone X (unshaded) · 0% chance over 30 yrs
- Wildfire 3/10 Moderate
- Heat 3/10 Moderate 7 d/yr ≥87°F today · 14 d/yr by 30 yrs out
- Wind 1/10 Low
- Air quality 10/10 Extreme 18 unhealthy d/yr today · 28 by 30 yrs out
Nearby sold comps map
Loading sold comps map…
Walkable amenities ~0.75 mi
Loading nearby amenities…
Taxation est. · year 1
- Rental income
- $27,872
- − Mortgage interest
- −$4,201
- − Property taxes
- −$1,125
- − Insurance
- −$375
- − Repairs & maintenance
- −$2,230
- − Management
- −$2,230
- − Depreciation
- −$2,182
- Taxable income
- $15,529
- Est. tax owed @ 24.0%
- −$3,727
- After-tax cash flow
- $12,072/yr
For passive investors: Depreciation is non-cash, so a rental often shows a tax loss while cash-flowing — sheltering income. Rental losses are passive: they offset passive income freely, and up to $25,000/yr can offset ordinary (W-2) income if you actively participate and your MAGI is under $100k (phasing out to $0 by $150k); unused losses carry forward. On sale, claimed depreciation is recaptured at up to 25%, and gains may owe capital-gains tax (a 1031 exchange can defer both). Figures are a year-1 estimate at your 24.0% rate — not tax advice; consult a CPA.
Schools (NCES district)
- District
- Peninsula School District
- NCES district ID
- 5306690
- Math proficiency
- 61% ▲ 1.00%
- Reading proficiency
- 72% ▼ -1.00%
- Median HH income
- $76,796
- Composite
- 60.35/100
- National rank
- #1718
- State rank
- #21 of 291 in WA
Livability — Wollochet
- Score
- 65/100
- State rank
- #356
- US rank
- #13570
Category grades
Schools grade is shown separately in the Schools card above.
Census & demographics
- Census place
- Wollochet, WA
- County
- Pierce County · 788,257 people
- Metro
- Seattle-Tacoma-Bellevue, WA
- Population (ZIP)
- 27,773
- Household income
- $128,592
- Rent vs Own
- Severe rent burden
- 609.0
Population outlook (Pierce County) Hauer SSP2
- Today (2025)
- 956,648 people
- By 2030
- 1,010,862 · +5.7%
- By 2040
- 1,113,170 · +16.4%
- By 2050
- 1,206,524 · +26.1%
- By 2075
- 1,436,425 · +50.2%
- By 2100
- 1,563,654 · +63.5%
Race, ethnicity, and origin ACS 2023
- Neighborhood character
- Predominantly White (80%)
- Race & ethnicity
- White 80% Two or more races 11% Hispanic / Latino 7% Asian 3%
- Hispanic origin (detail)
- Mexican 4%
- Common ancestry
- Italian 9% Portuguese 8% Slovak 4%
- Foreign-born
- 5% · Canada, China, Vietnam
- Languages at home
- 95% English-only · Spanish 2% Other Indo-European 1%
Political lean MEDSL · Pierce
- 2024 margin
- D (+10.8) · D 53.9% · R 43.1% · Other 3.0%
- 2008→2024 swing
- -1.4pp toward R · 2008: 12.2pp · 2024: 10.8pp
- All cycles
- 2024: D+10.8 2020: D+11.2 2016: D+7.5 2012: D+11.0 2008: D+12.2
Not yet ingested
- Civics
- —
Market trends
- HPI YoY
- ▼ -604.41%
- Current HPI
- 346.8354
- Rent YoY
- ▲ 4.65%
- Metro
- Seattle-Tacoma-Bellevue, WA
- State GDP YoY
- ▲ 4.65%
- F500 in state
- 22
Industry mix (Fortune 500 HQ in WA)
| Industry | F500 HQs | Revenue |
|---|---|---|
| Retail | 2 | $269B |
|
||
| Technology / Retail | 1 | $638B |
|
||
| Technology | 1 | $245B |
|
||
| Telecommunications | 1 | $38B |
|
||
| Food / Beverage | 1 | $36B |
|
||
| Automotive / Trucks | 1 | $34B |
|
||
Price history
-12.2% since first listed3 events — show timeline
- 2026-05-15 Price Changed $79,000 NWMLS as Distributed by MLS Grid
- 2026-03-25 Price Changed $85,000 NWMLS as Distributed by MLS Grid
- 2026-03-04 Listed $89,950 NWMLS as Distributed by MLS Grid
Property tax history
-34.3%/yrLatest (2016): $5 · +0.0% YoY. Source: county tax records.
Cash-flow waterfall
monthlySold comps — $/sqft
last 12 mo · ≤1 miLoading sold comps…