643 5th Ave Unit 5D · New York, NY
Flood risk 1/10 · Minimal
- FEMA flood zone
- X (unshaded)
- Chance of flooding over 30 yrs
- 0.0%
- Est. flood insurance / yr
- $507 – $1,088
Fire risk 1/10 · Minimal
- Est. fire insurance / yr
- $691 – $1,283
Heat risk 7/10 · Major
- Hot days now (above 99°F)
- 7 days/yr
- Hot days in 30 yrs
- 15 days/yr
Wind risk 6/10 · Moderate
- Chance of severe wind over 30 yrs
- 61.0%
Air-quality risk 4/10 · Minor
- Unhealthy air days now
- 5 days/yr
- Unhealthy air days in 30 yrs
- 7 days/yr
Risk factors via First Street. Map © Google.
Why this score? — see what drove the D- grade
The composite is a weighted blend of 9 inputs, each scored 0–100. Each bar is that input's sub-score; the figure is the points it added to the 100-point composite (weight × sub-score).
- Appreciation +10.0/10.0
- ARV discount +7.5/15.0
- Schools +5.0/10.0
- Cash flow +4.5/30.0
- Rent growth +3.9/5.0
- Livability +3.8/5.0
- Condition / age +2.5/5.0
- 1% rule +0.5/10.0
- DSCR +0.0/10.0
$876,000
🖨 Deal sheet 📄 Offer letter ✓ Due diligence
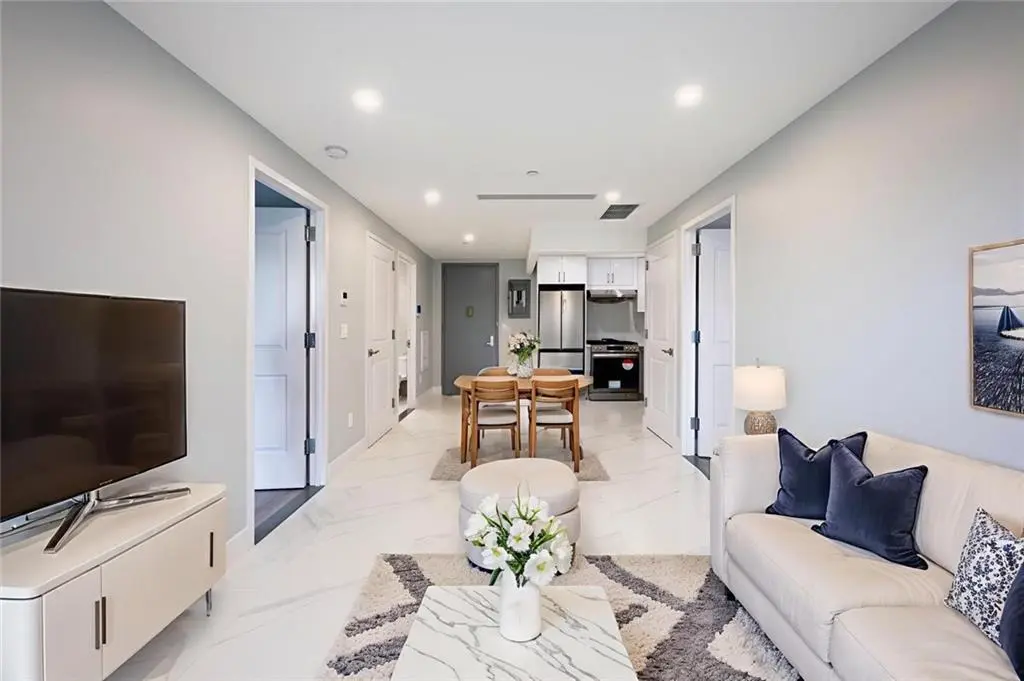
Listing remarks
Newly Constructed 2-Bedroom Condo for Sale – Prime Location! Welcome to your brand-new home on the border of Greenwood Heights and South Slope! This brand new two-bedroom condo offers modern living in one of Brooklyn’s most vibrant and convenient neighborhoods. Enter inside to find beautiful tile flooring throughout, with cozy vinyl floors in the bedrooms for added comfort. The open kitchen comes fully equipped with a brand-new refrigerator and stainless-steel appliances. Enjoy a private balcony — ideal for entertaining or relaxation, along with a gym room in the building and a rooftop space with breathtaking views of the city. The unit also includes a dedicated space for
Key facts
- Private balcony
- Vinyl floors
- Rooftop space
Tags
Property features AI
Finance
- Other: Building has 21 total units; Unit is lot/unit number 7 within the building
- Financial info: No financing provided (buyer to arrange); Down payment generally 20% required
- HOA & community: Monthly maintenance/COMMON fee; Managed by Wan Long Realty LLC (manager phone available)
Exterior
- Utilities: Water; Other utilities
- Home design: Residential unit in a multi-unit building
- Exterior features: Bike room; Non-resident superintendent; Recreational room; Unit located on the 5th floor
Interior
- Kitchen: Kitchen/living combo on the first floor; Refrigerator; Stove
- Bedrooms: Master bedroom on the first floor; Second bedroom on the first floor
- Bathrooms: Two three-quarter bathrooms on the first floor
- Heating & cooling: Central split air conditioning
- Interior features: Central split air conditioning; Refrigerator; Stove
Neighborhood map
What this means for you Summary
Snapshot
- This is a 2-bed/2.0-bath condo listed at $876k.
Deal economics
- At list price, monthly cash flow is $-2k ($-27k/yr) — negative.
- To cash-flow at today's rent, offer at most $550k (37.2% below list).
- To meet the 1% rule (rent ≥ 1% of price), the offer needs to be $481k (45.1% below list).
- Recommended offer: $481k (45.1% below list) — sets the bar for 1% rule.
- Cap rate 3.2% vs local median 2.6% in New York — meaningfully above typical; check what's discounted (condition, days-on-market, listing class) to confirm the premium yield is real.
Location & tenants
- Location reads 75/100 on livability (#268 in NY, #4,188 nationally) — a middle-class / working-renter tenant base. Strengths: amenities A+, commute A+, health & safety A; Watch: crime F, cost of living F.
- Market conditions: Rents rising fast (+5.7%/yr); 248 active listings in the ZIP; 2 comparable units currently listed for rent nearby; high-income renter base; 10,063 units permitted in Kings County in 2024 (9,789 in 5+ unit buildings).
- This rent runs 31% of the median local income ($186k/yr) — at the standard rent-burdened threshold; future hikes will face affordability resistance.
Forward outlook
- In year one you build about $94k of equity ($6k loan paydown + $88k appreciation (10.0% local appreciation)).
- Kings County population projected at +13% by 2050 — modest demand growth; plan on rents tracking national, not racing it.
- By year 2, paydown + projected appreciation supports a ~$151k cash-out refi (75% LTV) — recoverable capital for the next deal without selling this one.
Negotiation context
- It's been on market 281 days — a 12% lower offer ($771k) is reasonable based on typical stale-listing flexibility.
- 2 sale attempts with the ask held roughly flat each time — persistent listings suggest the price (not the market) is what's stuck; bring a comps-based counter.
Risks & watch-outs
- Climate carrying-cost: major wind risk, 61% chance of damaging wind over 30y; extreme-heat days projected 7→15/yr by 2055 (HVAC capex compounding) — expect insurance premiums to compound above CPI over the hold.
Questions for the listing agent
- What do current leases actually rent for vs. the listed asking? Can we see a recent rent roll and the last 12 months of T-12 income?
- It's been on market 281 days. Have you received any prior offers? Is the seller open to a 45% concession, seller financing, or rate buy-down credit?
- Any open or pending special assessments — roof, HVAC, plumbing, elevator, façade? What's the per-unit balance and payoff schedule, and is the seller paying it off at close or rolling it to the buyer?
- Why hasn't it sold? Are there any deal-killer items the seller is aware of (foundation, flood, title, zoning, code violations)?
- Is there a deadline driving the sale (1031 exchange, divorce, estate, relocation)? That informs how much negotiation room exists.
- Schools are B-rated — typically a magnet for longer-tenancy family renters. What's the average tenant stay here, and is there a school-zone premium baked into asking?
- Crime grade is F in this area — have there been break-ins, vandalism, or insurance claims at this property in the last 3 years? What carrier currently insures it and at what premium?
- The area grade is low — what's the realistic commute time and amenity access for the typical tenant pool here? Any planned neighborhood developments (good or bad) we should know about?
- What's the average days-on-market for RENTAL listings here right now (not sales)? A rising rental-DOM trend means longer vacancies and softer asking-rent achievability than the comps imply.
- What's the recent tenant-quality profile in this submarket — average credit score on applications, eviction rate, late-payment / NSF rate, and stable-employment percentage? A property-management company in the area should have these aggregated.
- How much new apartment / multifamily construction is in the pipeline within 1–3 miles? Heavy new supply (>2% of stock underway) typically softens rents 12–24 months out; light construction supports rent growth.
Investment metrics
- 1% rule
- 0.55% ✗
- Cap rate
- 3.21%
- Cash-on-cash
- -11.03%
- DSCR
- 0.51
- GRM
- 15.2
CMA / ARV
No comps found within radius.
Projected returns pro-forma
10.0% appreciation · 5.67% rent growth · sell at horizon
- IRR
- 17.2%
- Equity multiple
- 2.41×
- Total profit
- $346,883
- Equity at exit
- $789,170
- IRR
- 16.7%
- Equity multiple
- 5.75×
- Total profit
- $1,164,534
- Equity at exit
- $1,701,875
Cash invested: $245,280 (down + closing). Projections, not guarantees.
Landlord ↔ Tenant lean methodology
- Overall (CITY)
- 0 Strongly Tenant-Friendly
- State New York
- 15 Strongly Tenant-Friendly · D+10
- County
- — inherits STATE
- City New York
- 0 Strongly Tenant-Friendly · D+34
ZIP-level market 11215
- Home prices YoY
- 2.7%
- Rents YoY
- 5.7%
- Active inventory
- 248
- Price-to-rent
- 15.2×
Monthly cashflow live
- Estimated rent
- $4,810 medium interval (Pro) →
- Mortgage (P&I)
- −$4,594
- Tax est. 1.5%
- −$1,095 /mo · $13,140/yr
- Insurance
- −$365
- HOA
- −$0
- Vacancy / Maint / Mgmt
- −$1,010
- Net cashflow
- $-2,254
Break-even live
UW: 25.0% down · 7.5% · 30yr · 1.5% tax · 5.0% vac · 8.0% maint · 8.0% mgmt
Financing live
Cash to close
- Down payment
- $219,000
- Closing costs
- $26,280
- Reserves months
- —
- Total cash needed
- —
Loan-product check · same deal, 3 products live
Conventional
25% down · 7.5% · 30yr
- Down + closing
- —
- Monthly P&I
- —
- Monthly cashflow
- —
- DSCR
- —
- Eligible?
- —
Personal DTI + credit; lowest rate.
DSCR
20% down · 8.5% · 30yr
- Down + closing
- —
- Monthly P&I
- —
- Monthly cashflow
- —
- DSCR
- —
- Eligible?
- —
No personal income docs; deal must DSCR.
Hard money
10% down · 12.0% · 12mo
- Down + closing
- —
- Monthly P&I
- —
- Monthly cashflow
- —
- DSCR
- —
- Eligible?
- —
Short-term bridge; refi at stabilization.
Rent comps 2 comps
| Address | Beds | Baths | Sqft | Rent | $/sqft | DOM | Units | Dist |
|---|---|---|---|---|---|---|---|---|
| 655 Union St #1846 Brooklyn, NY | 1.0–2.0 | 1.0–2.0 | 727 | $7,810 | $10.74 | 2d | 2 | 1.11mi |
| 22 Tehama St Unit 2 Fl Brooklyn, NY | 2.0 | 1.0 | 700 | $2,980 | $4.26 | 24d | 1 | 1.36mi |
HOA detail condo
- Monthly dues
- $0 · $0/yr
- Likely covers
- gym
- Assessments
- None detected in remarks — confirm with the listing agent.
Listing history 9 events
-
2026-04-29status Pending
-
2026-04-09$876,000 Active
-
2026-04-09status Pending
-
2026-01-06price $876,000
-
2025-11-30price $933,000
-
2025-11-08price $949,000
-
2025-10-18price $970,000
-
2025-08-12price $999,000
-
2025-07-01$1,037,000 Active
ⓘ Source: listings_history table (triggers on properties + properties_extension) + one-shot
backfill from property_details.listing_events for pre-trigger history.
Climate risk First Street
- Flood 1/10 Low FEMA zone X (unshaded) · 0% chance over 30 yrs
- Wildfire 1/10 Low
- Heat 7/10 Severe 7 d/yr ≥99°F today · 15 d/yr by 30 yrs out
- Wind 6/10 Major 61% chance of damaging wind over 30 yrs
- Air quality 4/10 Moderate 5 unhealthy d/yr today · 7 by 30 yrs out
Nearby sold comps map
Loading sold comps map…
Walkable amenities ~0.75 mi
Loading nearby amenities…
Taxation est. · year 1
- Rental income
- $57,721
- − Mortgage interest
- −$49,070
- − Property taxes
- −$13,140
- − Insurance
- −$4,380
- − Repairs & maintenance
- −$4,618
- − Management
- −$4,618
- − Depreciation
- −$25,484
- Taxable loss
- −$43,587
- Est. tax savings @ 24.0%
- +$10,461
- After-tax cash flow
- $-16,585/yr
For passive investors: Depreciation is non-cash, so a rental often shows a tax loss while cash-flowing — sheltering income. Rental losses are passive: they offset passive income freely, and up to $25,000/yr can offset ordinary (W-2) income if you actively participate and your MAGI is under $100k (phasing out to $0 by $150k); unused losses carry forward. On sale, claimed depreciation is recaptured at up to 25%, and gains may owe capital-gains tax (a 1031 exchange can defer both). Figures are a year-1 estimate at your 24.0% rate — not tax advice; consult a CPA.
Schools (NCES district)
No district data.
Livability — New York
- Score
- 75/100
- State rank
- #268
- US rank
- #4188
Category grades
Schools grade is shown separately in the Schools card above.
Census & demographics
- Census place
- New York, NY
- County
- Kings County · 2,614,986 people
- City population
- 7,731,280
- Metro
- New York-Newark-Jersey City, NY-NJ-PA
- Population (ZIP)
- 70,441
- Household income
- $185,865
- Rent vs Own
- Severe rent burden
- 2372.0
Population outlook (Kings County) Hauer SSP2
- Today (2025)
- 2,847,441 people
- By 2030
- 2,937,006 · +3.1%
- By 2040
- 3,095,491 · +8.7%
- By 2050
- 3,228,968 · +13.4%
- By 2075
- 3,321,723 · +16.7%
- By 2100
- 3,111,387 · +9.3%
Race, ethnicity, and origin ACS 2023
- Neighborhood character
- Predominantly White (67%)
- Race & ethnicity
- White 67% Hispanic / Latino 15% Two or more races 11% Asian 9% Black 3%
- Hispanic origin (detail)
- Mexican 3% Puerto Rican 3%
- Common ancestry
- Romanian 5% Scotch-Irish 5% Italian 3%
- Foreign-born
- 18% · Canada, China, Jamaica
- Languages at home
- 76% English-only · Spanish 9% Other Indo-European 4% Chinese 2%
Political lean MEDSL · Kings
- 2024 margin
- Solid D (+44.0) · D 72.0% · R 28.0%
- 2008→2024 swing
- -15.5pp toward R · 2008: 59.4pp · 2024: 44.0pp
- All cycles
- 2024: D+44.0 2020: D+54.8 2016: D+61.8 2012: D+63.9 2008: D+59.4
Not yet ingested
- Civics
- —
Market trends
- HPI YoY
- ▲ 11.03%
- Current HPI
- 417.4151
- Rent YoY
- ▲ 5.67%
- Metro
- New York-Newark-Jersey City, NY-NJ-PA
- State GDP YoY
- ▲ 2.60%
- F500 in state
- 92
Industry mix (Fortune 500 HQ in NY)
| Industry | F500 HQs | Revenue |
|---|---|---|
| Financial Services | 10 | $950B |
|
||
| Consumer Goods | 9 | $162B |
|
||
| Insurance | 4 | $225B |
|
||
| Telecommunications | 2 | $144B |
|
||
| Pharmaceuticals | 2 | $112B |
|
||
| Media / Entertainment | 2 | $69B |
|
||
Price history
-15.5% since first listed9 events — show timeline
- 2026-04-29 Pending — SIBORMLS
- 2026-04-09 Listed $876,000 SIBORMLS
- 2026-04-09 Pending — BNYMLS
- 2026-01-06 Price Changed $876,000 BNYMLS
- 2025-11-30 Price Changed $933,000 BNYMLS
- 2025-11-08 Price Changed $949,000 BNYMLS
- 2025-10-18 Price Changed $970,000 BNYMLS
- 2025-08-12 Price Changed $999,000 BNYMLS
- 2025-07-01 Listed $1,037,000 BNYMLS
Cash-flow waterfall
monthlySold comps — $/sqft
last 12 mo · ≤1 miLoading sold comps…