 🌊 Lakefront
7501 Creighton Pl · New Orleans, LA
Flood risk 8/10 · Major
- FEMA flood zone
- X (shaded)
- Chance of flooding over 30 yrs
- 0.6%
- Est. flood insurance / yr
- $507 – $1,088
Fire risk 1/10 · Minimal
- Est. fire insurance / yr
- $1,269 – $2,357
Heat risk 10/10 · Severe
- Hot days now (above 107°F)
- 7 days/yr
- Hot days in 30 yrs
- 21 days/yr
Wind risk 10/10 · Severe
- Chance of severe wind over 30 yrs
- 99.0%
Air-quality risk 3/10 · Minor
- Unhealthy air days now
- 3 days/yr
- Unhealthy air days in 30 yrs
- 3 days/yr
Risk factors via First Street. Map © Google.
Why this score? — see what drove the B+ grade
The composite is a weighted blend of 9 inputs, each scored 0–100. Each bar is that input's sub-score; the figure is the points it added to the 100-point composite (weight × sub-score).
- Cash flow +30.0/30.0
- ARV discount +15.0/15.0
- 1% rule +10.0/10.0
- DSCR +10.0/10.0
- Livability +4.0/5.0
- Condition / age +2.5/5.0
- Rent growth +2.4/5.0
- Schools +1.6/10.0
- Appreciation +0.0/10.0
$109,000
🖨 Deal sheet 📄 Offer letter ✓ Due diligence
Listing remarks MLS
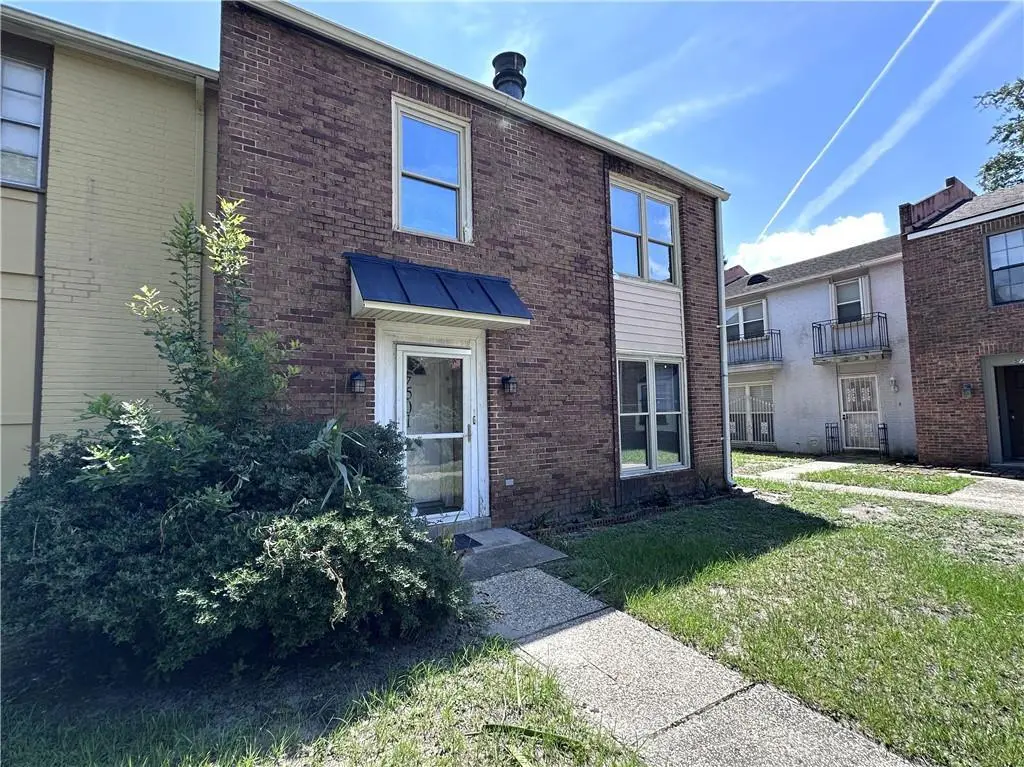
Welcome to Regency Park in Pines Village, where affordability meets space and Lakefront convenience! This spacious corner-unit townhome offers 4 bedrooms and 2.5 baths, providing an exceptional opportunity for buyers seeking a low-cost entry point into homeownership without sacrificing room to spread out. Inside, you'll find tile and laminate wood flooring throughout with no carpet, a large living room anchored by a charming cobblestone wood-burning fireplace, and an oversized kitchen and dining area featuring abundant counter space, ample cabinetry, a range oven, and a wide pantry closet with shelving. A convenient half bath and laundry closet with washer/dryer hookups are located downstairs. Upstairs, the generous primary suite includes a private ensuite bath, while three additional bedrooms and another full bath provide flexibility for family, guests, or a home office. Ample closet space can be found throughout the home. Step outside to enjoy the large private patio enclosed by a wooden privacy fence and complete with a storage shed. Residents also enjoy beautifully landscaped courtyard areas with benches and mature shade trees, plenty of parking on both sides of the building, and a refreshing community pool perfect for summer. Monthly dues of just $172 cover lawn care, trash pickup, and maintenance of the common areas, with owners responsible only for water and electricity. Located in the preferred X flood zone, flood insurance is typically not required by lenders. Opportunities like this don't come along often! Schedule your private showing today and discover just how much home your money can buy!
Key facts
- Wooden privacy fence
- Corner-unit townhome
- Oversized kitchen
Tags
Property features AI
Finance
- HOA & community: Homeowners association (Regency Park) with monthly fee; Monthly association fee of $172; Community amenities include common grounds, gated entry, community pool, and access to public transportation
Exterior
- Parking: Off-street parking; Parking lot; Three or more parking spaces
- Security: Gated community; Smoke detectors
- Utilities: Public water; Public sewer
- Home design: 2-story building; Average condition; Shingle roof
- Construction: Brick and concrete construction; Slab foundation
- Exterior features: Courtyard; Fenced yard; Concrete patio/porch; Shed(s); Corner lot; City lot; Rectangular lot
Interior
- Kitchen: Oven; Range
- Bedrooms: Total of 7 rooms (bedroom count not specified)
- Bathrooms: 2 full bathrooms; 1 half bathroom
- Heating & cooling: Central heating; Central air conditioning
- Interior features: Pantry; Carbon monoxide detector; Wood-burning fireplace
- Laundry & utility: Washer hookup; Dryer hookup
Neighborhood map
What this means for you Summary
Snapshot
- This is a 4-bed/2.5-bath single-family listed at $109k.
Deal economics
- At list price, monthly cash flow is $555 ($7k/yr) — positive.
- The deal already cash-flows at list — no discount required.
- Meets the 1% rule at list price ($2k rent vs $109k).
- Cap rate 13.1% vs local median 4.4% in New Orleans — top-decile yield for the area; either an underpriced asset or a hidden risk that comps aren't pricing in. Stress-test before assuming the spread holds.
Location & tenants
- Location reads 81/100 on livability (#3 in LA, #1,383 nationally) — a professional / high-income tenant draw. Strengths: amenities A+, commute A+, health & safety A+; Watch: crime C-, employment D.
- Orleans Parish (urban): math 11% / reading 27% proficiency, ranked #69 of 98 in LA (top 70%) — low school quality limits family demand, transient renter base, plan for 1-2y turnover; 68% free/reduced lunch — lower-income household profile, screen leases tightly.
- Market conditions: Rents soft (-0.2%/yr); 224 active listings in the ZIP; 14 comparable units currently listed for rent nearby; rentals at typical pace (median 24d on market — plan ~3-4 weeks tenant-placement turnaround); lower-income renter base — watch delinquency; 710 units permitted in Orleans Parish in 2024 (244 in 5+ unit buildings).
- At $1,898/mo this rent would consume 55% of the median local household income ($42k/yr) (locally 1767% of renters already pay >50% of income on rent) — very limited rent-growth headroom before tenants either downsize or default.
Forward outlook
- Local home prices are declining (-3.0%/yr); year-one equity from $754 of loan paydown is wiped out by about $3k of value loss. Plan a longer hold.
- Orleans County population projected at +61% by 2050 — long-run rental-demand tailwind backs the buy-and-hold thesis.
- At projected returns (-3.0% appreciation + 0.0% rent growth), your $31k cash investment doubles in ~8 years — after that, you're playing with house money.
Negotiation context
- Only 9 days on market — expect competitive offers; lowballing is unlikely to land.
- 16 sale attempts since 33y ago with the ask held roughly flat each time — persistent listings suggest the price (not the market) is what's stuck; bring a comps-based counter.
- Current owner paid $89k; 23% above their basis — modest negotiation headroom, anchor on the comps not their cost.
Risks & watch-outs
- Watch-outs: flood insurance adds $66/mo.
- Climate carrying-cost: severe flood risk; severe wind risk, 99% chance of damaging wind over 30y; extreme-heat days projected 7→21/yr by 2055 (HVAC capex compounding) — expect insurance premiums to compound above CPI over the hold.
Questions for the listing agent
- Built in 1967 — when were the roof, HVAC, electrical panel, plumbing, and water heater last replaced?
- What's the actual annual flood-insurance premium (NFIP or private), and is the property in a SFHA with mandatory coverage?
- What does the HOA fee cover, when was the last increase, and are there any pending special assessments or reserve-fund shortfalls?
- Is there a deadline driving the sale (1031 exchange, divorce, estate, relocation)? That informs how much negotiation room exists.
- This sits on a lake — are riparian / water-frontage rights deeded with the parcel? Any dock permits, shoreline easements, or HOA water-use restrictions?
- What's the documented flood / surge / shoreline-erosion history here (FEMA AND non-FEMA — e.g., storm surge, creek backup, septic-field saturation)?
- Any water-quality or seasonal algae-bloom issues that affect tenant satisfaction or short-term-rental demand?
- What's the average days-on-market for RENTAL listings here right now (not sales)? A rising rental-DOM trend means longer vacancies and softer asking-rent achievability than the comps imply.
- What's the recent tenant-quality profile in this submarket — average credit score on applications, eviction rate, late-payment / NSF rate, and stable-employment percentage? A property-management company in the area should have these aggregated.
- How much new for-sale + rental construction is in the pipeline within 1–3 miles? Heavy new supply typically softens prices + rents 12–24 months out; constrained supply supports both.
Investment metrics
- 1% rule
- 1.74% ✓
- Cap rate
- 13.14%
- Cash-on-cash
- 24.44%
- DSCR
- 2.09
- GRM
- 4.8
CMA / ARV
- ARV (on-the-fly)
- $213,208
- Comps found
- 12
Show comp detail 12 sales within ~0.75 mi
| Address | Dist | Beds/Ba | Sqft | Sold | Price | $/sf | Match |
|---|---|---|---|---|---|---|---|
| 6721 Dorchester Dr | 0.70mi | 3/2.0 (-1) | 1,800 (-2%) | 2mo | $209,000 | $116 | 55 |
| 7840 W Laverne St | 0.24mi | 3/2.0 (-1) | 1,684 (-8%) | 16mo | $235,000 | $140 | 55 |
| 5919 Pauline St | 0.71mi | 3/2.5 (-1) | 1,887 (+3%) | 4mo | $350,000 | $185 | 54 |
| 1307 Chimney Wood Ln | 0.27mi | 3/2.5 (-1) | 1,700 (-8%) | 23mo | $78,500 | $46 | 51 |
| 7530 Newcastle St | 0.52mi | 3/2.0 (-1) | 1,922 (+5%) | 13mo | $115,000 | $60 | 50 |
| 7445 Beau St | 0.16mi | 3/2.0 (-1) | 1,644 (-11%) | 22mo | $185,000 | $113 | 49 |
| 7400 Newcastle St | 0.51mi | 4/3.0 | 2,009 (+9%) | 12mo | $235,500 | $117 | 48 |
| 6775 Deanne St | 0.48mi | 3/2.0 (-1) | 1,660 (-10%) | 13mo | $65,000 | $39 | 44 |
| 6701 Morrison Rd | 0.68mi | 3/3.0 (-1) | 2,000 (+9%) | 8mo | $255,000 | $128 | 40 |
| 6651 Foch St | 0.59mi | 4/2.0 | 1,635 (-11%) | 18mo | $172,000 | $105 | 37 |
| 6731 Coventry St St | 0.71mi | 3/2.0 (-1) | 1,647 (-10%) | 19mo | $116,000 | $70 | 26 |
| 6457 Debore Dr | 0.73mi | 3/2.0 (-1) | 1,565 (-15%) | 19mo | $264,000 | $169 | 18 |
Match score weights: distance 35% · size 25% · config 20% · recency 20%. Top-matched comps best support the ARV.
Projected returns pro-forma
-3.0% appreciation · 0.0% rent growth · sell at horizon
- IRR
- 10.6%
- Equity multiple
- 1.40×
- Total profit
- $12,273
- Equity at exit
- $16,252
- IRR
- 16.7%
- Equity multiple
- 2.16×
- Total profit
- $35,306
- Equity at exit
- $9,424
Cash invested: $30,520 (down + closing). Projections, not guarantees.
Landlord ↔ Tenant lean methodology
- Overall (STATE)
- 90 Strongly Landlord-Friendly
- State Louisiana
- 90 Strongly Landlord-Friendly · R+12
- County
- — inherits STATE
- City
- — inherits STATE
ZIP-level market 70126
- Home prices YoY
- -17.0%
- Rents YoY
- -0.2%
- Active inventory
- 224
- Price-to-rent
- 4.8×
Monthly cashflow live
- Estimated rent
- $1,898 high interval (Pro) →
- Mortgage (P&I)
- −$572
- Tax from tax record
- −$89 /mo · $1,068/yr
- Insurance
- −$45
- Flood insurance flood zone
- −$66 /mo · $798/yr
- HOA
- −$172
- Vacancy / Maint / Mgmt
- −$399
- Net cashflow
- $555
Break-even live
UW: 25.0% down · 7.5% · 30yr · 1.5% tax · 5.0% vac · 8.0% maint · 8.0% mgmt
Financing live
Cash to close
- Down payment
- $27,250
- Closing costs
- $3,270
- Reserves months
- —
- Total cash needed
- —
Loan-product check · same deal, 3 products live
Conventional
25% down · 7.5% · 30yr
- Down + closing
- —
- Monthly P&I
- —
- Monthly cashflow
- —
- DSCR
- —
- Eligible?
- —
Personal DTI + credit; lowest rate.
DSCR
20% down · 8.5% · 30yr
- Down + closing
- —
- Monthly P&I
- —
- Monthly cashflow
- —
- DSCR
- —
- Eligible?
- —
No personal income docs; deal must DSCR.
Hard money
10% down · 12.0% · 12mo
- Down + closing
- —
- Monthly P&I
- —
- Monthly cashflow
- —
- DSCR
- —
- Eligible?
- —
Short-term bridge; refi at stabilization.
Rent comps 14 comps
| Address | Beds | Baths | Sqft | Rent | $/sqft | DOM | Units | Dist |
|---|---|---|---|---|---|---|---|---|
| 5704 Count Ln New Orleans, LA | 3.0 | 1.5 | 1572 | $1,700 | $1.08 | 23d | 1 | 0.11mi |
| 7530 Newcastle St New Orleans, LA | 3.0 | 2.0 | 1913 | $1,800 | $0.94 | 23d | 1 | 0.49mi |
| 5925 Pauline Dr New Orleans, LA | 3.0 | 2.0 | 1566 | $2,325 | $1.48 | 16d | 1 | 0.73mi |
| 5747 Pauline Dr New Orleans, LA | 3.0 | 1.0 | 1300 | $1,400 | $1.08 | 11d | 1 | 0.76mi |
| 4819 21 Francis Dr New Orleans, LA | 3.0 | 1.0 | 1272 | $1,880 | $1.48 | 3d | 1 | 0.90mi |
| 6628 Harbourview Dr New Orleans, LA | 3.0 | 2.5 | 1520 | $1,700 | $1.12 | 3d | 1 | 0.91mi |
| 4745 Francis Dr New Orleans, LA | 3.0 | 2.0 | 1311 | $1,550 | $1.18 | 16d | 1 | 0.95mi |
| 5920 Boeing St New Orleans, LA | 3.0 | 1.5 | 1340 | $1,400 | $1.04 | 23d | 1 | 0.99mi |
| 4522 Shalimar Dr New Orleans, LA | 3.0 | 2.0 | 1350 | $1,850 | $1.37 | 23d | 1 | 1.03mi |
| 4441 Cessna Ct New Orleans, LA | 3.0 | 1.5 | 1400 | $1,600 | $1.14 | 23d | 1 | 1.08mi |
| 4722 Mithra St New Orleans, LA | 3.0 | 1.5 | 1295 | $1,600 | $1.24 | 23d | 1 | 1.09mi |
| 4409 Skyview Dr New Orleans, LA | 4.0 | 2.5 | 1560 | $1,700 | $1.09 | 16d | 1 | 1.10mi |
| 5550 Press Dr New Orleans, LA | 3.0 | 2.0 | 1640 | $2,000 | $1.22 | 16d | 1 | 1.31mi |
| 6416 Baccich St New Orleans, LA | 3.0 | 2.0 | 1908 | $2,500 | $1.31 | 43d | 1 | 1.45mi |
HOA detail
- Monthly dues
- $172 · $2,064/yr
- Likely covers
- watertrashelectriclandscapingpool
Listing history 7 events
-
2026-06-18days on market $109,000 Active 9 DOM
-
2026-06-17days on market $109,000 Active 8 DOM
-
2026-06-16days on market $109,000 Active 7 DOM
-
2026-06-15days on market $109,000 Active 6 DOM
-
2026-06-13days on market $109,000 Active 4 DOM
-
2026-06-10remarks 699-char remark
-
2026-06-10$109,000 Active 1 DOM
ⓘ Source: listings_history table (triggers on properties + properties_extension) + one-shot
backfill from property_details.listing_events for pre-trigger history.
Tax reassessment forecast LA · Resets to sale price
- Current annual tax
- $1,068 · $89/mo
- Projected year-2 tax
- $1,068 · $89/mo
- Expected delta
- $0/yr ($0/mo · 0.0%)
ⓘ Screening estimate from a state-policy table — verify with the county assessor before closing.
Climate risk First Street
- Flood 8/10 Severe FEMA zone X (shaded) · 60% chance over 30 yrs
- Wildfire 1/10 Low
- Heat 10/10 Extreme 7 d/yr ≥107°F today · 21 d/yr by 30 yrs out
- Wind 10/10 Extreme 99% chance of damaging wind over 30 yrs
- Air quality 3/10 Moderate 3 unhealthy d/yr today · 3 by 30 yrs out
Nearby sold comps map
Loading sold comps map…
Walkable amenities ~0.75 mi
Loading nearby amenities…
Taxation est. · year 1
- Rental income
- $22,778
- − Mortgage interest
- −$6,106
- − Property taxes
- −$1,068
- − Insurance
- −$1,342
- − Repairs & maintenance
- −$1,822
- − Management
- −$1,822
- − HOA
- −$2,064
- − Depreciation
- −$3,171
- Taxable income
- $5,382
- Est. tax owed @ 24.0%
- −$1,292
- After-tax cash flow
- $5,369/yr
For passive investors: Depreciation is non-cash, so a rental often shows a tax loss while cash-flowing — sheltering income. Rental losses are passive: they offset passive income freely, and up to $25,000/yr can offset ordinary (W-2) income if you actively participate and your MAGI is under $100k (phasing out to $0 by $150k); unused losses carry forward. On sale, claimed depreciation is recaptured at up to 25%, and gains may owe capital-gains tax (a 1031 exchange can defer both). Figures are a year-1 estimate at your 24.0% rate — not tax advice; consult a CPA.
Schools (NCES district)
- District
- Orleans Parish
- NCES district ID
- 2201170
- Math proficiency
- 11% ▼ -52.00%
- Reading proficiency
- 27% ▼ -46.00%
- Median HH income
- $37,011
- Composite
- 15.78/100
- National rank
- #9271
- State rank
- #69 of 98 in LA
Livability — New Orleans
- Score
- 81/100
- State rank
- #3
- US rank
- #1383
Category grades
Schools grade is shown separately in the Schools card above.
Census & demographics
- Census place
- New Orleans, LA
- County
- Orleans Parish · 338,817 people
- City population
- 338,817
- Metro
- New Orleans-Metairie, LA
- Population (ZIP)
- 27,047
- Household income
- $41,709
- Rent vs Own
- Severe rent burden
- 1767.0
Population outlook (Orleans County) Hauer SSP2
- Today (2025)
- 513,025 people
- By 2030
- 575,781 · +12.2%
- By 2040
- 700,174 · +36.5%
- By 2050
- 826,541 · +61.1%
- By 2075
- 1,123,374 · +119.0%
- By 2100
- 1,355,609 · +164.2%
Race, ethnicity, and origin ACS 2023
- Neighborhood character
- Predominantly Black (85%)
- Race & ethnicity
- Black 85% Hispanic / Latino 6% Two or more races 5% White 5%
- Hispanic origin (detail)
- Common ancestry
- Lithuanian 1% Italian 1%
- Foreign-born
- 4% · Canada, Vietnam
- Languages at home
- 94% English-only · Spanish 5% Other Indo-European 1%
Political lean MEDSL · Orleans
- 2024 margin
- Solid D (+67.0) · D 82.2% · R 15.2% · Other 2.7%
- 2008→2024 swing
- +6.7pp toward D · 2008: 60.3pp · 2024: 67.0pp
- All cycles
- 2024: D+67.0 2020: D+68.2 2016: D+66.2 2012: D+62.5 2008: D+60.3
Not yet ingested
- Civics
- —
Market trends
- HPI YoY
- ▼ -36.35%
- Current HPI
- 177.355
- Rent YoY
- ▼ -0.24%
- Metro
- New Orleans-Metairie, LA
- State GDP YoY
- ▲ 3.29%
- F500 in state
- 10
Industry mix (Fortune 500 HQ in LA)
| Industry | F500 HQs | Revenue |
|---|---|---|
| Telecommunications | 2 | $23B |
|
||
| Utilities | 1 | $12B |
|
||
| Wholesale / Distribution | 1 | $5B |
|
||
| Advertising | 1 | $2B |
|
||
Price history
+82.0% since first listed29 events — show timeline
- 2026-06-09 Listed $109,000 GSREIN
- 2026-06-09 Listed $109,000 AcadianaMLS
- 2023-09-20 Sold (Public Records) $88,553 Public Records
- 2023-09-18 Sold (MLS) — GBRMLS
- 2023-08-17 Pending — GBRMLS
- 2023-06-26 Listed $95,000 AcadianaMLS
- 2023-06-26 Listed $95,000 GBRMLS
- 2018-12-20 Pending — GSREIN
- 2018-11-02 Sold (Public Records) $60,000 Public Records
- 2018-10-31 Sold (MLS) $60,000 GSREIN
- 2018-10-24 Pending — GSREIN
- 2018-08-28 Relisted — GSREIN
- 2018-07-30 Listing Removed — GSREIN
- 2018-07-23 Listed $83,000 GSREIN
- 2018-07-23 Listed $83,000 AcadianaMLS
- 2018-05-14 Listing Removed — GSREIN
- 2018-04-05 Listed $85,000 AcadianaMLS
- 2018-04-05 Listed $85,000 GSREIN
- 2018-03-16 Listing Removed — GSREIN
- 2017-12-12 Relisted — GSREIN
- 2017-10-09 Contingent — GSREIN
- 2017-09-18 Listed $90,000 GSREIN
- 2017-09-15 Listed $90,000 AcadianaMLS
- 2014-03-10 Listed $89,000 GSREIN
- 2014-03-10 Listed $89,000 AcadianaMLS
- 1993-06-14 Sold (Public Records) $56,000 Public Records
- 1993-06-14 Sold (MLS) $56,000 GSREIN
- 1993-04-23 Listed $59,900 GSREIN
- 1993-04-23 Listed $59,900 AcadianaMLS
Property tax history
+0.6%/yrLatest (2026): $1,068 · +1.1% YoY. Source: county tax records.
Cash-flow waterfall
monthlySold comps — $/sqft
last 12 mo · ≤1 miLoading sold comps…