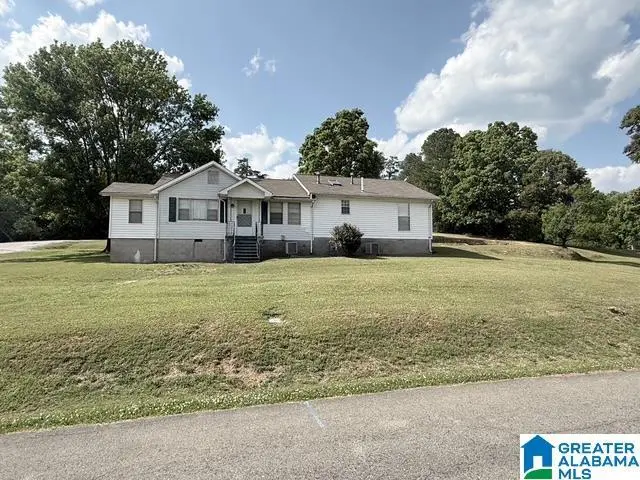
130 15th Ave SE · Graysville, AL
Flood risk 1/10 · Minimal
- FEMA flood zone
- X (unshaded)
- Chance of flooding over 30 yrs
- 0.0%
- Est. flood insurance / yr
- $507 – $1,088
Fire risk 4/10 · Minor
- Est. fire insurance / yr
- $916 – $1,700
Heat risk 6/10 · Moderate
- Hot days now (above 106°F)
- 7 days/yr
- Hot days in 30 yrs
- 20 days/yr
Wind risk 6/10 · Moderate
- Chance of severe wind over 30 yrs
- 27.0%
Air-quality risk 3/10 · Minor
- Unhealthy air days now
- 3 days/yr
- Unhealthy air days in 30 yrs
- 5 days/yr
Risk factors via First Street. Map © Google.
Why this score? — see what drove the C+ grade
The composite is a weighted blend of 9 inputs, each scored 0–100. Each bar is that input's sub-score; the figure is the points it added to the 100-point composite (weight × sub-score).
- Cash flow +21.8/30.0
- ARV discount +13.4/15.0
- Appreciation +7.1/10.0
- DSCR +7.0/10.0
- 1% rule +4.7/10.0
- Livability +3.0/5.0
- Rent growth +2.5/5.0
- Condition / age +2.5/5.0
- Schools +1.8/10.0
$134,900
🖨 Deal sheet 📄 Offer letter ✓ Due diligence
Listing remarks
Welcome Home ! This beautiful Spacious home features 3 Bedrooms, 2 full bathrooms, Kitchen, and Dining Room. Enjoy time sitting on the porch early in the morning or in the evening after a day of work. Schedule your private showing today.
Key facts
- 0.41 acre lot
- Built 1950
- Listed 6 days
Property features AI
Finance
- Other: Lot size approximately 0.41 acres; Located in the Graysville subdivision
Exterior
- Parking: Driveway parking
- Utilities: Public water; Septic system; Electric water heater; Internet service availability: Unknown
- Home design: Existing (previously built) property; Siding: Vinyl; Foundation: Crawl space
- Construction: Vinyl siding construction
- Exterior features: Front porch; No pool; No patio; No deck; Not waterfront; No garden/patio
Interior
- Kitchen: Laminate countertops; Built-in dishwasher; Built-in microwave; Electric stove
- Bedrooms: Bedrooms located on main level
- Flooring: Carpet; Tile; Vinyl
- Bathrooms: 2 full bathrooms; Tub/shower combo
- Heating & cooling: Central heating; Central cooling
- Interior features: Split bedroom floorplan; Ceilings: Other (see remarks)
- Laundry & utility: Washer hookup; Electric dryer hookup; Laundry located on main level in a closet
Neighborhood map
What this means for you Summary
Snapshot
- This is a 3-bed/1.0-bath single-family listed at $135k.
Deal economics
- At list price, monthly cash flow is $211 ($3k/yr) — positive.
- The deal already cash-flows at list — no discount required.
- To meet the 1% rule (rent ≥ 1% of price), the offer needs to be $131k (3.0% below list).
- Recommended offer: $131k (3.0% below list) — sets the bar for 1% rule.
Location & tenants
- Location reads 59/100 on livability (#321 in AL) — a working-class tenant base; expect higher turnover. Strengths: crime A+, cost of living A+, housing A+; Watch: amenities F, commute F, employment D-.
- Jefferson County (suburban): math 9% / reading 32% proficiency, ranked #104 of 129 in AL (top 81%) — low school quality limits family demand, transient renter base, plan for 1-2y turnover.
- Zoned schools: Brookville Elementary School (math 17% / reading 22%, grade F, #467 of 627 statewide, top 76%, 187 students, 79% FRL); Minor High School (math 4% / reading 8%, grade F, #275 of 305 statewide, top 90%, 915 students, 84% FRL) — zoned schools average 82% FRL vs 49% district-wide (33 pts higher); higher-poverty schools than district average — tighter screening recommended.
- Market conditions: 21 active listings in the ZIP; 6 comparable units currently listed for rent nearby; rentals lingering (median 44d on market — plan ~5-8 weeks vacancy on turnover, expect pricing pressure); 50% of comp listings sitting > 30 days — soft ceiling on asking rent; 2,114 units permitted in Jefferson County in 2024 (556 in 5+ unit buildings).
Forward outlook
- In year one you build about $6k of equity ($933 loan paydown + $6k appreciation (4.1% local appreciation)).
- Jefferson County population projected to shrink 4% by 2050 — rents likely to lag national; underwrite the cash flow, not the appreciation.
- At projected returns (4.1% appreciation + 3.0% rent growth), your $38k cash investment doubles in ~4 years — after that, you're playing with house money.
- By year 6, paydown + projected appreciation supports a ~$35k cash-out refi (75% LTV) — recoverable capital for the next deal without selling this one.
Negotiation context
- Only 6 days on market — expect competitive offers; lowballing is unlikely to land.
- Current owner paid $72k; list at $135k implies a 86% gain — meaningful room to come down on a strong offer.
Risks & watch-outs
- Watch-outs: built in 1950 — expect roof / HVAC / electrical / plumbing capex.
- Climate carrying-cost: major wind risk, 27% chance of damaging wind over 30y; extreme-heat days projected 7→20/yr by 2055 (HVAC capex compounding) — expect insurance premiums to compound above CPI over the hold.
Questions for the listing agent
- Built in 1950 — when were the roof, HVAC, electrical panel, plumbing, and water heater last replaced?
- Is there a deadline driving the sale (1031 exchange, divorce, estate, relocation)? That informs how much negotiation room exists.
- Schools are F-rated, which usually means shorter tenancies and higher turnover. Who's the typical renter profile here, and what's been the actual vacancy rate?
- What's the average days-on-market for RENTAL listings here right now (not sales)? A rising rental-DOM trend means longer vacancies and softer asking-rent achievability than the comps imply.
- What's the recent tenant-quality profile in this submarket — average credit score on applications, eviction rate, late-payment / NSF rate, and stable-employment percentage? A property-management company in the area should have these aggregated.
- How much new for-sale + rental construction is in the pipeline within 1–3 miles? Heavy new supply typically softens prices + rents 12–24 months out; constrained supply supports both.
Investment metrics
- 1% rule
- 0.97% ✗
- Cap rate
- 8.17%
- Cash-on-cash
- 6.70%
- DSCR
- 1.30
- GRM
- 8.6
CMA / ARV
- ARV (on-the-fly)
- $155,440
- Comps found
- 6
Show comp detail 6 sales within ~0.75 mi
| Address | Dist | Beds/Ba | Sqft | Sold | Price | $/sf | Match |
|---|---|---|---|---|---|---|---|
| 1533 1st St SE | 0.04mi | 3/2.0 | 1,748 (-10%) | 8mo | $115,000 | $66 | 71 |
| 928 2nd St SE | 0.51mi | 3/2.0 | 1,851 (-5%) | 3mo | $100,000 | $54 | 62 |
| 831 1st St SE | 0.58mi | 4/2.5 (+1) | 1,900 (-2%) | 7mo | $190,500 | $100 | 52 |
| 1203 Main St | 0.28mi | 3/2.0 | 2,216 (+14%) | 18mo | $170,000 | $77 | 44 |
| 201 Mcallister St | 0.68mi | 4/2.0 (+1) | 1,808 (-7%) | 16mo | $145,000 | $80 | 34 |
| 5417 Storey Dr | 0.62mi | 4/2.5 (+1) | 1,743 (-10%) | 16mo | $206,000 | $118 | 29 |
Match score weights: distance 35% · size 25% · config 20% · recency 20%. Top-matched comps best support the ARV.
Projected returns pro-forma
4.12% appreciation · 3.0% rent growth · sell at horizon
- IRR
- 16.5%
- Equity multiple
- 2.00×
- Total profit
- $37,799
- Equity at exit
- $69,340
- IRR
- 17.3%
- Equity multiple
- 3.81×
- Total profit
- $106,083
- Equity at exit
- $114,171
Cash invested: $37,772 (down + closing). Projections, not guarantees.
Landlord ↔ Tenant lean methodology
- Overall (STATE)
- 90 Strongly Landlord-Friendly
- State Alabama
- 90 Strongly Landlord-Friendly · R+15
- County
- — inherits STATE
- City
- — inherits STATE
ZIP-level market 35073
- Home prices YoY
- 2.4%
- Active inventory
- 21
- Price-to-rent
- 8.6×
Monthly cashflow live
- Estimated rent
- $1,308 high interval (Pro) →
- Mortgage (P&I)
- −$707
- Tax from tax record
- −$59 /mo · $710/yr
- Insurance
- −$56
- HOA
- −$0
- Vacancy / Maint / Mgmt
- −$275
- Net cashflow
- $211
Break-even live
UW: 25.0% down · 7.5% · 30yr · 1.5% tax · 5.0% vac · 8.0% maint · 8.0% mgmt
Financing live
Cash to close
- Down payment
- $33,725
- Closing costs
- $4,047
- Reserves months
- —
- Total cash needed
- —
Loan-product check · same deal, 3 products live
Conventional
25% down · 7.5% · 30yr
- Down + closing
- —
- Monthly P&I
- —
- Monthly cashflow
- —
- DSCR
- —
- Eligible?
- —
Personal DTI + credit; lowest rate.
DSCR
20% down · 8.5% · 30yr
- Down + closing
- —
- Monthly P&I
- —
- Monthly cashflow
- —
- DSCR
- —
- Eligible?
- —
No personal income docs; deal must DSCR.
Hard money
10% down · 12.0% · 12mo
- Down + closing
- —
- Monthly P&I
- —
- Monthly cashflow
- —
- DSCR
- —
- Eligible?
- —
Short-term bridge; refi at stabilization.
Rent comps 6 comps
| Address | Beds | Baths | Sqft | Rent | $/sqft | DOM | Units | Dist |
|---|---|---|---|---|---|---|---|---|
| 958 S Main St Graysville, AL | 3.0 | 2.0 | 1330 | $1,285 | $0.97 | 43d | 1 | 0.54mi |
| 208 Spring St Adamsville, AL | 4.0 | 2.5 | 2266 | $1,450 | $0.64 | 43d | 1 | 0.96mi |
| 215 2nd Pl SW Graysville, AL | 3.0 | 2.0 | 1309 | $1,150 | $0.88 | 2d | 1 | 1.21mi |
| 933 Crestview Ln Adamsville, AL | 3.0 | 1.5 | 1500 | $1,285 | $0.86 | 44d | 1 | 1.22mi |
| 5309 Hazelwood Rd Adamsville, AL | 3.0 | 2.0 | 1526 | $1,325 | $0.87 | 1d | 1 | 1.27mi |
| 118 3rd St NW Graysville, AL | 3.0 | 2.0 | 1374 | $1,300 | $0.95 | 1d | 1 | 1.44mi |
Listing history 6 events
-
2026-06-18days on market $134,900 Active 6 DOM
-
2026-06-17days on market $134,900 Active 5 DOM
-
2026-06-16days on market $134,900 Active 4 DOM
-
2026-06-15days on market $134,900 Active 3 DOM
-
2026-06-13remarks 238-char remark
-
2026-06-13$134,900 Active 1 DOM
ⓘ Source: listings_history table (triggers on properties + properties_extension) + one-shot
backfill from property_details.listing_events for pre-trigger history.
Tax reassessment forecast AL · Resets to sale price
- Current annual tax
- $710 · $59/mo
- Projected year-2 tax
- $710 · $59/mo
- Expected delta
- $0/yr ($0/mo · 0.0%)
ⓘ Screening estimate from a state-policy table — verify with the county assessor before closing.
Climate risk First Street
- Flood 1/10 Low FEMA zone X (unshaded) · 0% chance over 30 yrs
- Wildfire 4/10 Moderate
- Heat 6/10 Major 7 d/yr ≥106°F today · 20 d/yr by 30 yrs out
- Wind 6/10 Major 27% chance of damaging wind over 30 yrs
- Air quality 3/10 Moderate 3 unhealthy d/yr today · 5 by 30 yrs out
Nearby sold comps map
Loading sold comps map…
Walkable amenities ~0.75 mi
Loading nearby amenities…
Taxation est. · year 1
- Rental income
- $15,702
- − Mortgage interest
- −$7,556
- − Property taxes
- −$710
- − Insurance
- −$674
- − Repairs & maintenance
- −$1,256
- − Management
- −$1,256
- − Depreciation
- −$3,924
- Taxable income
- $324
- Est. tax owed @ 24.0%
- −$78
- After-tax cash flow
- $2,453/yr
For passive investors: Depreciation is non-cash, so a rental often shows a tax loss while cash-flowing — sheltering income. Rental losses are passive: they offset passive income freely, and up to $25,000/yr can offset ordinary (W-2) income if you actively participate and your MAGI is under $100k (phasing out to $0 by $150k); unused losses carry forward. On sale, claimed depreciation is recaptured at up to 25%, and gains may owe capital-gains tax (a 1031 exchange can defer both). Figures are a year-1 estimate at your 24.0% rate — not tax advice; consult a CPA.
Schools (NCES district)
- District
- Jefferson County
- NCES district ID
- 0101920
- Math proficiency
- 9% ▼ -24.00%
- Reading proficiency
- 32% ▼ -5.00%
- Median HH income
- $51,712
- Composite
- 18.4/100
- National rank
- #8937
- State rank
- #104 of 129 in AL
Livability — Graysville
- Score
- 59/100
- State rank
- #321
- US rank
- #19807
Category grades
Schools grade is shown separately in the Schools card above.
Census & demographics
- Census place
- Graysville, AL
- Population (ZIP)
- 2,839
Population outlook (Jefferson County) Hauer SSP2
- Today (2025)
- 669,185 people
- By 2030
- 669,694 · +0.1%
- By 2040
- 661,388 · -1.2%
- By 2050
- 643,086 · -3.9%
- By 2075
- 577,267 · -13.7%
- By 2100
- 474,758 · -29.1%
Race, ethnicity, and origin ACS 2023
- Neighborhood character
- Predominantly White (69%)
- Race & ethnicity
- White 69% Black 27% Two or more races 4%
- Common ancestry
- Iranian 2% Slovak 1% Lithuanian 1%
- Languages at home
- 98% English-only · Spanish 1% German/W. Germanic 1%
Political lean MEDSL · Jefferson
- 2024 margin
- D (+10.4) · D 54.6% · R 44.2% · Other 1.2%
- 2008→2024 swing
- +5.4pp toward D · 2008: 5.1pp · 2024: 10.4pp
- All cycles
- 2024: D+10.4 2020: D+13.2 2016: D+7.2 2012: D+6.0 2008: D+5.1
Not yet ingested
- Civics
- —
Market trends
- HPI YoY
- ▲ 4.12%
- Current HPI
- 176.8227
- Rent YoY
- —
- Metro
- —
- State GDP YoY
- ▲ 2.94%
- F500 in state
- 4
Industry mix (Fortune 500 HQ in AL)
| Industry | F500 HQs | Revenue |
|---|---|---|
| Financial Services | 1 | $8B |
|
||
| Healthcare | 1 | $5B |
|
||
Price history
+979.2% since first listed3 events — show timeline
- 2026-06-12 Listed $134,900 Greater Alabama MLS
- 2024-12-02 Sold (Public Records) $72,500 Public Records
- 1973-02-14 Sold (Public Records) $12,500 Public Records
Property tax history
+4.2%/yrLatest (2025): $710 · +0.0% YoY. Source: county tax records.
Cash-flow waterfall
monthlySold comps — $/sqft
last 12 mo · ≤1 miLoading sold comps…