 Multi-family
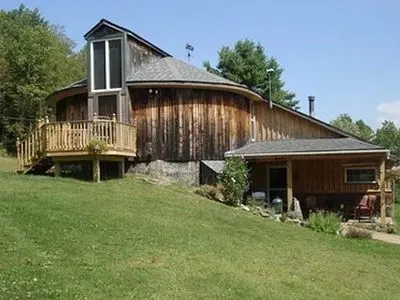
1310 County Highway 38 · Worcester, NY
Flood risk No data
- FEMA flood zone
- —
- Chance of flooding over 30 yrs
- —
- Est. flood insurance / yr
- —
Fire risk No data
- Est. fire insurance / yr
- —
Heat risk No data
- Hot days now (above threshold)
- —
- Hot days in 30 yrs
- —
Wind risk No data
- Chance of severe wind over 30 yrs
- —
Air-quality risk No data
- Unhealthy air days now
- —
- Unhealthy air days in 30 yrs
- —
Risk factors via First Street. Map © Google.
Why this score? — see what drove the C- grade
The composite is a weighted blend of 9 inputs, each scored 0–100. Each bar is that input's sub-score; the figure is the points it added to the 100-point composite (weight × sub-score).
- Cash flow +17.3/30.0
- ARV discount +7.5/15.0
- Appreciation +5.9/10.0
- 1% rule +5.8/10.0
- DSCR +5.4/10.0
- Schools +3.7/10.0
- Livability +3.0/5.0
- Rent growth +2.5/5.0
- Condition / age +2.5/5.0
$300,000
🖨 Deal sheet (PDF) 📄 Offer letter ✓ Due diligence
Multi-family units
County records classify this as Multi-Family (2-4 Unit). Listing-text estimate: 1 unit. estimate disagrees with records
Listing remarks
Main house- 4 bedroom, two bath, living room, bar, kitchen and dining room. 4 stocked ponds, trails. Second building- separate Morton building with separate address and entry. There is a two bedroom open floor plan apartment. Both addresses are on the same deed and all sit on 12 acres. Mini split heat system but is not all the way installed. There is also a pellet stove. There is some work that needs to be done to the property.
Key facts
- Trails
- 4 stocked ponds
- Pellet stove
Tags
Neighborhood map
What this means for you Summary
Snapshot
- This is a 3-bed/1.5-bath multifamily listed at $300k.
Deal economics
- At list price, monthly cash flow is $220 ($3k/yr) — positive.
- The deal already cash-flows at list — no discount required.
- Meets the 1% rule at list price ($3k rent vs $300k).
- Recommended offer: $296k (1.5% below list) — sets the bar for market timing.
Location & tenants
- Location reads 59/100 on livability (#1,037 in NY) — a working-class tenant base; expect higher turnover. Strengths: housing A+, cost of living A; Watch: health & safety C-, schools D-, crime F.
- Worcester Central School District (rural): math 40% / reading 40% proficiency, ranked #642 of 755 in NY (top 85%) — families likely to look elsewhere, expect single-tenant / working-renter base with shorter leases.
- Market conditions: 24 active listings in the ZIP; 133 units permitted in Otsego County in 2024 (10 in 5+ unit buildings).
Forward outlook
- In year one you build about $8k of equity ($2k loan paydown + $6k appreciation (1.9% local appreciation)).
- Otsego County population projected at -21% by 2050 — secular population decline; favor cash flow + early exit over multi-decade hold.
- At projected returns (1.9% appreciation + 3.0% rent growth), your $84k cash investment doubles in ~7 years — after that, you're playing with house money.
- By year 5, paydown + projected appreciation supports a ~$34k cash-out refi (75% LTV) — recoverable capital for the next deal without selling this one.
Negotiation context
- It's been on market 26 days — a 2% lower offer ($296k) is reasonable based on typical stale-listing flexibility.
- Current owner paid $200k; list at $300k implies a 50% gain — meaningful room to come down on a strong offer.
Risks & watch-outs
- Watch-outs: property tax is 2.5% of price.
Questions for the listing agent
- Built in 1974 — when were the roof, HVAC, electrical panel, plumbing, and water heater last replaced?
- Property tax is high relative to price — has the assessment been appealed recently, and will the sale trigger a re-assessment?
- Is there a deadline driving the sale (1031 exchange, divorce, estate, relocation)? That informs how much negotiation room exists.
- Schools are D-rated, which usually means shorter tenancies and higher turnover. Who's the typical renter profile here, and what's been the actual vacancy rate?
- Crime grade is F in this area — have there been break-ins, vandalism, or insurance claims at this property in the last 3 years? What carrier currently insures it and at what premium?
- What's the average days-on-market for RENTAL listings here right now (not sales)? A rising rental-DOM trend means longer vacancies and softer asking-rent achievability than the comps imply.
- What's the recent tenant-quality profile in this submarket — average credit score on applications, eviction rate, late-payment / NSF rate, and stable-employment percentage? A property-management company in the area should have these aggregated.
- How much new apartment / multifamily construction is in the pipeline within 1–3 miles? Heavy new supply (>2% of stock underway) typically softens rents 12–24 months out; light construction supports rent growth.
Investment metrics
- 1% rule
- 1.07% ✓
- Cap rate
- 7.17%
- Cash-on-cash
- 3.15%
- DSCR
- 1.14
- GRM
- 7.8
CMA / ARV
No comps found within radius.
Projected returns pro-forma
1.88% appreciation · 3.0% rent growth · sell at horizon
- IRR
- 7.3%
- Equity multiple
- 1.39×
- Total profit
- $32,990
- Equity at exit
- $116,390
- IRR
- 10.8%
- Equity multiple
- 2.44×
- Total profit
- $120,757
- Equity at exit
- $166,126
Cash invested: $84,000 (down + closing). Projections, not guarantees.
Landlord ↔ Tenant lean methodology
- Overall (STATE)
- 15 Strongly Tenant-Friendly
- State New York
- 15 Strongly Tenant-Friendly · D+10
- County
- — inherits STATE
- City
- — inherits STATE
ZIP-level market 12197
- Home prices YoY
- 0.6%
- Active inventory
- 24
- Price-to-rent
- 21.0×
Monthly cashflow live
- Estimated rent
- $3,225 medium interval (Pro) →
- Mortgage (P&I)
- −$1,573
- Tax from tax record
- −$629 /mo · $7,549/yr
- Insurance
- −$125
- HOA
- −$0
- Vacancy / Maint / Mgmt
- −$677
- Net cashflow
- $220
Break-even live
Sensitivity live
| Price | -10% $390 | -5% $305 | +0% $220 | +5% $136 | +10% $51 |
|---|---|---|---|---|---|
| Rent | -10% $-34 | -5% $93 | +0% $220 | +5% $348 | +10% $475 |
| Rate | -1.0pp $371 | -0.5pp $297 | base $220 | +0.5pp $143 | +1.0pp $64 |
3-unit breakdown (identical units grouped — click to expand)
| Units | Beds | Baths | Est. rent |
|---|---|---|---|
| 1× unit | 4 | 2 | $1,190 |
| 2× units | 2 | 1 | $2,036 |
| #2 | 2 | 1 | $1,018 |
| #3 | 2 | 1 | $1,018 |
| Total (3 units) | $3,225 | ||
UW: 25.0% down · 7.5% · 30yr · 1.5% tax · 5.0% vac · 8.0% maint · 8.0% mgmt
Financing live
Cash to close
- Down payment
- $75,000
- Closing costs
- $9,000
- Reserves months
- —
- Total cash needed
- —
Loan-product check · same deal, 3 products live
Conventional
25% down · 7.5% · 30yr
- Down + closing
- —
- Monthly P&I
- —
- Monthly cashflow
- —
- DSCR
- —
- Eligible?
- —
Personal DTI + credit; lowest rate.
DSCR
20% down · 8.5% · 30yr
- Down + closing
- —
- Monthly P&I
- —
- Monthly cashflow
- —
- DSCR
- —
- Eligible?
- —
No personal income docs; deal must DSCR.
Hard money
10% down · 12.0% · 12mo
- Down + closing
- —
- Monthly P&I
- —
- Monthly cashflow
- —
- DSCR
- —
- Eligible?
- —
Short-term bridge; refi at stabilization.
Listing history 19 events
-
2026-06-21days on market $300,000 Active 26 DOM
-
2026-06-21days on market $300,000 Active 25 DOM
-
2026-06-18days on market $300,000 Active 23 DOM
-
2026-06-17days on market $300,000 Active 22 DOM
-
2026-06-16days on market $300,000 Active 21 DOM
-
2026-06-15days on market $300,000 Active 20 DOM
-
2026-06-13days on market $300,000 Active 18 DOM
-
2026-06-12days on market $300,000 Active 17 DOM
-
2026-06-09days on market $300,000 Active 14 DOM
-
2026-06-08days on market $300,000 Active 13 DOM
-
2026-06-07days on market $300,000 Active 12 DOM
-
2026-06-07days on market $300,000 Active 11 DOM
-
2026-06-04days on market $300,000 Active 8 DOM
-
2026-06-02days on market $300,000 Active 7 DOM
-
2026-06-01days on market $300,000 Active 6 DOM
-
2026-05-31days on market $300,000 Active 5 DOM
-
2026-05-26$300,000 Active
-
2013-07-22soldstatus $200,000
-
2005-08-31soldstatus $99,900
ⓘ Source: listings_history table (triggers on properties + properties_extension) + one-shot
backfill from property_details.listing_events for pre-trigger history.
Tax reassessment forecast NY · Partial reset (capped growth)
- Current annual tax
- $7,549 · $629/mo
- Projected year-2 tax
- $7,549 · $629/mo
- Expected delta
- $0/yr ($0/mo · 0.0%)
ⓘ Screening estimate from a state-policy table — verify with the county assessor before closing.
Nearby sold comps map
Loading sold comps map…
Walkable amenities ~0.75 mi
Loading nearby amenities…
Taxation est. · year 1
- Rental income
- $38,700
- − Mortgage interest
- −$16,805
- − Property taxes
- −$7,549
- − Insurance
- −$1,500
- − Repairs & maintenance
- −$3,096
- − Management
- −$3,096
- − Depreciation
- −$8,727
- Taxable loss
- −$2,073
- Est. tax savings @ 24.0%
- +$498
- After-tax cash flow
- $3,143/yr
For passive investors: Depreciation is non-cash, so a rental often shows a tax loss while cash-flowing — sheltering income. Rental losses are passive: they offset passive income freely, and up to $25,000/yr can offset ordinary (W-2) income if you actively participate and your MAGI is under $100k (phasing out to $0 by $150k); unused losses carry forward. On sale, claimed depreciation is recaptured at up to 25%, and gains may owe capital-gains tax (a 1031 exchange can defer both). Figures are a year-1 estimate at your 24.0% rate — not tax advice; consult a CPA.
Schools (NCES district)
- District
- Worcester Central School District
- NCES district ID
- 3631740
- Math proficiency
- 40% ▼ -5.00%
- Reading proficiency
- 40% ▲ 5.00%
- Median HH income
- $45,846
- Composite
- 36.52/100
- National rank
- #9306
- State rank
- #642 of 755 in NY
Livability — Worcester
- Score
- 59/100
- State rank
- #1037
- US rank
- #20500
Category grades
Schools grade is shown separately in the Schools card above.
Census & demographics
- City population
- 2,275
- Population (ZIP)
- 2,275
Population outlook (Otsego County) Hauer SSP2
- Today (2025)
- 57,987 people
- By 2030
- 55,403 · -4.5%
- By 2040
- 50,336 · -13.2%
- By 2050
- 45,715 · -21.2%
- By 2075
- 38,769 · -33.1%
- By 2100
- 33,468 · -42.3%
Race, ethnicity, and origin ACS 2023
- Neighborhood character
- Predominantly White (83%)
- Race & ethnicity
- White 83% Hispanic / Latino 11% Two or more races 8%
- Hispanic origin (detail)
- Puerto Rican 3%
- Common ancestry
- Italian 4% Romanian 3% Slovak 2%
- Foreign-born
- 6% · Canada
- Languages at home
- 92% English-only · Spanish 7%
Political lean MEDSL · Otsego
- 2024 margin
- Lean R (+7.9) · D 46.1% · R 53.9%
- 2008→2024 swing
- -13.8pp toward R · 2008: 5.9pp · 2024: -7.9pp
- All cycles
- 2024: R+7.9 2020: R+5.0 2016: R+13.0 2012: D+2.0 2008: D+5.9
Not yet ingested
- Civics
- —
Market trends
- HPI YoY
- ▲ 1.88%
- Current HPI
- 341.3108
- Rent YoY
- —
- Metro
- —
- State GDP YoY
- ▲ 2.60%
- F500 in state
- 92
Industry mix (Fortune 500 HQ in NY)
| Industry | F500 HQs | Revenue |
|---|---|---|
| Financial Services | 10 | $950B |
|
||
| Consumer Goods | 9 | $162B |
|
||
| Insurance | 4 | $225B |
|
||
| Telecommunications | 2 | $144B |
|
||
| Pharmaceuticals | 2 | $112B |
|
||
| Media / Entertainment | 2 | $69B |
|
||
Price history
+200.3% since first listed3 events — show timeline
- 2026-05-26 Listed $300,000 FSBO.com
- 2013-07-22 Sold (Public Records) $200,000 Public Records
- 2005-08-31 Sold (Public Records) $99,900 Public Records
Property tax history
+2.2%/yrLatest (2025): $7,549 · +2.8% YoY. Source: county tax records.
Cash-flow waterfall
monthlySold comps — $/sqft
last 12 mo · ≤1 miLoading sold comps…