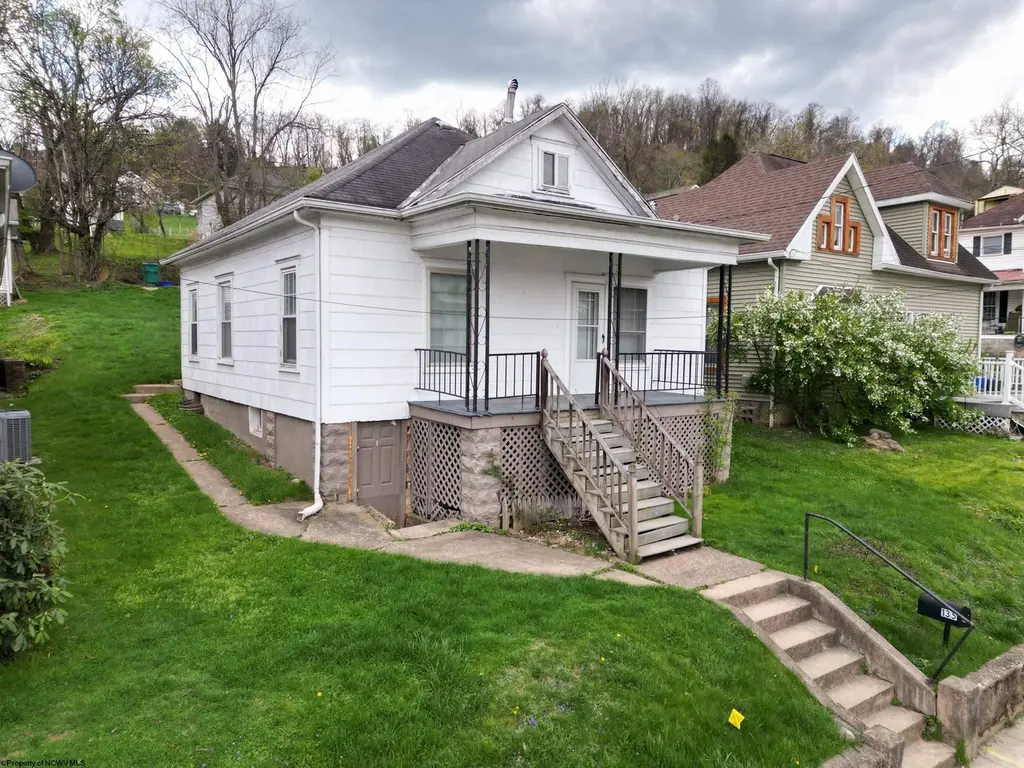
135 W Woodland Ave · Clarksburg, WV
Flood risk 4/10 · Minor
- FEMA flood zone
- X (unshaded)
- Chance of flooding over 30 yrs
- 0.22%
- Est. flood insurance / yr
- $473 – $860
Fire risk 1/10 · Minimal
- Est. fire insurance / yr
- $787 – $1,461
Heat risk 5/10 · Moderate
- Hot days now (above 98°F)
- 7 days/yr
- Hot days in 30 yrs
- 20 days/yr
Wind risk 1/10 · Minimal
- Chance of severe wind over 30 yrs
- 1.0%
Air-quality risk 2/10 · Minimal
- Unhealthy air days now
- 0 days/yr
- Unhealthy air days in 30 yrs
- 1 days/yr
Risk factors via First Street. Map © Google.
Why this score? — see what drove the D grade
The composite is a weighted blend of 9 inputs, each scored 0–100. Each bar is that input's sub-score; the figure is the points it added to the 100-point composite (weight × sub-score).
- Cash flow +19.3/30.0
- DSCR +6.1/10.0
- 1% rule +4.6/10.0
- Livability +4.0/5.0
- Rent growth +3.4/5.0
- Schools +3.0/10.0
- Condition / age +2.5/5.0
- ARV discount +0.0/15.0
- Appreciation +0.0/10.0
$114,900
🖨 Deal sheet (PDF) 📄 Offer letter ✓ Due diligence
Listing remarks
Fresh updates! This home offers a blend of character, fresh updates and is ready for its next chapter. You'll find newer flooring, fresh paint throughout and original trim that adds a touch of classic detail. Built-ins provide both charm and function creating additional storage. This property is a good option for buyers looking to step into homeownership. All measurements and square footage are approximate.
Key facts
- 4,792 sq ft lot
- Community pool
- Built 1930
Property features AI
Finance
- Financial info: Tax amount available (not included per instructions)
- HOA & community: Community amenities include golf, pool, and tennis courts
Exterior
- Parking: On-street parking
- Security: Smoke detectors
- Utilities: Public water; Public sewer; Cable available
- Home design: Single-family detached residence; One story
- Construction: Aluminum siding, block and frame construction; Shingle roof; Basement: concrete foundation
- Exterior features: Patio; Porch; Sloped lot
Interior
- Kitchen: Dishwasher; Refrigerator; Range
- Bedrooms: Total of 5 rooms (bedroom count not specified)
- Flooring: Vinyl
- Bathrooms: 1 full bathroom
- Heating & cooling: Forced air heating (natural gas); Ceiling fans; Window air conditioning units
- Interior features: Dishwasher; Refrigerator; Range; Vinyl flooring; Concrete, unfinished basement; Ceiling fans; Window cooling units; Forced air heating; Natural gas heating
- Laundry & utility: Basement available for utilities/laundry (unfinished)
Neighborhood map
What this means for you Summary
Snapshot
- This is a 3-bed/1.0-bath single-family listed at $115k.
Deal economics
- At list price, monthly cash flow is $126 ($2k/yr) — positive.
- The deal already cash-flows at list — no discount required.
- To meet the 1% rule (rent ≥ 1% of price), the offer needs to be $110k (4.1% below list).
- Recommended offer: $108k (6.0% below list) — sets the bar for market timing.
Location & tenants
- Location reads 81/100 on livability (#11 in WV, #1,521 nationally) — a professional / high-income tenant draw. Strengths: commute A+, cost of living A+, housing A+; Watch: amenities C-, crime D+, employment D-.
- Harrison County Schools (town): math 29% / reading 43% proficiency, ranked #12 of 55 in WV (top 22%) — families likely to look elsewhere, expect single-tenant / working-renter base with shorter leases.
- Zoned schools: Salem Elementary (math 52% / reading 47%, grade D, #49 of 377 statewide, top 16%, 189 students, 0% FRL); Mountaineer Middle School (math 25% / reading 37%, grade F, #55 of 109 statewide, top 51%, 361 students, 0% FRL); Robert C Byrd High School (math 22% / reading 52%, grade F, #32 of 110 statewide, top 34%, 765 students, 0% FRL) — zoned schools average 0% FRL vs 43% district-wide (43 pts lower); this property's tenant base skews higher-income than the district average.
- Market conditions: Rents rising (+3.6%/yr); 54 active listings in the ZIP; 84 units permitted in Harrison County in 2024 (5 in 5+ unit buildings).
Forward outlook
- Local home prices are declining (-3.0%/yr); year-one equity from $794 of loan paydown is wiped out by about $3k of value loss. Plan a longer hold.
- Harrison County population projected at -11% by 2050 — secular population decline; favor cash flow + early exit over multi-decade hold.
Negotiation context
- It's been on market 73 days — a 6% lower offer ($108k) is reasonable based on typical stale-listing flexibility.
- Current owner paid $15k; list at $115k implies a 666% gain — meaningful room to come down on a strong offer.
Risks & watch-outs
- Watch-outs: built in 1930 — expect roof / HVAC / electrical / plumbing capex.
- Climate carrying-cost: extreme-heat days projected 7→20/yr by 2055 (HVAC capex compounding) — expect insurance premiums to compound above CPI over the hold.
Questions for the listing agent
- It's been on market 73 days. Have you received any prior offers? Is the seller open to a 6% concession, seller financing, or rate buy-down credit?
- Built in 1930 — when were the roof, HVAC, electrical panel, plumbing, and water heater last replaced?
- Why hasn't it sold? Are there any deal-killer items the seller is aware of (foundation, flood, title, zoning, code violations)?
- Is there a deadline driving the sale (1031 exchange, divorce, estate, relocation)? That informs how much negotiation room exists.
- Schools are F-rated, which usually means shorter tenancies and higher turnover. Who's the typical renter profile here, and what's been the actual vacancy rate?
- Crime grade is D in this area — have there been break-ins, vandalism, or insurance claims at this property in the last 3 years? What carrier currently insures it and at what premium?
- The area grade is low — what's the realistic commute time and amenity access for the typical tenant pool here? Any planned neighborhood developments (good or bad) we should know about?
- What's the average days-on-market for RENTAL listings here right now (not sales)? A rising rental-DOM trend means longer vacancies and softer asking-rent achievability than the comps imply.
- What's the recent tenant-quality profile in this submarket — average credit score on applications, eviction rate, late-payment / NSF rate, and stable-employment percentage? A property-management company in the area should have these aggregated.
- How much new for-sale + rental construction is in the pipeline within 1–3 miles? Heavy new supply typically softens prices + rents 12–24 months out; constrained supply supports both.
Investment metrics
- 1% rule
- 0.96% ✗
- Cap rate
- 7.60%
- Cash-on-cash
- 4.68%
- DSCR
- 1.21
- GRM
- 8.7
CMA / ARV
- ARV (on-the-fly)
- $84,840
- Comps found
- 9
Show comp detail 9 sales within ~0.75 mi
| Address | Dist | Beds/Ba | Sqft | Sold | Price | $/sf | Match |
|---|---|---|---|---|---|---|---|
| 725 Milford St | 0.29mi | 3/1.0 | 886 (+6%) | 8mo | $57,000 | $64 | 71 |
| 328.5 Milford St | 0.39mi | 2/1.0 (-1) | 864 (+3%) | 4mo | $65,000 | $75 | 68 |
| 226 W Woodland | 0.12mi | 3/2.0 | 960 (+14%) | 11mo | $135,000 | $141 | 58 |
| 211 Liberty | 0.46mi | 2/1.0 (-1) | 768 (-9%) | 3mo | $99,000 | $129 | 57 |
| 613 Marion St | 0.14mi | 2/1.0 (-1) | 936 (+11%) | 18mo | $142,500 | $152 | 55 |
| 329 Milford St | 0.40mi | 2/1.0 (-1) | 876 (+4%) | 17mo | $88,400 | $101 | 55 |
| 309 Ryder Ave | 0.10mi | 3/1.0 | 958 (+14%) | 24mo | $89,000 | $93 | 52 |
| 219 1/2 Fairview Ave | 0.63mi | 2/1.0 (-1) | 720 (-14%) | 4mo | $56,500 | $78 | 38 |
| 685 Custer | 0.74mi | 2/1.0 (-1) | 725 (-14%) | 4mo | $110,000 | $152 | 34 |
Match score weights: distance 35% · size 25% · config 20% · recency 20%. Top-matched comps best support the ARV.
Projected returns pro-forma
-3.0% appreciation · 3.62% rent growth · sell at horizon
- IRR
- -8.4%
- Equity multiple
- 0.69×
- Total profit
- $-9,942
- Equity at exit
- $17,132
- IRR
- 1.9%
- Equity multiple
- 1.14×
- Total profit
- $4,460
- Equity at exit
- $9,934
Cash invested: $32,172 (down + closing). Projections, not guarantees.
Landlord ↔ Tenant lean methodology
- Overall (STATE)
- 83 Strongly Landlord-Friendly
- State West Virginia
- 83 Strongly Landlord-Friendly · R+22
- County
- — inherits STATE
- City
- — inherits STATE
ZIP-level market 26301
- Home prices YoY
- -26.4%
- Rents YoY
- 3.6%
- Active inventory
- 54
- Price-to-rent
- 8.7×
Monthly cashflow live
- Estimated rent
- $1,101 medium interval (Pro) →
- Mortgage (P&I)
- −$603
- Tax from tax record
- −$94 /mo · $1,129/yr
- Insurance
- −$48
- HOA
- −$0
- Vacancy / Maint / Mgmt
- −$231
- Net cashflow
- $126
Break-even live
Sensitivity live
| Price | -10% $191 | -5% $158 | +0% $126 | +5% $93 | +10% $61 |
|---|---|---|---|---|---|
| Rent | -10% $39 | -5% $82 | +0% $126 | +5% $169 | +10% $213 |
| Rate | -1.0pp $183 | -0.5pp $155 | base $126 | +0.5pp $96 | +1.0pp $66 |
UW: 25.0% down · 7.5% · 30yr · 1.5% tax · 5.0% vac · 8.0% maint · 8.0% mgmt
Financing live
Cash to close
- Down payment
- $28,725
- Closing costs
- $3,447
- Reserves months
- —
- Total cash needed
- —
Loan-product check · same deal, 3 products live
Conventional
25% down · 7.5% · 30yr
- Down + closing
- —
- Monthly P&I
- —
- Monthly cashflow
- —
- DSCR
- —
- Eligible?
- —
Personal DTI + credit; lowest rate.
DSCR
20% down · 8.5% · 30yr
- Down + closing
- —
- Monthly P&I
- —
- Monthly cashflow
- —
- DSCR
- —
- Eligible?
- —
No personal income docs; deal must DSCR.
Hard money
10% down · 12.0% · 12mo
- Down + closing
- —
- Monthly P&I
- —
- Monthly cashflow
- —
- DSCR
- —
- Eligible?
- —
Short-term bridge; refi at stabilization.
Listing history 21 events
-
2026-06-22days on market $114,900 Active 73 DOM
-
2026-06-21days on market $114,900 Active 72 DOM
-
2026-06-19days on market $114,900 Active 70 DOM
-
2026-06-18days on market $114,900 Active 69 DOM
-
2026-06-17days on market $114,900 Active 68 DOM
-
2026-06-16days on market $114,900 Active 67 DOM
-
2026-06-16price $114,900 Active 66 DOM
-
2026-06-15days on market $119,000 Active 66 DOM
-
2026-06-14days on market $119,000 Active 64 DOM
-
2026-06-12days on market $119,000 Active 63 DOM
-
2026-06-09days on market $119,000 Active 60 DOM
-
2026-06-08days on market $119,000 Active 59 DOM
-
2026-06-07days on market $119,000 Active 58 DOM
-
2026-06-05days on market $119,000 Active 55 DOM
-
2026-06-03days on market $119,000 Active 54 DOM
-
2026-06-02days on market $119,000 Active 53 DOM
-
2026-06-01days on market $119,000 Active 52 DOM
-
2026-05-31days on market $119,000 Active 51 DOM
-
2026-05-30days on market $119,000 Active 50 DOM
-
2026-04-10$119,000 Active
-
1997-07-28soldstatus $15,000
ⓘ Source: listings_history table (triggers on properties + properties_extension) + one-shot
backfill from property_details.listing_events for pre-trigger history.
Tax reassessment forecast WV · Resets to sale price
- Current annual tax
- $1,129 · $94/mo
- Projected year-2 tax
- $1,129 · $94/mo
- Expected delta
- $0/yr ($0/mo · 0.0%)
ⓘ Screening estimate from a state-policy table — verify with the county assessor before closing.
Climate risk First Street
- Flood 4/10 Moderate FEMA zone X (unshaded) · 22% chance over 30 yrs
- Wildfire 1/10 Low
- Heat 5/10 Major 7 d/yr ≥98°F today · 20 d/yr by 30 yrs out
- Wind 1/10 Low 100% chance of damaging wind over 30 yrs
- Air quality 2/10 Low 0 unhealthy d/yr today · 1 by 30 yrs out
Nearby sold comps map
Loading sold comps map…
Walkable amenities ~0.75 mi
Loading nearby amenities…
Taxation est. · year 1
- Rental income
- $13,217
- − Mortgage interest
- −$6,436
- − Property taxes
- −$1,129
- − Insurance
- −$574
- − Repairs & maintenance
- −$1,057
- − Management
- −$1,057
- − Depreciation
- −$3,343
- Taxable loss
- −$380
- Est. tax savings @ 24.0%
- +$91
- After-tax cash flow
- $1,598/yr
For passive investors: Depreciation is non-cash, so a rental often shows a tax loss while cash-flowing — sheltering income. Rental losses are passive: they offset passive income freely, and up to $25,000/yr can offset ordinary (W-2) income if you actively participate and your MAGI is under $100k (phasing out to $0 by $150k); unused losses carry forward. On sale, claimed depreciation is recaptured at up to 25%, and gains may owe capital-gains tax (a 1031 exchange can defer both). Figures are a year-1 estimate at your 24.0% rate — not tax advice; consult a CPA.
Schools (NCES district)
- District
- Harrison County Schools
- NCES district ID
- 5400510
- Math proficiency
- 29% ▼ -10.00%
- Reading proficiency
- 43% ▼ -3.00%
- Median HH income
- $43,269
- Composite
- 30.48/100
- National rank
- #6222
- State rank
- #12 of 55 in WV
Livability — Clarksburg
- Score
- 81/100
- State rank
- #11
- US rank
- #1521
Category grades
Schools grade is shown separately in the Schools card above.
Census & demographics
- Census place
- Clarksburg, WV
- County
- Harrison County · 44,316 people
- City population
- 28,716
- Metro
- Clarksburg, WV
- Population (ZIP)
- 28,716
- Household income
- $49,816
- Rent vs Own
- Severe rent burden
- 765.0
Population outlook (Harrison County) Hauer SSP2
- Today (2025)
- 67,273 people
- By 2030
- 65,963 · -1.9%
- By 2040
- 63,033 · -6.3%
- By 2050
- 59,999 · -10.8%
- By 2075
- 52,524 · -21.9%
- By 2100
- 42,654 · -36.6%
Race, ethnicity, and origin ACS 2023
- Neighborhood character
- Predominantly White (92%)
- Race & ethnicity
- White 92% Two or more races 5% Hispanic / Latino 2% Black 2%
- Common ancestry
- Slovak 2% Serbian 2% Lithuanian 1%
- Foreign-born
- 0%
- Languages at home
- 98% English-only · Other Indo-European 1%
Political lean MEDSL · Harrison
- 2024 margin
- Solid R (+41.0) · D 28.5% · R 69.4% · Other 2.1%
- 2008→2024 swing
- -27.6pp toward R · 2008: -13.3pp · 2024: -41.0pp
- All cycles
- 2024: R+41.0 2020: R+37.6 2016: R+39.5 2012: R+23.5 2008: R+13.3
Not yet ingested
- Civics
- —
Market trends
- HPI YoY
- ▼ -53.70%
- Current HPI
- 149.308
- Rent YoY
- ▲ 3.62%
- Metro
- Clarksburg, WV
- State GDP YoY
- —
- F500 in state
- 0
Price history
+693.3% since first listed2 events — show timeline
- 2026-04-10 Listed $119,000 NCWVREIN
- 1997-07-28 Sold (Public Records) $15,000 Public Records
Property tax history
+21.2%/yrLatest (2025): $1,129 · +7.1% YoY. Source: county tax records.
Cash-flow waterfall
monthlySold comps — $/sqft
last 12 mo · ≤1 miLoading sold comps…