259 Quail Run Ln · Chesterfield, SC
Flood risk 1/10 · Minimal
- FEMA flood zone
- X (unshaded)
- Chance of flooding over 30 yrs
- 0.0%
- Est. flood insurance / yr
- $507 – $1,088
Fire risk 7/10 · Major
- Est. fire insurance / yr
- $783 – $1,453
Heat risk 7/10 · Major
- Hot days now (above 109°F)
- 7 days/yr
- Hot days in 30 yrs
- 16 days/yr
Wind risk 6/10 · Moderate
- Chance of severe wind over 30 yrs
- 61.0%
Air-quality risk 2/10 · Minimal
- Unhealthy air days now
- 1 days/yr
- Unhealthy air days in 30 yrs
- 1 days/yr
Risk factors via First Street. Map © Google.
Why this score? — see what drove the B- grade
The composite is a weighted blend of 9 inputs, each scored 0–100. Each bar is that input's sub-score; the figure is the points it added to the 100-point composite (weight × sub-score).
- Cash flow +30.0/30.0
- 1% rule +10.0/10.0
- DSCR +10.0/10.0
- ARV discount +7.5/15.0
- Livability +3.3/5.0
- Rent growth +2.5/5.0
- Schools +2.5/10.0
- Condition / age +2.5/5.0
- Appreciation +0.0/10.0
$58,000
🖨 Deal sheet (PDF) 📄 Offer letter ✓ Due diligence
Listing remarks
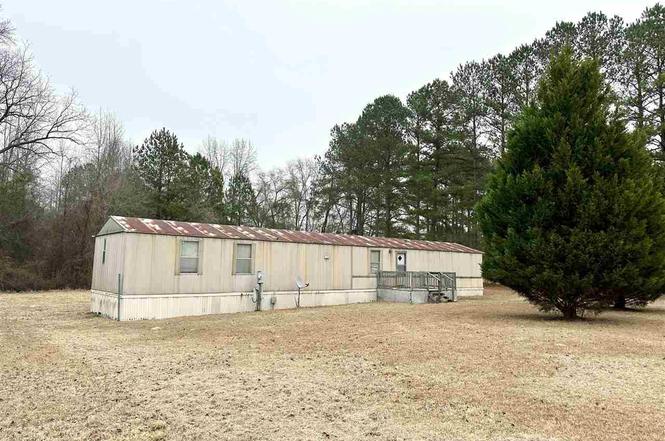
Charming Country Living with Investment Potential! This 1997 Oakwood 16x80 manufactured home offers 3 bedrooms and 2 full bathrooms, situated on a spacious 1.89-acre lot providing privacy and room to enjoy the outdoors. Located in a peaceful rural setting, the property features county water and an existing septic system, making it a great opportunity for those seeking space and convenience. The home needs some repairs but only minimal, making it an excellent option for investors, rental income, or a starter home. With plenty of room to expand, add outbuildings, or customize to your needs, this property offers great potential at an affordable price point. Enjoy quiet country living while sti
Key facts
- 1.89 acre lot
- Built 1997
- Listed 151 days
Property features AI
Finance
- Other: Lot on approximately 1.89 acres
Exterior
- Utilities: Public water; Septic tank
- Home design: Manufactured home; Residential property; 1,280 above-grade finished area
- Construction: Metal roof
- Exterior features: Deck
Interior
- Kitchen: Dishwasher
- Flooring: Carpet; Vinyl
- Bathrooms: 2 full bathrooms
- Heating & cooling: Heat pump; Fireplace insert; Central air; Ceiling fans
- Interior features: Dishwasher; Has fireplace (living room)
Neighborhood map
What this means for you Summary
Snapshot
- This is a 3-bed/2.0-bath manufactured listed at $58k.
Deal economics
- At list price, monthly cash flow is $691 ($8k/yr) — positive.
- The deal already cash-flows at list — no discount required.
- Meets the 1% rule at list price ($1k rent vs $58k).
- Recommended offer: $51k (12.0% below list) — sets the bar for market timing.
Location & tenants
- Location reads 66/100 on livability (#118 in SC) — a middle-class / working-renter tenant base. Strengths: cost of living A+, housing A+, employment B; Watch: crime F, amenities F, commute F.
- Chesterfield 01 (rural): math 25% / reading 36% proficiency, ranked #55 of 80 in SC (top 69%) — families likely to look elsewhere, expect single-tenant / working-renter base with shorter leases; 63% free/reduced lunch — lower-income household profile, screen leases tightly.
- Zoned schools: Cheraw Primary (468 students, 100% FRL); Chesterfield-Ruby Middle (math 28% / reading 34%, grade F, #128 of 229 statewide, top 58%, 414 students, 100% FRL); Cheraw High (math 42% / reading 67%, grade C-, #130 of 196 statewide, top 69%, 654 students, 100% FRL) — zoned schools average 100% FRL vs 63% district-wide (37 pts higher); higher-poverty schools than district average — tighter screening recommended.
- Zoned-school proficiency averages 43% at this address vs 30% district-wide (+12 pts) — the actual schools serving this property are materially stronger than the Chesterfield 01 average implies; a family-tenant draw the district grade alone would hide.
- Market conditions: 84 active listings in the ZIP; 145 units permitted in Chesterfield County in 2024 (10 in 5+ unit buildings).
Forward outlook
- Local home prices are declining (-3.0%/yr); year-one equity from $401 of loan paydown is wiped out by about $2k of value loss. Plan a longer hold.
- Chesterfield County population projected at -17% by 2050 — secular population decline; favor cash flow + early exit over multi-decade hold.
- At projected returns (-3.0% appreciation + 3.0% rent growth), your $16k cash investment doubles in ~3 years — after that, you're playing with house money.
Negotiation context
- It's been on market 151 days — a 12% lower offer ($51k) is reasonable based on typical stale-listing flexibility.
Risks & watch-outs
- Climate carrying-cost: major wind risk, 61% chance of damaging wind over 30y; major wildfire risk; extreme-heat days projected 7→16/yr by 2055 (HVAC capex compounding) — expect insurance premiums to compound above CPI over the hold.
Questions for the listing agent
- It's been on market 151 days. Have you received any prior offers? Is the seller open to a 12% concession, seller financing, or rate buy-down credit?
- Why hasn't it sold? Are there any deal-killer items the seller is aware of (foundation, flood, title, zoning, code violations)?
- Is there a deadline driving the sale (1031 exchange, divorce, estate, relocation)? That informs how much negotiation room exists.
- Schools are D-rated, which usually means shorter tenancies and higher turnover. Who's the typical renter profile here, and what's been the actual vacancy rate?
- Crime grade is F in this area — have there been break-ins, vandalism, or insurance claims at this property in the last 3 years? What carrier currently insures it and at what premium?
- What's the average days-on-market for RENTAL listings here right now (not sales)? A rising rental-DOM trend means longer vacancies and softer asking-rent achievability than the comps imply.
- What's the recent tenant-quality profile in this submarket — average credit score on applications, eviction rate, late-payment / NSF rate, and stable-employment percentage? A property-management company in the area should have these aggregated.
- How much new for-sale + rental construction is in the pipeline within 1–3 miles? Heavy new supply typically softens prices + rents 12–24 months out; constrained supply supports both.
Investment metrics
- 1% rule
- 2.26% ✓
- Cap rate
- 20.59%
- Cash-on-cash
- 51.05%
- DSCR
- 3.27
- GRM
- 3.7
CMA / ARV
No comps found within radius.
Projected returns pro-forma
-3.0% appreciation · 3.0% rent growth · sell at horizon
- IRR
- 48.9%
- Equity multiple
- 3.13×
- Total profit
- $34,593
- Equity at exit
- $8,648
- IRR
- 54.4%
- Equity multiple
- 6.34×
- Total profit
- $86,726
- Equity at exit
- $5,015
Cash invested: $16,240 (down + closing). Projections, not guarantees.
Landlord ↔ Tenant lean methodology
- Overall (STATE)
- 90 Strongly Landlord-Friendly
- State South Carolina
- 90 Strongly Landlord-Friendly · R+6
- County
- — inherits STATE
- City
- — inherits STATE
ZIP-level market 29520
- Home prices YoY
- -17.3%
- Active inventory
- 84
- Price-to-rent
- 3.7×
Monthly cashflow live
- Estimated rent
- $1,310 medium interval (Pro) →
- Mortgage (P&I)
- −$304
- Tax from tax record
- −$16 /mo · $188/yr
- Insurance
- −$24
- HOA
- −$0
- Vacancy / Maint / Mgmt
- −$275
- Net cashflow
- $691
Break-even live
Sensitivity live
| Price | -10% $724 | -5% $707 | +0% $691 | +5% $675 | +10% $658 |
|---|---|---|---|---|---|
| Rent | -10% $587 | -5% $639 | +0% $691 | +5% $743 | +10% $794 |
| Rate | -1.0pp $720 | -0.5pp $706 | base $691 | +0.5pp $676 | +1.0pp $661 |
UW: 25.0% down · 7.5% · 30yr · 1.5% tax · 5.0% vac · 8.0% maint · 8.0% mgmt
Financing live
Cash to close
- Down payment
- $14,500
- Closing costs
- $1,740
- Reserves months
- —
- Total cash needed
- —
Loan-product check · same deal, 3 products live
Conventional
25% down · 7.5% · 30yr
- Down + closing
- —
- Monthly P&I
- —
- Monthly cashflow
- —
- DSCR
- —
- Eligible?
- —
Personal DTI + credit; lowest rate.
DSCR
20% down · 8.5% · 30yr
- Down + closing
- —
- Monthly P&I
- —
- Monthly cashflow
- —
- DSCR
- —
- Eligible?
- —
No personal income docs; deal must DSCR.
Hard money
10% down · 12.0% · 12mo
- Down + closing
- —
- Monthly P&I
- —
- Monthly cashflow
- —
- DSCR
- —
- Eligible?
- —
Short-term bridge; refi at stabilization.
Listing history 16 events
-
2026-06-21statusdays on market $58,000 Active Under Contract 151 DOM
-
2026-06-18days on market $58,000 Active 148 DOM
-
2026-06-17days on market $58,000 Active 147 DOM
-
2026-06-16days on market $58,000 Active 146 DOM
-
2026-06-15days on market $58,000 Active 145 DOM
-
2026-06-13days on market $58,000 Active 143 DOM
-
2026-06-09days on market $58,000 Active 139 DOM
-
2026-06-08days on market $58,000 Active 138 DOM
-
2026-06-07days on market $58,000 Active 137 DOM
-
2026-06-04pricedays on market $58,000 Active 134 DOM
-
2026-06-03days on market $65,000 Active 133 DOM
-
2026-06-02days on market $65,000 Active 132 DOM
-
2026-06-01days on market $65,000 Active 131 DOM
-
2026-05-31days on market $65,000 Active 130 DOM
-
2026-04-07price $65,000
-
2026-01-21$72,000 Active
ⓘ Source: listings_history table (triggers on properties + properties_extension) + one-shot
backfill from property_details.listing_events for pre-trigger history.
Tax reassessment forecast SC · Resets to sale price
- Current annual tax
- $188 · $16/mo
- Projected year-2 tax
- $331 · $28/mo
- Expected delta
- +$143/yr (+$12/mo · 76.1%)
ⓘ Screening estimate from a state-policy table — verify with the county assessor before closing.
Climate risk First Street
- Flood 1/10 Low FEMA zone X (unshaded) · 0% chance over 30 yrs
- Wildfire 7/10 Severe
- Heat 7/10 Severe 7 d/yr ≥109°F today · 16 d/yr by 30 yrs out
- Wind 6/10 Major 61% chance of damaging wind over 30 yrs
- Air quality 2/10 Low 1 unhealthy d/yr today · 1 by 30 yrs out
Nearby sold comps map
Loading sold comps map…
Walkable amenities ~0.75 mi
Loading nearby amenities…
Taxation est. · year 1
- Rental income
- $15,720
- − Mortgage interest
- −$3,249
- − Property taxes
- −$188
- − Insurance
- −$290
- − Repairs & maintenance
- −$1,258
- − Management
- −$1,258
- − Depreciation
- −$1,687
- Taxable income
- $7,791
- Est. tax owed @ 24.0%
- −$1,870
- After-tax cash flow
- $6,421/yr
For passive investors: Depreciation is non-cash, so a rental often shows a tax loss while cash-flowing — sheltering income. Rental losses are passive: they offset passive income freely, and up to $25,000/yr can offset ordinary (W-2) income if you actively participate and your MAGI is under $100k (phasing out to $0 by $150k); unused losses carry forward. On sale, claimed depreciation is recaptured at up to 25%, and gains may owe capital-gains tax (a 1031 exchange can defer both). Figures are a year-1 estimate at your 24.0% rate — not tax advice; consult a CPA.
Schools (NCES district)
- District
- Chesterfield 01
- NCES district ID
- 4501560
- Math proficiency
- 25% ▼ -11.00%
- Reading proficiency
- 36% ▬ 0.00%
- Median HH income
- $33,946
- Composite
- 25.04/100
- National rank
- #7547
- State rank
- #55 of 80 in SC
Livability — Chesterfield
- Score
- 66/100
- State rank
- #118
- US rank
- #11810
Category grades
Schools grade is shown separately in the Schools card above.
Census & demographics
- Population (ZIP)
- 12,860
Population outlook (Chesterfield County) Hauer SSP2
- Today (2025)
- 44,632 people
- By 2030
- 43,331 · -2.9%
- By 2040
- 40,218 · -9.9%
- By 2050
- 36,847 · -17.4%
- By 2075
- 29,636 · -33.6%
- By 2100
- 23,536 · -47.3%
Race, ethnicity, and origin ACS 2023
- Neighborhood character
- Diverse neighborhood (Simpson 0.59)
- Race & ethnicity
- White 47% Black 43% Two or more races 6% Hispanic / Latino 4%
- Common ancestry
- Slovak 1% Lithuanian 1% Serbian 1%
- Foreign-born
- 3% · Canada, Guatemala
- Languages at home
- 94% English-only · Spanish 3% German/W. Germanic 1%
Political lean MEDSL · Chesterfield
- 2024 margin
- Strong R (+28.1) · D 35.5% · R 63.5% · Other 1.0%
- 2008→2024 swing
- -25.1pp toward R · 2008: -3.0pp · 2024: -28.1pp
- All cycles
- 2024: R+28.1 2020: R+20.5 2016: R+14.3 2012: R+3.3 2008: R+3.0
Not yet ingested
- Civics
- —
Market trends
- HPI YoY
- ▼ -43.46%
- Current HPI
- 207.8249
- Rent YoY
- —
- Metro
- —
- State GDP YoY
- ▲ 4.51%
- F500 in state
- 2
Industry mix (Fortune 500 HQ in SC)
| Industry | F500 HQs | Revenue |
|---|---|---|
| Packaging | 1 | $7B |
|
||
Price history
-9.7% since first listed2 events — show timeline
- 2026-04-07 Price Changed $65,000 RAGPD
- 2026-01-21 Listed $72,000 RAGPD
Property tax history
-9.9%/yrLatest (2019): $188 · +1.2% YoY. Source: county tax records.
Cash-flow waterfall
monthlySold comps — $/sqft
last 12 mo · ≤1 miLoading sold comps…