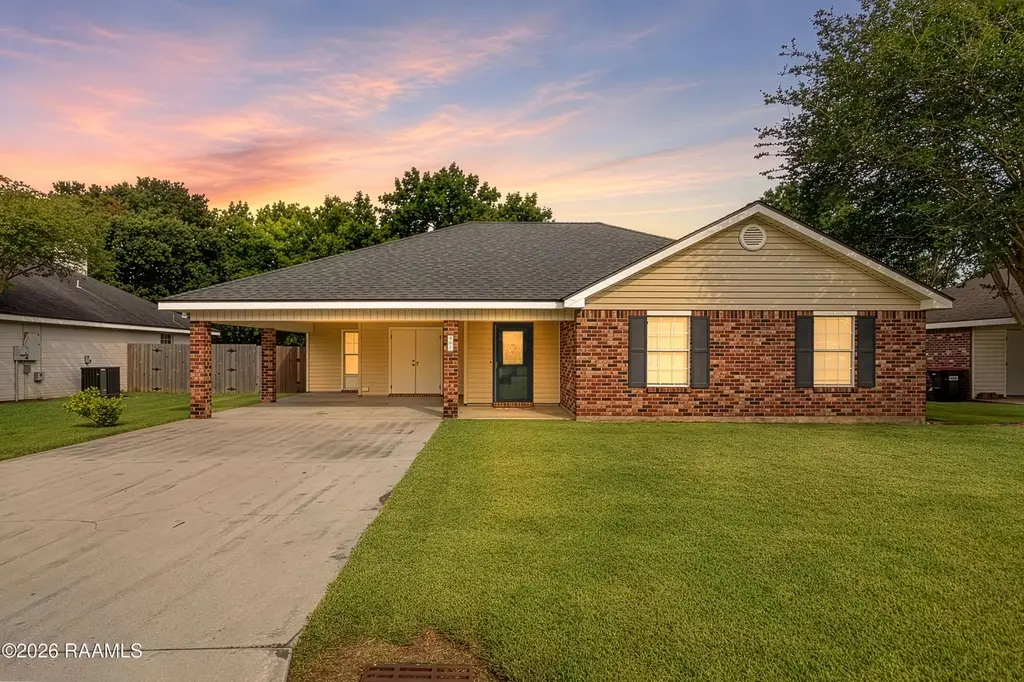
207 Belle Plaine Ave · Lafayette, LA
Flood risk 5/10 · Moderate
- FEMA flood zone
- X (shaded)
- Chance of flooding over 30 yrs
- 0.24%
- Est. flood insurance / yr
- $507 – $1,088
Fire risk 2/10 · Minimal
- Est. fire insurance / yr
- $1,269 – $2,357
Heat risk 9/10 · Severe
- Hot days now (above 108°F)
- 7 days/yr
- Hot days in 30 yrs
- 21 days/yr
Wind risk 9/10 · Severe
- Chance of severe wind over 30 yrs
- 99.0%
Air-quality risk 1/10 · Minimal
- Unhealthy air days now
- 0 days/yr
- Unhealthy air days in 30 yrs
- 0 days/yr
Risk factors via First Street. Map © Google.
Why this score? — see what drove the F grade
The composite is a weighted blend of 9 inputs, each scored 0–100. Each bar is that input's sub-score; the figure is the points it added to the 100-point composite (weight × sub-score).
- Cash flow +12.4/30.0
- DSCR +3.7/10.0
- Schools +3.6/10.0
- Rent growth +3.5/5.0
- Livability +3.5/5.0
- 1% rule +2.7/10.0
- Condition / age +2.5/5.0
- ARV discount +2.4/15.0
- Appreciation +0.0/10.0
$218,000
🖨 Deal sheet (PDF) 📄 Offer letter ✓ Due diligence
Listing remarks MLS
Under contract before listed.
Key facts
- Large backyard
- Covered patio
- New hvac system
Tags
Property features AI
Exterior
- Parking: Attached, open parking; 2 covered spaces (carport); Total 2 parking spaces
- Utilities: Public sewer; Electric service: SLEMCO
- Home design: Single family residence
- Construction: Brick veneer and vinyl siding over frame construction; Composition roof
- Exterior features: Exterior lighting; Covered porch; Storage structure
Interior
- Kitchen: Dishwasher; Disposal; Microwave; Refrigerator; Electric stove
- Flooring: Tile; Wood laminate
- Bathrooms: 2 full bathrooms
- Heating & cooling: Central air conditioning; Central electric heating
- Interior features: High ceilings with cathedral and varied ceiling heights; Walk-in pantry; Walk-in closets; Tile countertops; Window treatments and bay windows; 1 wood-burning fireplace
- Laundry & utility: Washer hookup; Electric dryer hookup
Neighborhood map
What this means for you Summary
Snapshot
- This is a 3-bed/2.0-bath single-family listed at $218k.
Deal economics
- At list price, monthly cash flow is $-35 ($-416/yr) — negative.
- To cash-flow at today's rent, offer at most $212k (2.8% below list).
- To meet the 1% rule (rent ≥ 1% of price), the offer needs to be $168k (22.8% below list).
- Recommended offer: $168k (22.8% below list) — sets the bar for 1% rule.
- Cap rate 6.1% vs local median 4.7% in Lafayette — meaningfully above typical; check what's discounted (condition, days-on-market, listing class) to confirm the premium yield is real.
Location & tenants
- Location reads 70/100 on livability (#63 in LA) — a middle-class / working-renter tenant base. Strengths: cost of living A+, housing A+, health & safety A+; Watch: amenities C-, employment C-, crime F.
- Lafayette Parish (urban): math 38% / reading 46% proficiency, ranked #19 of 98 in LA (top 19%) — families likely to look elsewhere, expect single-tenant / working-renter base with shorter leases.
- Zoned schools: Ridge Elementary School (math 40% / reading 52%, grade D-, #164 of 646 statewide, top 26%, 695 students, 62% FRL); Judice Middle School (math 26% / reading 36%, grade F, #110 of 218 statewide, top 51%, 463 students, 61% FRL); Acadiana High School (math 31% / reading 29%, grade F, #125 of 265 statewide, top 47%, 1,813 students, 56% FRL) — zoned schools at 60% FRL track the district average.
- Market conditions: Rents rising fast (+4.1%/yr); 404 active listings in the ZIP; 3 comparable units currently listed for rent nearby; rentals lingering (median 44d on market — plan ~5-8 weeks vacancy on turnover, expect pricing pressure); 67% of comp listings sitting > 30 days — soft ceiling on asking rent; 1,585 units permitted in Lafayette Parish in 2024 (10 in 5+ unit buildings).
- This rent runs 35% of the median local income ($57k/yr) — at the standard rent-burdened threshold; future hikes will face affordability resistance.
Forward outlook
- Local home prices are declining (-3.0%/yr); year-one equity from $2k of loan paydown is wiped out by about $7k of value loss. Plan a longer hold.
- Lafayette County population projected at +34% by 2050 — long-run rental-demand tailwind backs the buy-and-hold thesis.
Negotiation context
- It's been on market 15 days — a 2% lower offer ($215k) is reasonable based on typical stale-listing flexibility.
- 5 sale attempts since 28y ago with the ask held roughly flat each time — persistent listings suggest the price (not the market) is what's stuck; bring a comps-based counter.
Risks & watch-outs
- Climate carrying-cost: moderate flood risk; severe wind risk, 99% chance of damaging wind over 30y; extreme-heat days projected 7→21/yr by 2055 (HVAC capex compounding) — expect insurance premiums to compound above CPI over the hold.
Questions for the listing agent
- What do current leases actually rent for vs. the listed asking? Can we see a recent rent roll and the last 12 months of T-12 income?
- Is there a deadline driving the sale (1031 exchange, divorce, estate, relocation)? That informs how much negotiation room exists.
- Schools are B-rated — typically a magnet for longer-tenancy family renters. What's the average tenant stay here, and is there a school-zone premium baked into asking?
- Crime grade is F in this area — have there been break-ins, vandalism, or insurance claims at this property in the last 3 years? What carrier currently insures it and at what premium?
- The area grade is low — what's the realistic commute time and amenity access for the typical tenant pool here? Any planned neighborhood developments (good or bad) we should know about?
- What's the average days-on-market for RENTAL listings here right now (not sales)? A rising rental-DOM trend means longer vacancies and softer asking-rent achievability than the comps imply.
- What's the recent tenant-quality profile in this submarket — average credit score on applications, eviction rate, late-payment / NSF rate, and stable-employment percentage? A property-management company in the area should have these aggregated.
- How much new for-sale + rental construction is in the pipeline within 1–3 miles? Heavy new supply typically softens prices + rents 12–24 months out; constrained supply supports both.
Investment metrics
- 1% rule
- 0.77% ✗
- Cap rate
- 6.10%
- Cash-on-cash
- -0.68%
- DSCR
- 0.97
- GRM
- 10.8
CMA / ARV
- ARV (on-the-fly)
- $195,818
- Comps found
- 12
Show comp detail 12 sales within ~0.75 mi
| Address | Dist | Beds/Ba | Sqft | Sold | Price | $/sf | Match |
|---|---|---|---|---|---|---|---|
| 214 Belle Plaine Ave | 0.06mi | 3/2.0 | 1,370 (-1%) | 13mo | $212,500 | $155 | 86 |
| 119 Chicory Ln | 0.16mi | 3/2.0 | 1,506 (+9%) | 6mo | $218,000 | $145 | 72 |
| 206 Belle Plaine Ave | 0.03mi | 3/2.0 | 1,537 (+12%) | 9mo | $218,000 | $142 | 72 |
| 201 Belle Plaine Ave | 0.04mi | 3/2.0 | 1,475 (+7%) | 19mo | $210,000 | $142 | 71 |
| 216 Belle Plaine Ave | 0.07mi | 3/2.0 | 1,539 (+12%) | 10mo | $218,000 | $142 | 69 |
| 109 Cheshire Cir | 0.60mi | 3/2.0 | 1,457 (+6%) | 6mo | $165,000 | $113 | 58 |
| 147 Topping Rd | 0.40mi | 3/2.0 | 1,555 (+13%) | 9mo | $340,000 | $219 | 52 |
| 211 Dartmoor Dr | 0.51mi | 3/2.0 | 1,510 (+10%) | 11mo | $205,000 | $136 | 51 |
| 410 Lancaster Dr | 0.62mi | 3/2.0 | 1,570 (+14%) | 7mo | $213,500 | $136 | 42 |
| 104 Kettering Cir | 0.55mi | 3/2.0 | 1,574 (+14%) | 12mo | $212,000 | $135 | 40 |
| 119 Opus Ln | 0.63mi | 3/2.0 | 1,568 (+14%) | 11mo | $199,999 | $128 | 38 |
| 502 Lancaster Dr | 0.69mi | 3/2.0 | 1,549 (+12%) | 17mo | $170,000 | $110 | 33 |
Match score weights: distance 35% · size 25% · config 20% · recency 20%. Top-matched comps best support the ARV.
Projected returns pro-forma
-3.0% appreciation · 4.12% rent growth · sell at horizon
- IRR
- -16.3%
- Equity multiple
- 0.42×
- Total profit
- $-35,678
- Equity at exit
- $32,505
- IRR
- -6.4%
- Equity multiple
- 0.57×
- Total profit
- $-26,111
- Equity at exit
- $18,849
Cash invested: $61,040 (down + closing). Projections, not guarantees.
Landlord ↔ Tenant lean methodology
- Overall (STATE)
- 90 Strongly Landlord-Friendly
- State Louisiana
- 90 Strongly Landlord-Friendly · R+12
- County
- — inherits STATE
- City
- — inherits STATE
ZIP-level market 70506
- Home prices YoY
- -34.8%
- Rents YoY
- 4.1%
- Active inventory
- 404
- Price-to-rent
- 10.8×
Monthly cashflow live
- Estimated rent
- $1,683 medium interval (Pro) →
- Mortgage (P&I)
- −$1,143
- Tax from tax record
- −$130 /mo · $1,565/yr
- Insurance
- −$91
- HOA
- −$0
- Vacancy / Maint / Mgmt
- −$353
- Net cashflow
- $-35
Break-even live
Sensitivity live
| Price | -10% $89 | -5% $27 | +0% $-35 | +5% $-96 | +10% $-158 |
|---|---|---|---|---|---|
| Rent | -10% $-168 | -5% $-101 | +0% $-35 | +5% $32 | +10% $98 |
| Rate | -1.0pp $75 | -0.5pp $21 | base $-35 | +0.5pp $-91 | +1.0pp $-149 |
UW: 25.0% down · 7.5% · 30yr · 1.5% tax · 5.0% vac · 8.0% maint · 8.0% mgmt
Financing live
Cash to close
- Down payment
- $54,500
- Closing costs
- $6,540
- Reserves months
- —
- Total cash needed
- —
Loan-product check · same deal, 3 products live
Conventional
25% down · 7.5% · 30yr
- Down + closing
- —
- Monthly P&I
- —
- Monthly cashflow
- —
- DSCR
- —
- Eligible?
- —
Personal DTI + credit; lowest rate.
DSCR
20% down · 8.5% · 30yr
- Down + closing
- —
- Monthly P&I
- —
- Monthly cashflow
- —
- DSCR
- —
- Eligible?
- —
No personal income docs; deal must DSCR.
Hard money
10% down · 12.0% · 12mo
- Down + closing
- —
- Monthly P&I
- —
- Monthly cashflow
- —
- DSCR
- —
- Eligible?
- —
Short-term bridge; refi at stabilization.
Rent comps 3 comps
| Address | Beds | Baths | Sqft | Rent | $/sqft | DOM | Units | Dist |
|---|---|---|---|---|---|---|---|---|
| 600 Glade Blvd Lafayette, LA | 3.0 | 2.0 | 1617 | $1,695 | $1.05 | 14d | 1 | 1.09mi |
| 225 Shadowbrush Bnd Lafayette, LA | 3.0 | 2.0 | 1585 | $1,700 | $1.07 | 44d | 1 | 1.13mi |
| 127 Allister Rd Maurice, LA | 4.0 | 2.0 | 1803 | $1,575 | $0.87 | 44d | 1 | 1.17mi |
Listing history 12 events
-
2026-06-18days on market $218,000 Active 15 DOM
-
2026-06-17days on market $218,000 Active 14 DOM
-
2026-06-16days on market $218,000 Active 13 DOM
-
2026-06-15days on market $218,000 Active 12 DOM
-
2026-06-14days on market $218,000 Active 10 DOM
-
2026-06-13days on market $218,000 Active 9 DOM
-
2026-06-10days on market $218,000 Active 7 DOM
-
2026-06-09days on market $218,000 Active 6 DOM
-
2026-06-08days on market $218,000 Active 5 DOM
-
2026-06-07days on market $218,000 Active 4 DOM
-
2026-06-03remarks 699-char remark
-
2026-06-03$218,000 Active 1 DOM
ⓘ Source: listings_history table (triggers on properties + properties_extension) + one-shot
backfill from property_details.listing_events for pre-trigger history.
Tax reassessment forecast LA · Resets to sale price
- Current annual tax
- $1,565 · $130/mo
- Projected year-2 tax
- $1,565 · $130/mo
- Expected delta
- $0/yr ($0/mo · 0.0%)
ⓘ Screening estimate from a state-policy table — verify with the county assessor before closing.
Climate risk First Street
- Flood 5/10 Major FEMA zone X (shaded) · 24% chance over 30 yrs
- Wildfire 2/10 Low
- Heat 9/10 Extreme 7 d/yr ≥108°F today · 21 d/yr by 30 yrs out
- Wind 9/10 Extreme 99% chance of damaging wind over 30 yrs
- Air quality 1/10 Low 0 unhealthy d/yr today · 0 by 30 yrs out
Nearby sold comps map
Loading sold comps map…
Walkable amenities ~0.75 mi
Loading nearby amenities…
Taxation est. · year 1
- Rental income
- $20,199
- − Mortgage interest
- −$12,211
- − Property taxes
- −$1,565
- − Insurance
- −$1,090
- − Repairs & maintenance
- −$1,616
- − Management
- −$1,616
- − Depreciation
- −$6,342
- Taxable loss
- −$4,241
- Est. tax savings @ 24.0%
- +$1,018
- After-tax cash flow
- $602/yr
For passive investors: Depreciation is non-cash, so a rental often shows a tax loss while cash-flowing — sheltering income. Rental losses are passive: they offset passive income freely, and up to $25,000/yr can offset ordinary (W-2) income if you actively participate and your MAGI is under $100k (phasing out to $0 by $150k); unused losses carry forward. On sale, claimed depreciation is recaptured at up to 25%, and gains may owe capital-gains tax (a 1031 exchange can defer both). Figures are a year-1 estimate at your 24.0% rate — not tax advice; consult a CPA.
Schools (NCES district)
- District
- Lafayette Parish
- NCES district ID
- 2200870
- Math proficiency
- 38% ▼ -32.00%
- Reading proficiency
- 46% ▼ -24.00%
- Median HH income
- $50,238
- Composite
- 36.15/100
- National rank
- #4741
- State rank
- #19 of 98 in LA
Livability — Lafayette
- Score
- 70/100
- State rank
- #63
- US rank
- #8133
Category grades
Schools grade is shown separately in the Schools card above.
Census & demographics
- County
- Lafayette Parish · 207,544 people
- City population
- 158,114
- Metro
- Lafayette, LA
- Population (ZIP)
- 42,318
- Household income
- $57,379
- Rent vs Own
- Severe rent burden
- 2095.0
Population outlook (Lafayette County) Hauer SSP2
- Today (2025)
- 280,930 people
- By 2030
- 301,092 · +7.2%
- By 2040
- 339,456 · +20.8%
- By 2050
- 375,156 · +33.5%
- By 2075
- 451,672 · +60.8%
- By 2100
- 497,203 · +77.0%
Race, ethnicity, and origin ACS 2023
- Neighborhood character
- Diverse neighborhood (Simpson 0.58)
- Race & ethnicity
- White 60% Black 20% Hispanic / Latino 13% Two or more races 13% Asian 3%
- Hispanic origin (detail)
- Mexican 4%
- Common ancestry
- Lithuanian 18% Armenian 1% Slovak 1%
- Foreign-born
- 12% · Canada, Vietnam
- Languages at home
- 83% English-only · Spanish 9% French/Haitian/Cajun 3% Vietnamese 1%
Political lean MEDSL · Lafayette
- 2024 margin
- Solid R (+31.4) · D 33.5% · R 64.8% · Other 1.7%
- 2008→2024 swing
- -0.1pp no change · 2008: -31.3pp · 2024: -31.4pp
- All cycles
- 2024: R+31.4 2020: R+28.7 2016: R+33.6 2012: R+33.7 2008: R+31.3
Not yet ingested
- Civics
- —
Market trends
- HPI YoY
- ▼ -75.28%
- Current HPI
- 140.8445
- Rent YoY
- ▲ 4.12%
- Metro
- Lafayette, LA
- State GDP YoY
- ▲ 3.29%
- F500 in state
- 10
Industry mix (Fortune 500 HQ in LA)
| Industry | F500 HQs | Revenue |
|---|---|---|
| Telecommunications | 2 | $23B |
|
||
| Utilities | 1 | $12B |
|
||
| Wholesale / Distribution | 1 | $5B |
|
||
| Advertising | 1 | $2B |
|
||
Price history
+126.4% since first listed10 events — show timeline
- 2026-06-03 Listed $218,000 AcadianaMLS
- 2022-07-26 Sold (Public Records) $190,000 Public Records
- 2022-07-26 Listed $190,000 AcadianaMLS
- 2022-07-26 Sold (MLS) $190,000 AcadianaMLS
- 2004-06-25 Sold (MLS) $119,500 AcadianaMLS
- 2004-05-19 Listed $119,500 AcadianaMLS
- 2001-11-26 Sold (MLS) $105,000 AcadianaMLS
- 2001-08-06 Listed $106,500 AcadianaMLS
- 1998-09-09 Sold (MLS) $96,300 AcadianaMLS
- 1998-04-09 Listed $96,300 AcadianaMLS
Property tax history
+3.3%/yrLatest (2025): $1,565 · -1.3% YoY. Source: county tax records.
Cash-flow waterfall
monthlySold comps — $/sqft
last 12 mo · ≤1 miLoading sold comps…