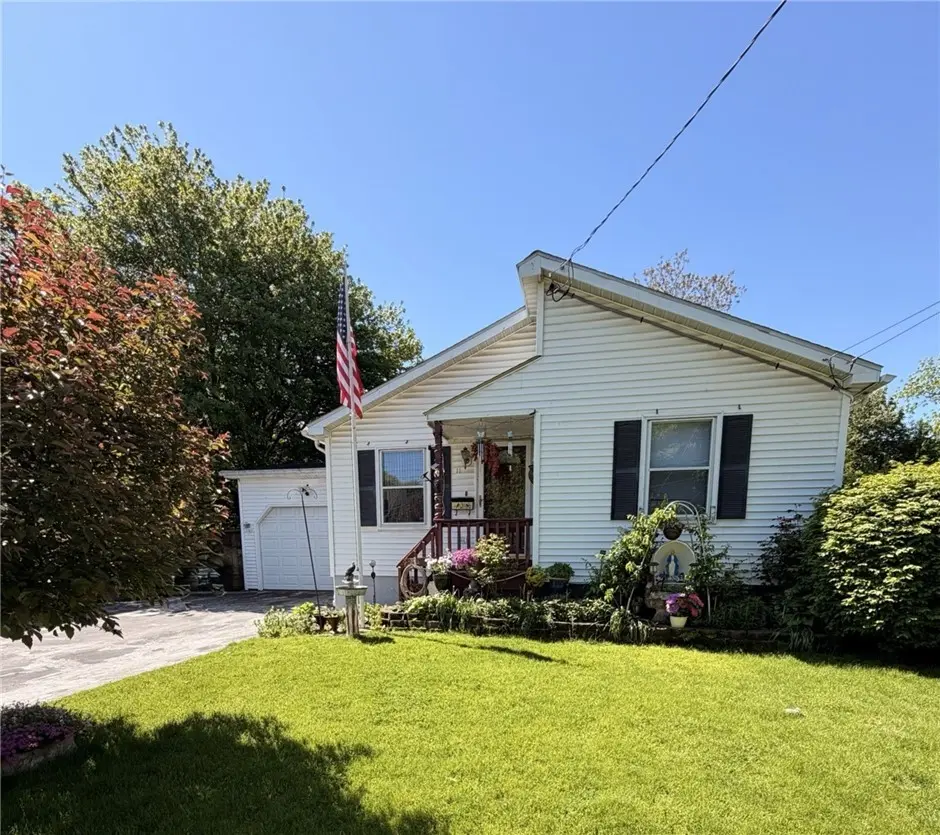
11 Alice St · Rochester, NY
Flood risk 5/10 · Moderate
- FEMA flood zone
- X (unshaded)
- Chance of flooding over 30 yrs
- 0.52%
- Est. flood insurance / yr
- $473 – $860
Fire risk 1/10 · Minimal
- Est. fire insurance / yr
- $691 – $1,283
Heat risk 2/10 · Minimal
- Hot days now (above 96°F)
- 7 days/yr
- Hot days in 30 yrs
- 15 days/yr
Wind risk 1/10 · Minimal
- Chance of severe wind over 30 yrs
- —
Air-quality risk 2/10 · Minimal
- Unhealthy air days now
- 1 days/yr
- Unhealthy air days in 30 yrs
- 2 days/yr
Risk factors via First Street. Map © Google.
Why this score? — see what drove the B grade
The composite is a weighted blend of 9 inputs, each scored 0–100. Each bar is that input's sub-score; the figure is the points it added to the 100-point composite (weight × sub-score).
- Cash flow +30.0/30.0
- DSCR +10.0/10.0
- 1% rule +7.6/10.0
- ARV discount +6.6/15.0
- Rent growth +4.1/5.0
- Livability +3.8/5.0
- Appreciation +3.5/10.0
- Condition / age +2.5/5.0
- Schools +1.9/10.0
$119,777
🖨 Deal sheet (PDF) 📄 Offer letter ✓ Due diligence
Listing remarks
Welcome home! Rarely available, beautiful and cozy 2 bedroom ranch in the city built in the 90's! Upon entry you will find a very spacious living room with laminate flooring and natural light. Through the living room is a galley kitchen with solid surface countertops and space for an eat in table with a cute storage nook that can easily become an open pantry. 2 very generously sized bedrooms with wall to wall carpet and a big and bright bathroom with a full tub surround round out the first floor. In the basement you will find 3 separate fully finished rooms perfect for extra living space, a rec room and more along with a second full bathroom! Laundry and storage room are spacious and dry. C
Key facts
- Galley kitchen
- Rec room
- Fully finished rooms
Tags
Property features AI
Exterior
- Parking: Attached garage; 1 garage space
- Utilities: Cable available; Public water connected; Sewer connected; Circuit breaker electric
- Home design: Single-story home; Existing construction
- Construction: Asphalt roof; Vinyl siding; Copper plumbing; Block foundation; Finished basement (below-grade finished area)
- Exterior features: Blacktop driveway; Patio; Near public transit; Rectangular residential lot; City street frontage
Interior
- Kitchen: Electric oven; Electric range; Microwave; Range hood; Refrigerator; Exhaust fan
- Bedrooms: 2 bedrooms on the main level; Convertible bedroom (could serve other uses)
- Flooring: Carpet; Laminate; Tile; Varies
- Bathrooms: 2 full bathrooms; 1 bathroom on the main level
- Heating & cooling: Gas heating; Forced air
- Interior features: Ceiling fan(s); Eat-in kitchen; Separate/formal living room; Solid surface counters; Convertible bedroom; Thermal windows
- Laundry & utility: Laundry in basement; Gas water heater
Neighborhood map
What this means for you Summary
Snapshot
- This is a 2-bed/1.0-bath single-family listed at $120k.
Deal economics
- At list price, monthly cash flow is $458 ($5k/yr) — positive.
- The deal already cash-flows at list — no discount required.
- Meets the 1% rule at list price ($2k rent vs $120k).
Location & tenants
- Location reads 76/100 on livability (#222 in NY, #3,482 nationally) — a middle-class / working-renter tenant base. Strengths: commute A+, cost of living A+, housing A+; Watch: schools D+, crime F, employment F.
- Rochester City School District (urban): math 21% / reading 26% proficiency, ranked #589 of 590 in NY (top 100%) — low school quality limits family demand, transient renter base, plan for 1-2y turnover; 82% free/reduced lunch — lower-income household profile, screen leases tightly.
- Market conditions: Rents rising fast (+6.4%/yr); 78 active listings in the ZIP; 21 comparable units currently listed for rent nearby; rentals at typical pace (median 21d on market — plan ~3-4 weeks tenant-placement turnaround); lower-income renter base — watch delinquency; 1,169 units permitted in Monroe County in 2024 (591 in 5+ unit buildings).
- At $1,512/mo this rent would consume 58% of the median local household income ($31k/yr) (locally 2168% of renters already pay >50% of income on rent) — very limited rent-growth headroom before tenants either downsize or default.
Forward outlook
- Local home prices are declining (-2.9%/yr); year-one equity from $828 of loan paydown is wiped out by about $4k of value loss. Plan a longer hold.
- Monroe County population projected to shrink 6% by 2050 — rents likely to lag national; underwrite the cash flow, not the appreciation.
- At projected returns (-2.9% appreciation + 6.4% rent growth), your $34k cash investment doubles in ~6 years — after that, you're playing with house money.
Negotiation context
- Only 7 days on market — expect competitive offers; lowballing is unlikely to land.
- Current owner paid $43k; list at $120k implies a 179% gain — meaningful room to come down on a strong offer.
Risks & watch-outs
- Climate carrying-cost: moderate flood risk — expect insurance premiums to compound above CPI over the hold.
Questions for the listing agent
- Is there a deadline driving the sale (1031 exchange, divorce, estate, relocation)? That informs how much negotiation room exists.
- Schools are D-rated, which usually means shorter tenancies and higher turnover. Who's the typical renter profile here, and what's been the actual vacancy rate?
- Crime grade is F in this area — have there been break-ins, vandalism, or insurance claims at this property in the last 3 years? What carrier currently insures it and at what premium?
- What's the average days-on-market for RENTAL listings here right now (not sales)? A rising rental-DOM trend means longer vacancies and softer asking-rent achievability than the comps imply.
- What's the recent tenant-quality profile in this submarket — average credit score on applications, eviction rate, late-payment / NSF rate, and stable-employment percentage? A property-management company in the area should have these aggregated.
- How much new for-sale + rental construction is in the pipeline within 1–3 miles? Heavy new supply typically softens prices + rents 12–24 months out; constrained supply supports both.
Investment metrics
- 1% rule
- 1.26% ✓
- Cap rate
- 10.88%
- Cash-on-cash
- 16.39%
- DSCR
- 1.73
- GRM
- 6.6
CMA / ARV
- ARV (on-the-fly)
- $117,460
- Comps found
- 12
Show comp detail 12 sales within ~0.75 mi
| Address | Dist | Beds/Ba | Sqft | Sold | Price | $/sf | Match |
|---|---|---|---|---|---|---|---|
| 1145 Maple St | 0.24mi | 3/1.0 (+1) | 1,572 (-6%) | 5mo | $163,000 | $104 | 69 |
| 760 Jay St | 0.71mi | 2/2.0 | 1,684 (+0%) | 2mo | $29,900 | $18 | 61 |
| 71 Lorenzo St | 0.46mi | 3/1.0 (+1) | 1,544 (-8%) | 6mo | $70,000 | $45 | 55 |
| 457 Mount Read Blvd | 0.57mi | 3/1.5 (+1) | 1,811 (+8%) | 7mo | $175,000 | $97 | 48 |
| 77 Post Ave | 0.64mi | 3/2.0 (+1) | 1,601 (-5%) | 8mo | $215,000 | $134 | 47 |
| 51 Salina St | 0.53mi | 3/1.5 (+1) | 1,821 (+8%) | 8mo | $128,000 | $70 | 47 |
| 22 Lisbon St | 0.57mi | 3/1.5 (+1) | 1,488 (-11%) | 6mo | $125,500 | $84 | 43 |
| 249 Lincoln Ave | 0.63mi | 3/1.5 (+1) | 1,492 (-11%) | 4mo | $103,000 | $69 | 42 |
| 588 Mount Read Blvd | 0.71mi | 3/2.0 (+1) | 1,786 (+6%) | 9mo | $109,900 | $62 | 40 |
| 7 Rugraff St | 0.74mi | 3/1.0 (+1) | 1,487 (-11%) | 2mo | $78,000 | $52 | 40 |
| 38 Cedar St | 0.52mi | 3/1.0 (+1) | 1,429 (-15%) | 8mo | $75,000 | $52 | 39 |
| 59 Devonshire Ct | 0.73mi | 3/1.5 (+1) | 1,483 (-12%) | 8mo | $169,900 | $115 | 33 |
Match score weights: distance 35% · size 25% · config 20% · recency 20%. Top-matched comps best support the ARV.
Projected returns pro-forma
-2.93% appreciation · 6.37% rent growth · sell at horizon
- IRR
- 11.1%
- Equity multiple
- 1.46×
- Total profit
- $15,374
- Equity at exit
- $18,225
- IRR
- 22.4%
- Equity multiple
- 3.22×
- Total profit
- $74,420
- Equity at exit
- $10,986
Cash invested: $33,538 (down + closing). Projections, not guarantees.
Landlord ↔ Tenant lean methodology
- Overall (STATE)
- 15 Strongly Tenant-Friendly
- State New York
- 15 Strongly Tenant-Friendly · D+10
- County
- — inherits STATE
- City
- — inherits STATE
ZIP-level market 14611
- Home prices YoY
- -1.1%
- Rents YoY
- 6.4%
- Active inventory
- 78
- Price-to-rent
- 6.6×
Monthly cashflow live
- Estimated rent
- $1,512 high interval (Pro) →
- Mortgage (P&I)
- −$628
- Tax from tax record
- −$59 /mo · $702/yr
- Insurance
- −$50
- HOA
- −$0
- Vacancy / Maint / Mgmt
- −$318
- Net cashflow
- $458
Break-even live
Sensitivity live
| Price | -10% $526 | -5% $492 | +0% $458 | +5% $424 | +10% $390 |
|---|---|---|---|---|---|
| Rent | -10% $339 | -5% $398 | +0% $458 | +5% $518 | +10% $577 |
| Rate | -1.0pp $518 | -0.5pp $488 | base $458 | +0.5pp $427 | +1.0pp $395 |
UW: 25.0% down · 7.5% · 30yr · 1.5% tax · 5.0% vac · 8.0% maint · 8.0% mgmt
Financing live
Cash to close
- Down payment
- $29,944
- Closing costs
- $3,593
- Reserves months
- —
- Total cash needed
- —
Loan-product check · same deal, 3 products live
Conventional
25% down · 7.5% · 30yr
- Down + closing
- —
- Monthly P&I
- —
- Monthly cashflow
- —
- DSCR
- —
- Eligible?
- —
Personal DTI + credit; lowest rate.
DSCR
20% down · 8.5% · 30yr
- Down + closing
- —
- Monthly P&I
- —
- Monthly cashflow
- —
- DSCR
- —
- Eligible?
- —
No personal income docs; deal must DSCR.
Hard money
10% down · 12.0% · 12mo
- Down + closing
- —
- Monthly P&I
- —
- Monthly cashflow
- —
- DSCR
- —
- Eligible?
- —
Short-term bridge; refi at stabilization.
Rent comps 21 comps
| Address | Beds | Baths | Sqft | Rent | $/sqft | DOM | Units | Dist |
|---|---|---|---|---|---|---|---|---|
| 802 Maple St Rochester, NY | 2.0 | 1.5 | 1080 | $1,800 | $1.67 | 45d | 1 | 0.33mi |
| 257 Hague St Unit 257 Rochester, NY | 2.0 | 1.5 | 1080 | $1,500 | $1.39 | 45d | 1 | 0.37mi |
| 136 Garfield St Rochester, NY | 3.0 | 1.0 | 1152 | $1,200 | $1.04 | 20d | 1 | 0.41mi |
| 19 Garland Ave Rochester, NY | 3.0 | 1.0 | 1104 | $1,850 | $1.68 | 4d | 1 | 0.53mi |
| 385 Ames St Rochester, NY | 3.0 | 1.5 | 1738 | $1,500 | $0.86 | 22d | 1 | 0.56mi |
| 108 Wetmore Park Rochester, NY | 3.0 | 2.0 | 1278 | $1,900 | $1.49 | 11d | 1 | 0.63mi |
| 32 Stanton St Rochester, NY | 3.0 | 1.0 | 1390 | $1,500 | $1.08 | 11d | 1 | 0.68mi |
| 710-712 Jay St Unit 3 Rochester, NY | 2.0 | 1.0 | 1252 | $895 | $0.71 | 45d | 1 | 0.81mi |
| 190 Warwick Ave Rochester, NY | 3.0 | 1.5 | 1240 | $1,400 | $1.13 | 45d | 1 | 0.82mi |
| 629 Jay St Rochester, NY | 3.0 | 1.0 | 1193 | $1,250 | $1.05 | 20d | 1 | 0.90mi |
| 87 McNaughton St Unit 87 Rochester, NY | 2.0 | 1.0 | 1929 | $1,300 | $0.67 | 15d | 1 | 0.94mi |
| 132 Anthony St Rochester, NY | 3.0 | 1.0 | 1260 | $1,500 | $1.19 | 4d | 1 | 1.11mi |
| 85 Cameron St Unit B Rochester, NY | 3.0 | 1.0 | 1138 | $1,650 | $1.45 | 45d | 1 | 1.14mi |
| 69 Angle St Rochester, NY | 2.0 | 1.0 | 1500 | $1,500 | $1.00 | 15d | 1 | 1.17mi |
| 30 Flanders St Rochester, NY | 3.0 | 1.5 | 1170 | $1,650 | $1.41 | 15d | 1 | 1.21mi |
| 25 Karnes St Rochester, NY | 2.0 | 1.0 | 1059 | $1,250 | $1.18 | 22d | 1 | 1.27mi |
| 478 Tremont St Rochester, NY | 3.0 | 2.0 | 1424 | $1,500 | $1.05 | 45d | 1 | 1.29mi |
| 485 Sawyer St Rochester, NY | 3.0 | 1.0 | 1400 | $1,900 | $1.36 | 4d | 1 | 1.29mi |
| 485 Sawyer St Unit 1 Rochester, NY | 3.0 | 1.0 | 1400 | $1,900 | $1.36 | 45d | 1 | 1.29mi |
| 192 Bartlett St Unit 192 Rochester, NY | 3.0 | 1.0 | 1099 | $1,295 | $1.18 | 15d | 1 | 1.30mi |
| 193 Reynolds St Rochester, NY | 3.0 | 1.5 | 1342 | $1,800 | $1.34 | 22d | 1 | 1.46mi |
Listing history 7 events
-
2026-06-05statusdays on market $119,777 Pending 7 DOM
-
2026-06-03days on market $119,777 Active 6 DOM
-
2026-06-03days on market $119,777 Active 5 DOM
-
2026-06-01days on market $119,777 Active 4 DOM
-
2026-05-31days on market $119,777 Active 3 DOM
-
2026-05-28$119,777 Active
-
2010-01-25soldstatus $43,000
ⓘ Source: listings_history table (triggers on properties + properties_extension) + one-shot
backfill from property_details.listing_events for pre-trigger history.
Tax reassessment forecast NY · Partial reset (capped growth)
- Current annual tax
- $702 · $59/mo
- Projected year-2 tax
- $1,363 · $114/mo
- Expected delta
- +$661/yr (+$55/mo · 94.2%)
ⓘ Screening estimate from a state-policy table — verify with the county assessor before closing.
Climate risk First Street
- Flood 5/10 Major FEMA zone X (unshaded) · 52% chance over 30 yrs
- Wildfire 1/10 Low
- Heat 2/10 Low 7 d/yr ≥96°F today · 15 d/yr by 30 yrs out
- Wind 1/10 Low
- Air quality 2/10 Low 1 unhealthy d/yr today · 2 by 30 yrs out
Nearby sold comps map
Loading sold comps map…
Walkable amenities ~0.75 mi
Loading nearby amenities…
Taxation est. · year 1
- Rental income
- $18,145
- − Mortgage interest
- −$6,709
- − Property taxes
- −$702
- − Insurance
- −$599
- − Repairs & maintenance
- −$1,452
- − Management
- −$1,452
- − Depreciation
- −$3,484
- Taxable income
- $3,747
- Est. tax owed @ 24.0%
- −$899
- After-tax cash flow
- $4,597/yr
For passive investors: Depreciation is non-cash, so a rental often shows a tax loss while cash-flowing — sheltering income. Rental losses are passive: they offset passive income freely, and up to $25,000/yr can offset ordinary (W-2) income if you actively participate and your MAGI is under $100k (phasing out to $0 by $150k); unused losses carry forward. On sale, claimed depreciation is recaptured at up to 25%, and gains may owe capital-gains tax (a 1031 exchange can defer both). Figures are a year-1 estimate at your 24.0% rate — not tax advice; consult a CPA.
Schools (NCES district)
- District
- Rochester City School District
- NCES district ID
- 3624750
- Math proficiency
- 21% ▬ 0.00%
- Reading proficiency
- 26% ▲ 4.00%
- Median HH income
- $30,923
- Composite
- 18.98/100
- National rank
- #8850
- State rank
- #589 of 590 in NY
Livability — Rochester
- Score
- 76/100
- State rank
- #222
- US rank
- #3482
Category grades
Schools grade is shown separately in the Schools card above.
Census & demographics
- Census place
- Rochester, NY
- County
- Monroe County · 674,131 people
- City population
- 432,803
- Metro
- Rochester, NY
- Population (ZIP)
- 17,145
- Household income
- $31,376
- Rent vs Own
- Severe rent burden
- 2168.0
Population outlook (Monroe County) Hauer SSP2
- Today (2025)
- 759,460 people
- By 2030
- 757,154 · -0.3%
- By 2040
- 740,644 · -2.5%
- By 2050
- 714,443 · -5.9%
- By 2075
- 645,883 · -15.0%
- By 2100
- 547,084 · -28.0%
Race, ethnicity, and origin ACS 2023
- Neighborhood character
- Diverse neighborhood (Simpson 0.61)
- Race & ethnicity
- Black 55% White 22% Hispanic / Latino 18% Two or more races 13% Asian 1%
- Hispanic origin (detail)
- Puerto Rican 14% Dominican 2%
- Common ancestry
- Romanian 1% Lithuanian 1% Slovak 1%
- Foreign-born
- 3% · Canada
- Languages at home
- 85% English-only · Spanish 12% French/Haitian/Cajun 1% Other Indo-European 1%
Political lean MEDSL · Monroe
- 2024 margin
- D (+19.1) · D 59.5% · R 40.5%
- 2008→2024 swing
- +1.4pp toward D · 2008: 17.7pp · 2024: 19.1pp
- All cycles
- 2024: D+19.1 2020: D+21.0 2016: D+14.1 2012: D+17.4 2008: D+17.7
Not yet ingested
- Civics
- —
Market trends
- HPI YoY
- ▼ -2.93%
- Current HPI
- 262.1549
- Rent YoY
- ▲ 6.37%
- Metro
- Rochester, NY
- State GDP YoY
- ▲ 2.60%
- F500 in state
- 92
Industry mix (Fortune 500 HQ in NY)
| Industry | F500 HQs | Revenue |
|---|---|---|
| Financial Services | 10 | $950B |
|
||
| Consumer Goods | 9 | $162B |
|
||
| Insurance | 4 | $225B |
|
||
| Telecommunications | 2 | $144B |
|
||
| Pharmaceuticals | 2 | $112B |
|
||
| Media / Entertainment | 2 | $69B |
|
||
Price history
+178.6% since first listed2 events — show timeline
- 2026-05-28 Listed $119,777 UNYREIS
- 2010-01-25 Sold (Public Records) $43,000 Public Records
Property tax history
+1.1%/yrLatest (2025): $702 · +0.0% YoY. Source: county tax records.
Cash-flow waterfall
monthlySold comps — $/sqft
last 12 mo · ≤1 miLoading sold comps…