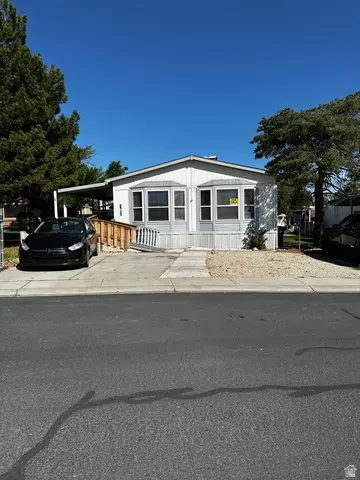
5075 W 4700 S #103 · Kearns, UT
Flood risk 1/10 · Minimal
- FEMA flood zone
- X (unshaded)
- Chance of flooding over 30 yrs
- 0.0%
- Est. flood insurance / yr
- $507 – $1,088
Fire risk 2/10 · Minimal
- Est. fire insurance / yr
- $453 – $841
Heat risk 4/10 · Minor
- Hot days now (above 95°F)
- 7 days/yr
- Hot days in 30 yrs
- 19 days/yr
Wind risk 1/10 · Minimal
- Chance of severe wind over 30 yrs
- —
Air-quality risk 3/10 · Minor
- Unhealthy air days now
- 3 days/yr
- Unhealthy air days in 30 yrs
- 4 days/yr
Risk factors via First Street. Map © Google.
Why this score? — see what drove the D grade
The composite is a weighted blend of 9 inputs, each scored 0–100. Each bar is that input's sub-score; the figure is the points it added to the 100-point composite (weight × sub-score).
- 1% rule +10.0/10.0
- Cash flow +9.0/30.0
- ARV discount +7.5/15.0
- Livability +3.7/5.0
- Schools +2.6/10.0
- DSCR +2.5/10.0
- Rent growth +2.5/5.0
- Condition / age +2.5/5.0
- Appreciation +0.0/10.0
$107,430
🖨 Deal sheet 📄 Offer letter ✓ Due diligence
Listing remarks MLS
There are no remarks available.
Key facts
- Open floor plan
- Covered porches
- Cathedral ceilings
Tags
Property features AI
Finance
- Other: Landscaped lot with pines
- HOA & community: Homeowners association with monthly fee; Monthly association fee of $1,080; Community clubhouse; Gated community; On-site management; Pets permitted; Playground; Snow removal; Storage amenities; Subdivision: SHADOW RIDGE ESTATES
Exterior
- Parking: 3 total parking spaces (all open)
- Utilities: Natural gas connected; Electricity connected; Water connected; Sewer connected
- Home design: Mobile home; Single-level living; Faces south
- Construction: Built in 2005; Asphalt construction materials; Asphalt roof; Built/standing condition
- Exterior features: Covered deck; Covered patio; Skylights; Storage shed
Interior
- Bedrooms: 3 main-level bedrooms
- Bathrooms: 2 full bathrooms
- Heating & cooling: Forced-air gas heating (central); Central air conditioning
- Interior features: Primary bath; Walk-in closet; Vaulted ceilings; Ceiling fans
- Laundry & utility: Washer included; Dryer included
Neighborhood map
What this means for you Summary
Snapshot
- This is a 3-bed/2.0-bath manufactured listed at $107k.
Deal economics
- At list price, monthly cash flow is $-84 ($-1k/yr) — negative.
- To cash-flow at today's rent, offer at most $95k (11.3% below list).
- Meets the 1% rule at list price ($2k rent vs $107k).
- Recommended offer: $95k (11.3% below list) — sets the bar for cash-flow.
Location & tenants
- Location reads 74/100 on livability (#64 in UT, #4,366 nationally) — a middle-class / working-renter tenant base. Strengths: commute A+, housing A+, employment B+; Watch: amenities F, health & safety D-.
- Granite District (suburban): math 26% / reading 32% proficiency, ranked #69 of 80 in UT (top 86%) — low school quality limits family demand, transient renter base, plan for 1-2y turnover.
- Zoned schools: West Kearns School (math 21% / reading 24%, grade F, #505 of 585 statewide, top 87%, 578 students, 76% FRL); Kearns Jr High (math 14% / reading 22%, grade F, #132 of 138 statewide, top 96%, 778 students, 73% FRL); Kearns High (math 5% / reading 25%, grade F, #165 of 171 statewide, top 96%, 2,382 students, 51% FRL) — zoned schools average 67% FRL vs 45% district-wide (22 pts higher); higher-poverty schools than district average — tighter screening recommended.
- Market conditions: 118 active listings in the ZIP; 12 comparable units currently listed for rent nearby; rentals at typical pace (median 22d on market — plan ~3-4 weeks tenant-placement turnaround); solid renter incomes; 4,970 units permitted in Salt Lake County in 2024 (1,963 in 5+ unit buildings).
Forward outlook
- Local home prices are declining (-3.0%/yr); year-one equity from $742 of loan paydown is wiped out by about $3k of value loss. Plan a longer hold.
- Salt Lake County population projected at +37% by 2050 — long-run rental-demand tailwind backs the buy-and-hold thesis.
Negotiation context
- It's been on market 21 days — a 2% lower offer ($106k) is reasonable based on typical stale-listing flexibility.
- 6 sale attempts since 28y ago; this cycle's ask has dropped $10k (9%) from the opening price — seller is motivated, your offer sets the floor, not the list.
Risks & watch-outs
- Watch-outs: HOA is 49% of rent.
Questions for the listing agent
- What do current leases actually rent for vs. the listed asking? Can we see a recent rent roll and the last 12 months of T-12 income?
- What does the HOA fee cover, when was the last increase, and are there any pending special assessments or reserve-fund shortfalls?
- Is there a deadline driving the sale (1031 exchange, divorce, estate, relocation)? That informs how much negotiation room exists.
- Schools are F-rated, which usually means shorter tenancies and higher turnover. Who's the typical renter profile here, and what's been the actual vacancy rate?
- The area grade is low — what's the realistic commute time and amenity access for the typical tenant pool here? Any planned neighborhood developments (good or bad) we should know about?
- What's the average days-on-market for RENTAL listings here right now (not sales)? A rising rental-DOM trend means longer vacancies and softer asking-rent achievability than the comps imply.
- What's the recent tenant-quality profile in this submarket — average credit score on applications, eviction rate, late-payment / NSF rate, and stable-employment percentage? A property-management company in the area should have these aggregated.
- How much new for-sale + rental construction is in the pipeline within 1–3 miles? Heavy new supply typically softens prices + rents 12–24 months out; constrained supply supports both.
Investment metrics
- 1% rule
- 2.05% ✓
- Cap rate
- 5.36%
- Cash-on-cash
- -3.34%
- DSCR
- 0.85
- GRM
- 4.1
CMA / ARV
No comps found within radius.
Projected returns pro-forma
-3.0% appreciation · 3.0% rent growth · sell at horizon
- IRR
- -21.0%
- Equity multiple
- 0.27×
- Total profit
- $-22,047
- Equity at exit
- $16,018
- IRR
- -12.7%
- Equity multiple
- 0.23×
- Total profit
- $-23,237
- Equity at exit
- $9,289
Cash invested: $30,080 (down + closing). Projections, not guarantees.
Landlord ↔ Tenant lean methodology
- Overall (STATE)
- 86 Strongly Landlord-Friendly
- State Utah
- 86 Strongly Landlord-Friendly · R+15
- County
- — inherits STATE
- City
- — inherits STATE
ZIP-level market 84118
- Active inventory
- 118
- Price-to-rent
- 4.1×
Monthly cashflow live
- Estimated rent
- $2,201 high interval (Pro) →
- Mortgage (P&I)
- −$563
- Tax est. 1.5%
- −$134 /mo · $1,611/yr
- Insurance
- −$45
- HOA
- −$1,080
- Vacancy / Maint / Mgmt
- −$462
- Net cashflow
- $-84
Break-even live
UW: 25.0% down · 7.5% · 30yr · 1.5% tax · 5.0% vac · 8.0% maint · 8.0% mgmt
Financing live
Cash to close
- Down payment
- $26,858
- Closing costs
- $3,223
- Reserves months
- —
- Total cash needed
- —
Loan-product check · same deal, 3 products live
Conventional
25% down · 7.5% · 30yr
- Down + closing
- —
- Monthly P&I
- —
- Monthly cashflow
- —
- DSCR
- —
- Eligible?
- —
Personal DTI + credit; lowest rate.
DSCR
20% down · 8.5% · 30yr
- Down + closing
- —
- Monthly P&I
- —
- Monthly cashflow
- —
- DSCR
- —
- Eligible?
- —
No personal income docs; deal must DSCR.
Hard money
10% down · 12.0% · 12mo
- Down + closing
- —
- Monthly P&I
- —
- Monthly cashflow
- —
- DSCR
- —
- Eligible?
- —
Short-term bridge; refi at stabilization.
Rent comps 12 comps
| Address | Beds | Baths | Sqft | Rent | $/sqft | DOM | Units | Dist |
|---|---|---|---|---|---|---|---|---|
| 4532 S Greystock Cir West Valley City, UT | 4.0 | 2.0 | 1600 | $2,375 | $1.48 | 4d | 1 | 0.76mi |
| 4481 W 5015 S Salt Lake City, UT | 3.0 | 1.5 | 1415 | $2,195 | $1.55 | 24d | 1 | 0.77mi |
| 4218 S 4800 W West Valley City, UT | 2.0 | 1.0 | 1079 | $1,450 | $1.34 | 14d | 1 | 0.93mi |
| 4438 W Losee Dr West Valley City, UT | 4.0 | 2.0 | 2100 | $3,000 | $1.43 | 24d | 1 | 0.97mi |
| 4074 W 4865 S Salt Lake City, UT | 4.0 | 2.0 | 1800 | $600 | $0.33 | 24d | 1 | 1.15mi |
| 4241 S Falcon St West Valley City, UT | 3.0 | 1.0 | 1344 | $1,550 | $1.15 | 16d | 1 | 1.37mi |
| 4241 Falcon St Unit BS West Valley City, UT | 3.0 | 1.0 | 1344 | $1,550 | $1.15 | 4d | 1 | 1.37mi |
| 4403 S 4000 W Unit A Salt Lake City, UT | 2.0 | 2.0 | 1108 | $1,700 | $1.53 | 24d | 1 | 1.38mi |
| 4420 Dean Cir Unit B Salt Lake City, UT | 3.0 | 1.5 | 1258 | $1,950 | $1.55 | 24d | 1 | 1.39mi |
| 3881 W Ridgeview Way Salt Lake City, UT | 2.0 | 1.0 | 1188 | $1,700 | $1.43 | 4d | 1 | 1.41mi |
| 3839 W Kinglassie Ln Taylorsville, UT | 3.0 | 2.5 | 1864 | $2,400 | $1.29 | 21d | 1 | 1.45mi |
| 5677 S Esprit Dr Salt Lake City, UT | 3.0 | 2.0 | 1680 | $2,000 | $1.19 | 14d | 1 | 1.47mi |
HOA detail
- Monthly dues
- $1,080 · $12,960/yr
Listing history 24 events
-
2026-06-18days on market $107,430 Active 21 DOM
-
2026-06-17price $107,430 Active 20 DOM
-
2026-06-17days on market $117,430 Active 20 DOM
-
2026-06-16days on market $117,430 Active 19 DOM
-
2026-06-15days on market $117,430 Active 18 DOM
-
2026-06-13days on market $117,430 Active 16 DOM
-
2026-06-09days on market $117,430 Active 12 DOM
-
2026-06-08days on market $117,430 Active 11 DOM
-
2026-06-07days on market $117,430 Active 10 DOM
-
2026-06-03days on market $117,430 Active 6 DOM
-
2026-06-02days on market $117,430 Active 5 DOM
-
2026-06-01days on market $117,430 Active 4 DOM
-
2026-05-31days on market $117,430 Active 3 DOM
-
2026-05-28$117,430 Active
-
2023-12-14soldstatus Closed 31-char remark
Show marketing remark (31 chars)
There are no remarks available.
-
2023-12-05status Under Contract 31-char remark
Show marketing remark (31 chars)
There are no remarks available.
-
2023-11-14$94,900 Active 31-char remark
Show marketing remark (31 chars)
There are no remarks available.
-
2006-09-18historical
-
2006-04-18$39,900
-
2005-12-07historical
-
2005-03-08$40,000
-
2003-12-09historical
-
2003-06-09$45,000
-
1998-01-24$61,900
ⓘ Source: listings_history table (triggers on properties + properties_extension) + one-shot
backfill from property_details.listing_events for pre-trigger history.
Climate risk First Street
- Flood 1/10 Low FEMA zone X (unshaded) · 0% chance over 30 yrs
- Wildfire 2/10 Low
- Heat 4/10 Moderate 7 d/yr ≥95°F today · 19 d/yr by 30 yrs out
- Wind 1/10 Low
- Air quality 3/10 Moderate 3 unhealthy d/yr today · 4 by 30 yrs out
Nearby sold comps map
Loading sold comps map…
Walkable amenities ~0.75 mi
Loading nearby amenities…
Taxation est. · year 1
- Rental income
- $26,410
- − Mortgage interest
- −$6,018
- − Property taxes
- −$1,611
- − Insurance
- −$537
- − Repairs & maintenance
- −$2,113
- − Management
- −$2,113
- − HOA
- −$12,960
- − Depreciation
- −$3,125
- Taxable loss
- −$2,067
- Est. tax savings @ 24.0%
- +$496
- After-tax cash flow
- $-509/yr
For passive investors: Depreciation is non-cash, so a rental often shows a tax loss while cash-flowing — sheltering income. Rental losses are passive: they offset passive income freely, and up to $25,000/yr can offset ordinary (W-2) income if you actively participate and your MAGI is under $100k (phasing out to $0 by $150k); unused losses carry forward. On sale, claimed depreciation is recaptured at up to 25%, and gains may owe capital-gains tax (a 1031 exchange can defer both). Figures are a year-1 estimate at your 24.0% rate — not tax advice; consult a CPA.
Schools (NCES district)
- District
- Granite District
- NCES district ID
- 4900360
- Math proficiency
- 26% ▼ -8.00%
- Reading proficiency
- 32% ▼ -3.00%
- Median HH income
- $55,971
- Composite
- 25.93/100
- National rank
- #7336
- State rank
- #69 of 80 in UT
Livability — Kearns
- Score
- 74/100
- State rank
- #64
- US rank
- #4366
Category grades
Schools grade is shown separately in the Schools card above.
Census & demographics
- Census place
- Kearns, UT
- County
- Salt Lake County · 1,195,750 people
- City population
- 42,853
- Metro
- Salt Lake City, UT
- Population (ZIP)
- 42,853
- Household income
- $90,562
- Rent vs Own
- Severe rent burden
- 361.0
Population outlook (Salt Lake County) Hauer SSP2
- Today (2025)
- 1,305,860 people
- By 2030
- 1,402,611 · +7.4%
- By 2040
- 1,594,533 · +22.1%
- By 2050
- 1,787,244 · +36.9%
- By 2075
- 2,224,138 · +70.3%
- By 2100
- 2,551,390 · +95.4%
Race, ethnicity, and origin ACS 2023
- Neighborhood character
- Diverse neighborhood (Simpson 0.61)
- Race & ethnicity
- White 49% Hispanic / Latino 39% Two or more races 14% Pacific Islander 4% Black 2% Asian 2% Native American 2%
- Hispanic origin (detail)
- Mexican 30% Puerto Rican 1%
- Common ancestry
- Slovak 3% Iranian 1% Italian 1%
- Foreign-born
- 18% · Canada, Jamaica
- Languages at home
- 64% English-only · Spanish 31% Other Asian/Pacific 2% Other Indo-European 1%
Political lean MEDSL · Salt Lake
- 2024 margin
- D (+10.2) · D 53.7% · R 43.5% · Other 2.8%
- 2008→2024 swing
- +10.1pp toward D · 2008: 0.1pp · 2024: 10.2pp
- All cycles
- 2024: D+10.2 2020: D+11.0 2016: D+10.2 2012: R+19.3 2008: D+0.1
Not yet ingested
- Civics
- —
Market trends
- HPI YoY
- ▼ -207.24%
- Current HPI
- 349.5169
- Rent YoY
- —
- Metro
- Salt Lake City, UT
- State GDP YoY
- ▲ 3.54%
- F500 in state
- 2
Industry mix (Fortune 500 HQ in UT)
| Industry | F500 HQs | Revenue |
|---|---|---|
| Financial Services | 1 | $3B |
|
||
Price history
+89.7% since first listed11 events — show timeline
- 2026-05-28 Listed $117,430 WFRMLS
- 2023-12-14 Sold (MLS) — WFRMLS
- 2023-12-05 Pending — WFRMLS
- 2023-11-14 Listed $94,900 WFRMLS
- 2006-09-18 Listing Removed — WFRMLS
- 2006-04-18 Listed $39,900 WFRMLS
- 2005-12-07 Listing Removed — WFRMLS
- 2005-03-08 Listed $40,000 WFRMLS
- 2003-12-09 Listing Removed — WFRMLS
- 2003-06-09 Listed $45,000 WFRMLS
- 1998-01-24 Listed $61,900 WFRMLS
Cash-flow waterfall
monthlySold comps — $/sqft
last 12 mo · ≤1 miLoading sold comps…