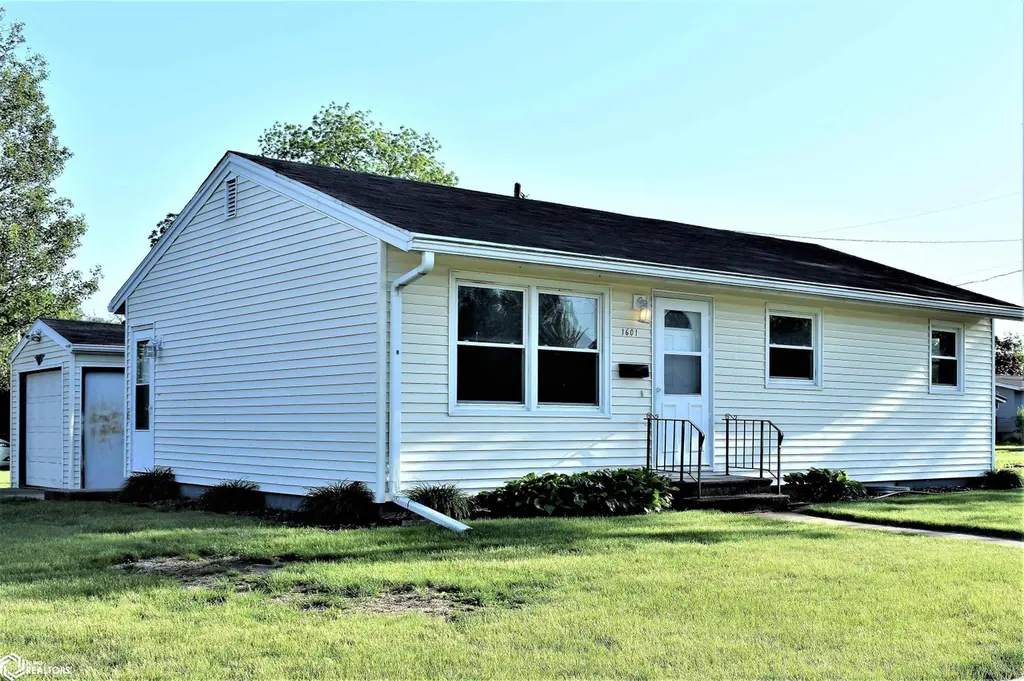
1601 Linden Ave · Iowa Falls, IA
Flood risk 4/10 · Minor
- FEMA flood zone
- X (unshaded)
- Chance of flooding over 30 yrs
- 0.2%
- Est. flood insurance / yr
- $473 – $860
Fire risk 4/10 · Minor
- Est. fire insurance / yr
- $902 – $1,676
Heat risk 3/10 · Minor
- Hot days now (above 101°F)
- 7 days/yr
- Hot days in 30 yrs
- 15 days/yr
Wind risk 2/10 · Minimal
- Chance of severe wind over 30 yrs
- —
Air-quality risk 1/10 · Minimal
- Unhealthy air days now
- 0 days/yr
- Unhealthy air days in 30 yrs
- 0 days/yr
Risk factors via First Street. Map © Google.
Why this score? — see what drove the D- grade
The composite is a weighted blend of 9 inputs, each scored 0–100. Each bar is that input's sub-score; the figure is the points it added to the 100-point composite (weight × sub-score).
- Cash flow +14.4/30.0
- Schools +5.6/10.0
- DSCR +4.4/10.0
- Livability +3.9/5.0
- 1% rule +3.0/10.0
- Rent growth +2.5/5.0
- Condition / age +2.5/5.0
- ARV discount +0.0/15.0
- Appreciation +0.0/10.0
$127,900
🖨 Deal sheet (PDF) 📄 Offer letter ✓ Due diligence
Listing remarks
Small but mighty! This cute three bedroom ranch home has had many improvements over the years. Vinyl siding, replacement windows, bathroom remodel, kitchen remodel, newer HVAC to name a few. On the main floor you will find a nice sized living room, updated maple kitchen cabinets, bathroom with walk in shower and three bedrooms on then main floor. Or, you do have the ability to turn one of the bedrooms into a main floor laundry area, the hookups are already there. The lower level is open and provides great storage. There is also a one car detached garage! Be sure to take a look!!
Key facts
- Bathroom remodel
- Vinyl siding
- Newer hvac
Tags
Property features AI
Finance
- Other: Property listed as residential single family; Lot approximately 0.1 acre (59 x 75)
- Financial info: No investment or income details specified
- HOA & community: No HOA information specified
Exterior
- Parking: Detached concrete garage with 1 garage space
- Security: No security features specified
- Utilities: Public water; Public sewer
- Home design: Single-family residence; Residential zoning (single family)
- Construction: Block and frame construction with vinyl siding; Shingle roof; Foundation matches main living area
- Exterior features: Corner lot; City street frontage; Publicly maintained road
Interior
- Kitchen: Range; Cooktop; Microwave; Refrigerator
- Bedrooms: Bedrooms not specified
- Flooring: Carpet; Tile
- Bathrooms: 1 full bathroom
- Heating & cooling: Forced air heating; Central air conditioning
- Interior features: Basement present; Storage building/area on property
- Laundry & utility: Washer
Neighborhood map
What this means for you Summary
Snapshot
- This is a 3-bed/1.5-bath single-family listed at $128k.
Deal economics
- At list price, monthly cash flow is $25 ($301/yr) — positive.
- The deal already cash-flows at list — no discount required.
- To meet the 1% rule (rent ≥ 1% of price), the offer needs to be $102k (20.1% below list).
- Recommended offer: $102k (20.1% below list) — sets the bar for 1% rule.
- Cap rate 6.5% vs local median 3.8% in Iowa Falls — top-decile yield for the area; either an underpriced asset or a hidden risk that comps aren't pricing in. Stress-test before assuming the spread holds.
Location & tenants
- Location reads 77/100 on livability (#172 in IA, #3,097 nationally) — a middle-class / working-renter tenant base. Strengths: cost of living A+, housing A+, health & safety A+; Watch: employment D, amenities F, commute F.
- Iowa Falls Community School District (town): math 62% / reading 71% proficiency, ranked #184 of 289 in IA (top 64%) — acceptable for families but not a draw, mixed tenant base, ~2y average lease.
- Zoned schools: Rock Run Elementary (math 70% / reading 68%, grade A-, #263 of 616 statewide, top 43%, 294 students, 42% FRL); Riverbend Middle School (math 56% / reading 65%, grade B+, #183 of 246 statewide, top 75%, 288 students, 42% FRL); Iowa Falls - Alden High School (math 60% / reading 78%, grade B, #176 of 336 statewide, top 53%, 412 students, 35% FRL).
- Market conditions: 92 active listings in the ZIP; 6 units permitted in Hardin County in 2024 (0 in 5+ unit buildings).
Forward outlook
- Local home prices are declining (-3.0%/yr); year-one equity from $884 of loan paydown is wiped out by about $4k of value loss. Plan a longer hold.
- Hardin County population projected to shrink 6% by 2050 — rents likely to lag national; underwrite the cash flow, not the appreciation.
Negotiation context
- Only 12 days on market — expect competitive offers; lowballing is unlikely to land.
Risks & watch-outs
- Watch-outs: built in 1954 — expect roof / HVAC / electrical / plumbing capex.
Questions for the listing agent
- Built in 1954 — when were the roof, HVAC, electrical panel, plumbing, and water heater last replaced?
- Is there a deadline driving the sale (1031 exchange, divorce, estate, relocation)? That informs how much negotiation room exists.
- Schools are B-rated — typically a magnet for longer-tenancy family renters. What's the average tenant stay here, and is there a school-zone premium baked into asking?
- The area grade is low — what's the realistic commute time and amenity access for the typical tenant pool here? Any planned neighborhood developments (good or bad) we should know about?
- What's the average days-on-market for RENTAL listings here right now (not sales)? A rising rental-DOM trend means longer vacancies and softer asking-rent achievability than the comps imply.
- What's the recent tenant-quality profile in this submarket — average credit score on applications, eviction rate, late-payment / NSF rate, and stable-employment percentage? A property-management company in the area should have these aggregated.
- How much new for-sale + rental construction is in the pipeline within 1–3 miles? Heavy new supply typically softens prices + rents 12–24 months out; constrained supply supports both.
Investment metrics
- 1% rule
- 0.80% ✗
- Cap rate
- 6.53%
- Cash-on-cash
- 0.84%
- DSCR
- 1.04
- GRM
- 10.4
CMA / ARV
- ARV (on-the-fly)
- $95,040
- Comps found
- 12
Show comp detail 12 sales within ~0.75 mi
| Address | Dist | Beds/Ba | Sqft | Sold | Price | $/sf | Match |
|---|---|---|---|---|---|---|---|
| 202 Carson Ave | 0.10mi | 2/1.0 (-1) | 966 (+12%) | 2mo | $34,000 | $35 | 67 |
| 118 Indiana Ave | 0.21mi | 3/1.0 | 960 (+11%) | 5mo | $137,715 | $143 | 66 |
| 1018 Rocksylvania Ave | 0.44mi | 2/1.0 (-1) | 854 (-1%) | 7mo | $162,500 | $190 | 65 |
| 421 Cedar St | 0.46mi | 2/1.0 (-1) | 824 (-5%) | 1mo | $70,000 | $85 | 63 |
| 209 Ohio Ave | 0.18mi | 2/1.0 (-1) | 880 (+2%) | 23mo | $73,500 | $84 | 62 |
| 115 Thompson Ave | 0.02mi | 2/1.0 (-1) | 780 (-10%) | 23mo | $85,500 | $110 | 57 |
| 507 Cedar St | 0.48mi | 3/1.0 | 858 (-1%) | 23mo | $50,000 | $58 | 55 |
| 413 School St | 0.29mi | 2/1.0 (-1) | 810 (-6%) | 18mo | $127,000 | $157 | 54 |
| 307 Western | 0.16mi | 2/1.0 (-1) | 978 (+13%) | 13mo | $108,000 | $110 | 52 |
| 710 Iowa St | 0.66mi | 2/1.0 (-1) | 896 (+4%) | 12mo | $76,000 | $85 | 47 |
| 416 School St | 0.30mi | 3/1.0 | 982 (+14%) | 19mo | $115,000 | $117 | 45 |
| 1222 Washington Ave | 0.19mi | 2/1.0 (-1) | 988 (+14%) | 20mo | $69,000 | $70 | 44 |
Match score weights: distance 35% · size 25% · config 20% · recency 20%. Top-matched comps best support the ARV.
Projected returns pro-forma
-3.0% appreciation · 3.0% rent growth · sell at horizon
- IRR
- -15.0%
- Equity multiple
- 0.46×
- Total profit
- $-19,174
- Equity at exit
- $19,070
- IRR
- -6.5%
- Equity multiple
- 0.59×
- Total profit
- $-14,828
- Equity at exit
- $11,058
Cash invested: $35,812 (down + closing). Projections, not guarantees.
Landlord ↔ Tenant lean methodology
- Overall (STATE)
- 83 Strongly Landlord-Friendly
- State Iowa
- 83 Strongly Landlord-Friendly · R+6
- County
- — inherits STATE
- City
- — inherits STATE
ZIP-level market 50126
- Active inventory
- 92
- Price-to-rent
- 10.4×
Monthly cashflow live
- Estimated rent
- $1,022 medium interval (Pro) →
- Mortgage (P&I)
- −$671
- Tax from tax record
- −$59 /mo · $704/yr
- Insurance
- −$53
- HOA
- −$0
- Vacancy / Maint / Mgmt
- −$215
- Net cashflow
- $25
Break-even live
Sensitivity live
| Price | -10% $97 | -5% $61 | +0% $25 | +5% $-11 | +10% $-47 |
|---|---|---|---|---|---|
| Rent | -10% $-56 | -5% $-15 | +0% $25 | +5% $65 | +10% $106 |
| Rate | -1.0pp $90 | -0.5pp $58 | base $25 | +0.5pp $-8 | +1.0pp $-42 |
UW: 25.0% down · 7.5% · 30yr · 1.5% tax · 5.0% vac · 8.0% maint · 8.0% mgmt
Financing live
Cash to close
- Down payment
- $31,975
- Closing costs
- $3,837
- Reserves months
- —
- Total cash needed
- —
Loan-product check · same deal, 3 products live
Conventional
25% down · 7.5% · 30yr
- Down + closing
- —
- Monthly P&I
- —
- Monthly cashflow
- —
- DSCR
- —
- Eligible?
- —
Personal DTI + credit; lowest rate.
DSCR
20% down · 8.5% · 30yr
- Down + closing
- —
- Monthly P&I
- —
- Monthly cashflow
- —
- DSCR
- —
- Eligible?
- —
No personal income docs; deal must DSCR.
Hard money
10% down · 12.0% · 12mo
- Down + closing
- —
- Monthly P&I
- —
- Monthly cashflow
- —
- DSCR
- —
- Eligible?
- —
Short-term bridge; refi at stabilization.
Listing history 10 events
-
2026-06-09status $127,900 Pending 12 DOM
-
2026-06-08days on market $127,900 Active Under Contract 12 DOM
-
2026-06-07days on market $127,900 Active Under Contract 11 DOM
-
2026-06-07days on market $127,900 Active Under Contract 10 DOM
-
2026-06-04statusdays on market $127,900 Active Under Contract 7 DOM
-
2026-06-02days on market $127,900 Active 6 DOM
-
2026-06-01days on market $127,900 Active 5 DOM
-
2026-05-31days on market $127,900 Active 4 DOM
-
2026-05-31days on market $127,900 Active 3 DOM
-
2026-05-27$127,900 Active
ⓘ Source: listings_history table (triggers on properties + properties_extension) + one-shot
backfill from property_details.listing_events for pre-trigger history.
Tax reassessment forecast IA · Partial reset (capped growth)
- Current annual tax
- $704 · $59/mo
- Projected year-2 tax
- $1,356 · $113/mo
- Expected delta
- +$652/yr (+$54/mo · 92.6%)
ⓘ Screening estimate from a state-policy table — verify with the county assessor before closing.
Climate risk First Street
- Flood 4/10 Moderate FEMA zone X (unshaded) · 20% chance over 30 yrs
- Wildfire 4/10 Moderate
- Heat 3/10 Moderate 7 d/yr ≥101°F today · 15 d/yr by 30 yrs out
- Wind 2/10 Low
- Air quality 1/10 Low 0 unhealthy d/yr today · 0 by 30 yrs out
Nearby sold comps map
Loading sold comps map…
Walkable amenities ~0.75 mi
Loading nearby amenities…
Taxation est. · year 1
- Rental income
- $12,270
- − Mortgage interest
- −$7,164
- − Property taxes
- −$704
- − Insurance
- −$640
- − Repairs & maintenance
- −$982
- − Management
- −$982
- − Depreciation
- −$3,721
- Taxable loss
- −$1,922
- Est. tax savings @ 24.0%
- +$461
- After-tax cash flow
- $762/yr
For passive investors: Depreciation is non-cash, so a rental often shows a tax loss while cash-flowing — sheltering income. Rental losses are passive: they offset passive income freely, and up to $25,000/yr can offset ordinary (W-2) income if you actively participate and your MAGI is under $100k (phasing out to $0 by $150k); unused losses carry forward. On sale, claimed depreciation is recaptured at up to 25%, and gains may owe capital-gains tax (a 1031 exchange can defer both). Figures are a year-1 estimate at your 24.0% rate — not tax advice; consult a CPA.
Schools (NCES district)
- District
- Iowa Falls Community School District
- NCES district ID
- 1914730
- Math proficiency
- 62% ▼ -9.00%
- Reading proficiency
- 71% ▼ -5.00%
- Median HH income
- $46,696
- Composite
- 56.12/100
- National rank
- #1182
- State rank
- #184 of 289 in IA
Livability — Iowa Falls
- Score
- 77/100
- State rank
- #172
- US rank
- #3097
Category grades
Schools grade is shown separately in the Schools card above.
Census & demographics
- Census place
- Iowa Falls, IA
- City population
- 6,362
- Population (ZIP)
- 6,362
Population outlook (Hardin County) Hauer SSP2
- Today (2025)
- 17,474 people
- By 2030
- 17,369 · -0.6%
- By 2040
- 17,018 · -2.6%
- By 2050
- 16,454 · -5.8%
- By 2075
- 14,665 · -16.1%
- By 2100
- 12,404 · -29.0%
Race, ethnicity, and origin ACS 2023
- Neighborhood character
- Predominantly White (90%)
- Race & ethnicity
- White 90% Hispanic / Latino 7% Two or more races 2% Black 2%
- Hispanic origin (detail)
- Mexican 5% Puerto Rican 1%
- Common ancestry
- Portuguese 6% Iranian 3% Lithuanian 2%
- Foreign-born
- 3% · Canada
- Languages at home
- 94% English-only · Spanish 5%
Political lean MEDSL · Hardin
- 2024 margin
- Solid R (+38.4) · D 30.3% · R 68.7% · Other 1.1%
- 2008→2024 swing
- -39.3pp toward R · 2008: 0.9pp · 2024: -38.4pp
- All cycles
- 2024: R+38.4 2020: R+32.0 2016: R+29.2 2012: R+7.1 2008: D+0.9
Not yet ingested
- Civics
- —
Market trends
- HPI YoY
- ▼ -87.54%
- Current HPI
- 146.3741
- Rent YoY
- —
- Metro
- —
- State GDP YoY
- ▲ 2.48%
- F500 in state
- 4
Industry mix (Fortune 500 HQ in IA)
| Industry | F500 HQs | Revenue |
|---|---|---|
| Financial Services | 1 | $16B |
|
||
| Retail / Convenience | 1 | $15B |
|
||
Price history
1 event — show timeline
- 2026-05-27 Listed $127,900 IAR
Property tax history
-4.4%/yrLatest (2025): $704 · -10.9% YoY. Source: county tax records.
Cash-flow waterfall
monthlySold comps — $/sqft
last 12 mo · ≤1 miLoading sold comps…