106 1st St · Kerens, TX
Flood risk 1/10 · Minimal
- FEMA flood zone
- X (unshaded)
- Chance of flooding over 30 yrs
- 0.0%
- Est. flood insurance / yr
- $507 – $1,088
Fire risk 5/10 · Moderate
- Est. fire insurance / yr
- $1,222 – $2,270
Heat risk 7/10 · Major
- Hot days now (above 109°F)
- 7 days/yr
- Hot days in 30 yrs
- 26 days/yr
Wind risk 6/10 · Moderate
- Chance of severe wind over 30 yrs
- 60.0%
Air-quality risk 2/10 · Minimal
- Unhealthy air days now
- 0 days/yr
- Unhealthy air days in 30 yrs
- 1 days/yr
Risk factors via First Street. Map © Google.
Why this score? — see what drove the B- grade
The composite is a weighted blend of 9 inputs, each scored 0–100. Each bar is that input's sub-score; the figure is the points it added to the 100-point composite (weight × sub-score).
- Cash flow +20.2/30.0
- ARV discount +15.0/15.0
- Appreciation +7.8/10.0
- DSCR +6.4/10.0
- 1% rule +5.5/10.0
- Livability +3.2/5.0
- Schools +3.1/10.0
- Rent growth +2.5/5.0
- Condition / age +2.5/5.0
$110,000
🖨 Deal sheet 📄 Offer letter ✓ Due diligence
Listing remarks MLS
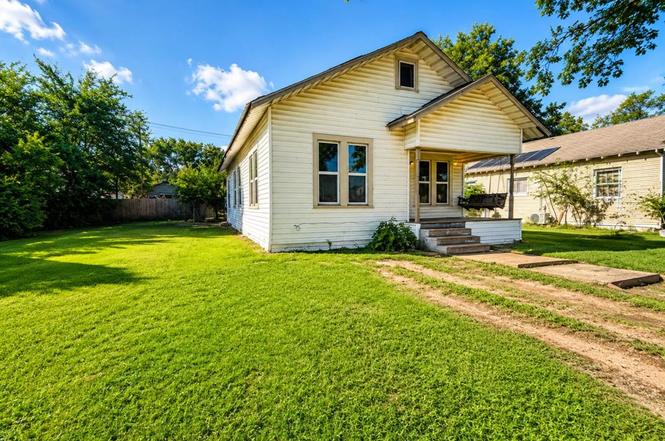
Attention, There is a charming 3 bedroom 1 bath home at an affordable price just waiting on its buyer. Conveniently located centrally in town, this home is close to all local amenities & attractions. This is a beautiful property that meets a variety of wants & needs for any potential buyer. The front porch swing is perfect for early morning coffee or late night conversations & it's covered so enjoying the rain isn't a problem. Coming inside the house you'll be happy to see all of the natural light beaming in from the big windows that are throughout the house. The office -dining room is decorated with a rustic charm & is just one of many bonuses to this home. So many positives & so many possibilities await.
Key facts
- 9,148 sq ft lot
- Built 1925
Property features AI
Finance
- Financial info: Accepts Cash and Conventional financing; No second mortgage
- HOA & community: No association
Exterior
- Parking: Driveway
- Utilities: City water; City sewer; All-weather road
- Home design: Single family residence; Residential property; One story; Attached
- Construction: Built in 1925; Siding exterior; Metal roof; Pillar/post/pier foundation
- Exterior features: Chain link fencing; All-weather road access; City water; City sewer
Interior
- Kitchen: Electric oven; Microwave; Refrigerator; Eat-in kitchen
- Bedrooms: 3 bedrooms (primary bedroom on main level)
- Bathrooms: 1 full bathroom
- Interior features: Decorative lighting; Eat-in kitchen; Other interior features; One living area; One dining area; Two total rooms
- Laundry & utility: Washer; Dryer; Other laundry features
Neighborhood map
What this means for you Summary
Snapshot
- This is a 3-bed/1.0-bath single-family listed at $110k.
Deal economics
- At list price, monthly cash flow is $139 ($2k/yr) — positive.
- The deal already cash-flows at list — no discount required.
- Meets the 1% rule at list price ($1k rent vs $110k).
- Cap rate 7.8% vs local median 1.6% in Kerens — top-decile yield for the area; either an underpriced asset or a hidden risk that comps aren't pricing in. Stress-test before assuming the spread holds.
Location & tenants
- Location reads 63/100 on livability (#866 in TX) — a middle-class / working-renter tenant base. Strengths: crime A+, cost of living A+, housing A+; Watch: schools D-, amenities F, commute F.
- Kerens ISD (rural): math 37% / reading 37% proficiency, ranked #495 of 826 in TX (top 60%) — families likely to look elsewhere, expect single-tenant / working-renter base with shorter leases; 68% free/reduced lunch — lower-income household profile, screen leases tightly.
- Market conditions: 179 active listings in the ZIP; 522 units permitted in Navarro County in 2024 (0 in 5+ unit buildings).
Forward outlook
- In year one you build about $7k of equity ($761 loan paydown + $6k appreciation (5.6% local appreciation)).
- Navarro County population projected to shrink 4% by 2050 — rents likely to lag national; underwrite the cash flow, not the appreciation.
- At projected returns (5.6% appreciation + 3.0% rent growth), your $31k cash investment doubles in ~4 years — after that, you're playing with house money.
- By year 5, paydown + projected appreciation supports a ~$30k cash-out refi (75% LTV) — recoverable capital for the next deal without selling this one.
Negotiation context
- Only 1 days on market — expect competitive offers; lowballing is unlikely to land.
- 2 sale attempts since 6y ago with the ask held roughly flat each time — persistent listings suggest the price (not the market) is what's stuck; bring a comps-based counter.
Risks & watch-outs
- Watch-outs: built in 1925 — expect roof / HVAC / electrical / plumbing capex.
- Climate carrying-cost: major wind risk, 60% chance of damaging wind over 30y; moderate wildfire risk; extreme-heat days projected 7→26/yr by 2055 (HVAC capex compounding) — expect insurance premiums to compound above CPI over the hold.
Questions for the listing agent
- Built in 1925 — when were the roof, HVAC, electrical panel, plumbing, and water heater last replaced?
- Is there a deadline driving the sale (1031 exchange, divorce, estate, relocation)? That informs how much negotiation room exists.
- Schools are D-rated, which usually means shorter tenancies and higher turnover. Who's the typical renter profile here, and what's been the actual vacancy rate?
- What's the average days-on-market for RENTAL listings here right now (not sales)? A rising rental-DOM trend means longer vacancies and softer asking-rent achievability than the comps imply.
- What's the recent tenant-quality profile in this submarket — average credit score on applications, eviction rate, late-payment / NSF rate, and stable-employment percentage? A property-management company in the area should have these aggregated.
- How much new for-sale + rental construction is in the pipeline within 1–3 miles? Heavy new supply typically softens prices + rents 12–24 months out; constrained supply supports both.
Investment metrics
- 1% rule
- 1.05% ✓
- Cap rate
- 7.81%
- Cash-on-cash
- 5.43%
- DSCR
- 1.24
- GRM
- 8.0
CMA / ARV
- ARV (on-the-fly)
- $179,580
- Comps found
- 7
Show comp detail 7 sales within ~0.75 mi
| Address | Dist | Beds/Ba | Sqft | Sold | Price | $/sf | Match |
|---|---|---|---|---|---|---|---|
| 104 N Sinclair Ave | 0.21mi | 3/2.0 | 1,216 (-1%) | 5mo | $130,000 | $107 | 80 |
| 504 NW 4th St | 0.34mi | 3/2.0 | 1,270 (+3%) | 7mo | $184,900 | $146 | 69 |
| 408 S Throckmorton Ave | 0.37mi | 2/1.0 (-1) | 1,283 (+4%) | 6mo | $150,000 | $117 | 66 |
| 401 N Goodman Ave | 0.33mi | 3/2.0 | 1,365 (+11%) | 2mo | $235,000 | $172 | 61 |
| 316 N Overlook Dr | 0.25mi | 3/2.0 | 1,279 (+4%) | 21mo | $129,000 | $101 | 60 |
| 304 S Humphrey Ave | 0.26mi | 2/1.0 (-1) | 1,135 (-8%) | 12mo | $175,000 | $154 | 60 |
| 604 Donna Cir | 0.54mi | 2/1.0 (-1) | 1,155 (-6%) | 10mo | $179,000 | $155 | 51 |
Match score weights: distance 35% · size 25% · config 20% · recency 20%. Top-matched comps best support the ARV.
Projected returns pro-forma
5.61% appreciation · 3.0% rent growth · sell at horizon
- IRR
- 18.9%
- Equity multiple
- 2.24×
- Total profit
- $38,132
- Equity at exit
- $66,453
- IRR
- 18.6%
- Equity multiple
- 4.44×
- Total profit
- $105,982
- Equity at exit
- $118,248
Cash invested: $30,800 (down + closing). Projections, not guarantees.
Landlord ↔ Tenant lean methodology
- Overall (STATE)
- 87 Strongly Landlord-Friendly
- State Texas
- 87 Strongly Landlord-Friendly · R+5
- County
- — inherits STATE
- City
- — inherits STATE
ZIP-level market 75144
- Home prices YoY
- 2.4%
- Active inventory
- 179
- Price-to-rent
- 8.0×
Monthly cashflow live
- Estimated rent
- $1,151 medium interval (Pro) →
- Mortgage (P&I)
- −$577
- Tax from tax record
- −$147 /mo · $1,767/yr
- Insurance
- −$46
- HOA
- −$0
- Vacancy / Maint / Mgmt
- −$242
- Net cashflow
- $139
Break-even live
UW: 25.0% down · 7.5% · 30yr · 1.5% tax · 5.0% vac · 8.0% maint · 8.0% mgmt
Financing live
Cash to close
- Down payment
- $27,500
- Closing costs
- $3,300
- Reserves months
- —
- Total cash needed
- —
Loan-product check · same deal, 3 products live
Conventional
25% down · 7.5% · 30yr
- Down + closing
- —
- Monthly P&I
- —
- Monthly cashflow
- —
- DSCR
- —
- Eligible?
- —
Personal DTI + credit; lowest rate.
DSCR
20% down · 8.5% · 30yr
- Down + closing
- —
- Monthly P&I
- —
- Monthly cashflow
- —
- DSCR
- —
- Eligible?
- —
No personal income docs; deal must DSCR.
Hard money
10% down · 12.0% · 12mo
- Down + closing
- —
- Monthly P&I
- —
- Monthly cashflow
- —
- DSCR
- —
- Eligible?
- —
Short-term bridge; refi at stabilization.
Listing history 2 events
-
2026-06-18remarks 693-char remark
-
2026-06-18$110,000 Active 1 DOM
ⓘ Source: listings_history table (triggers on properties + properties_extension) + one-shot
backfill from property_details.listing_events for pre-trigger history.
Tax reassessment forecast TX · Resets to sale price
- Current annual tax
- $1,767 · $147/mo
- Projected year-2 tax
- $2,013 · $168/mo
- Expected delta
- +$246/yr (+$21/mo · 13.9%)
ⓘ Screening estimate from a state-policy table — verify with the county assessor before closing.
Climate risk First Street
- Flood 1/10 Low FEMA zone X (unshaded) · 0% chance over 30 yrs
- Wildfire 5/10 Major
- Heat 7/10 Severe 7 d/yr ≥109°F today · 26 d/yr by 30 yrs out
- Wind 6/10 Major 60% chance of damaging wind over 30 yrs
- Air quality 2/10 Low 0 unhealthy d/yr today · 1 by 30 yrs out
Nearby sold comps map
Loading sold comps map…
Walkable amenities ~0.75 mi
Loading nearby amenities…
Taxation est. · year 1
- Rental income
- $13,814
- − Mortgage interest
- −$6,162
- − Property taxes
- −$1,767
- − Insurance
- −$550
- − Repairs & maintenance
- −$1,105
- − Management
- −$1,105
- − Depreciation
- −$3,200
- Taxable loss
- −$75
- Est. tax savings @ 24.0%
- +$18
- After-tax cash flow
- $1,692/yr
For passive investors: Depreciation is non-cash, so a rental often shows a tax loss while cash-flowing — sheltering income. Rental losses are passive: they offset passive income freely, and up to $25,000/yr can offset ordinary (W-2) income if you actively participate and your MAGI is under $100k (phasing out to $0 by $150k); unused losses carry forward. On sale, claimed depreciation is recaptured at up to 25%, and gains may owe capital-gains tax (a 1031 exchange can defer both). Figures are a year-1 estimate at your 24.0% rate — not tax advice; consult a CPA.
Schools (NCES district)
- District
- Kerens ISD
- NCES district ID
- 4825530
- Math proficiency
- 37% ▼ -9.00%
- Reading proficiency
- 37% ▲ 3.00%
- Median HH income
- $37,364
- Composite
- 30.81/100
- National rank
- #6142
- State rank
- #495 of 826 in TX
Livability — Kerens
- Score
- 63/100
- State rank
- #866
- US rank
- #15598
Category grades
Schools grade is shown separately in the Schools card above.
Census & demographics
- Census place
- Kerens, TX
- Population (ZIP)
- 3,798
Population outlook (Navarro County) Hauer SSP2
- Today (2025)
- 48,397 people
- By 2030
- 48,096 · -0.6%
- By 2040
- 47,394 · -2.1%
- By 2050
- 46,541 · -3.8%
- By 2075
- 44,940 · -7.1%
- By 2100
- 42,288 · -12.6%
Race, ethnicity, and origin ACS 2023
- Neighborhood character
- Majority White (64%)
- Race & ethnicity
- White 64% Black 18% Hispanic / Latino 12% Two or more races 8%
- Hispanic origin (detail)
- Mexican 9%
- Common ancestry
- Lithuanian 3% Serbian 1% Italian 1%
- Foreign-born
- 5% · Canada
- Languages at home
- 92% English-only · Spanish 8%
Political lean MEDSL · Navarro
- 2024 margin
- Solid R (+51.8) · D 23.7% · R 75.6%
- 2008→2024 swing
- -18.7pp toward R · 2008: -33.1pp · 2024: -51.8pp
- All cycles
- 2024: R+51.8 2020: R+45.5 2016: R+48.8 2012: R+42.4 2008: R+33.1
Not yet ingested
- Civics
- —
Market trends
- HPI YoY
- ▲ 5.61%
- Current HPI
- 236.2915
- Rent YoY
- —
- Metro
- —
- State GDP YoY
- ▲ 3.95%
- F500 in state
- 110
Industry mix (Fortune 500 HQ in TX)
| Industry | F500 HQs | Revenue |
|---|---|---|
| Energy | 16 | $1,198B |
|
||
| Technology | 5 | $198B |
|
||
| Engineering / Construction | 4 | $72B |
|
||
| Energy Services | 3 | $60B |
|
||
| Utilities | 3 | $41B |
|
||
| Healthcare | 2 | $330B |
|
||
Price history
+69.2% since first listed13 events — show timeline
- 2026-06-05 Listed $110,000 NTREIS
- 2020-03-25 Sold (Public Records) — Public Records
- 2020-03-24 Sold (MLS) — NTREIS
- 2020-03-02 Contingent — NTREIS
- 2020-02-24 Listed $64,999 NTREIS
- 2003-04-15 Sold (Public Records) — Public Records
- 2000-02-07 Sold (Public Records) — Public Records
- 1997-02-07 Sold (Public Records) — Public Records
- 1996-10-02 Sold (Public Records) — Public Records
- 1995-02-03 Sold (Public Records) — Public Records
- 1993-01-05 Sold (Public Records) — Public Records
- 1992-09-10 Sold (Public Records) — Public Records
- 1991-02-04 Sold (Public Records) — Public Records
Property tax history
+7.5%/yrLatest (2025): $1,767 · -4.0% YoY. Source: county tax records.
Cash-flow waterfall
monthlySold comps — $/sqft
last 12 mo · ≤1 miLoading sold comps…