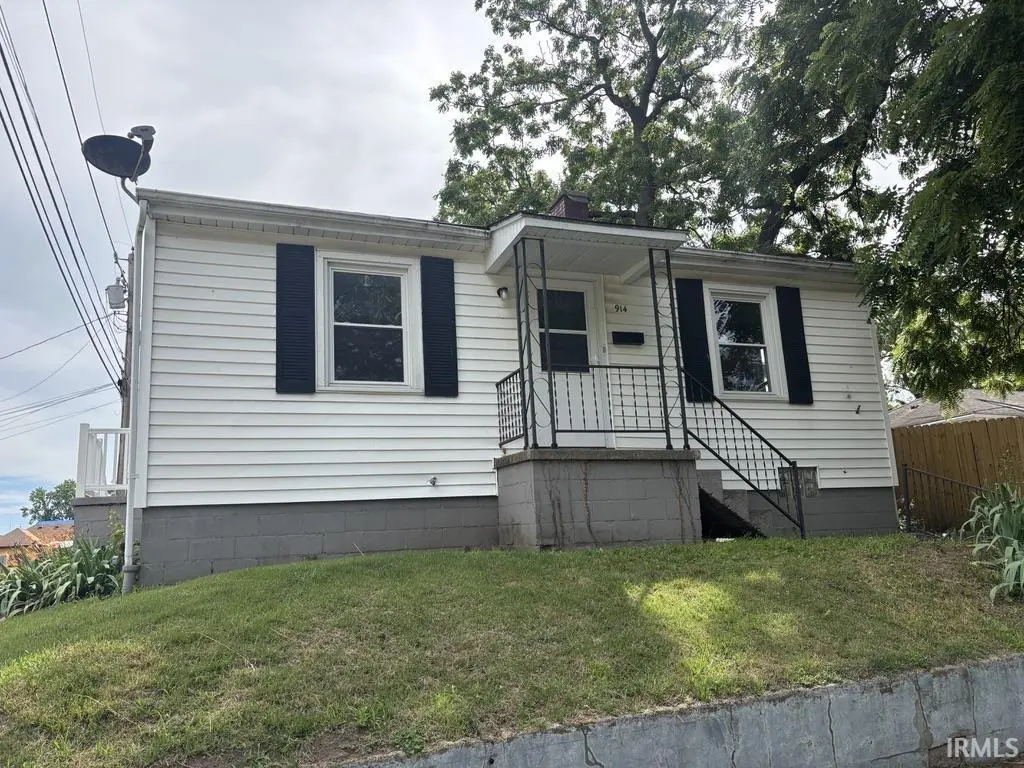
914 Bayou St · Vincennes, IN
Flood risk 1/10 · Minimal
- FEMA flood zone
- —
- Chance of flooding over 30 yrs
- 0.0%
- Est. flood insurance / yr
- —
Fire risk 1/10 · Minimal
- Est. fire insurance / yr
- $717 – $1,331
Heat risk 5/10 · Moderate
- Hot days now (above 106°F)
- 7 days/yr
- Hot days in 30 yrs
- 19 days/yr
Wind risk 2/10 · Minimal
- Chance of severe wind over 30 yrs
- 2.0%
Air-quality risk 3/10 · Minor
- Unhealthy air days now
- 2 days/yr
- Unhealthy air days in 30 yrs
- 3 days/yr
Risk factors via First Street. Map © Google.
Why this score? — see what drove the D+ grade
The composite is a weighted blend of 9 inputs, each scored 0–100. Each bar is that input's sub-score; the figure is the points it added to the 100-point composite (weight × sub-score).
- Cash flow +22.3/30.0
- DSCR +7.1/10.0
- 1% rule +5.3/10.0
- Livability +3.5/5.0
- Schools +3.0/10.0
- Rent growth +2.5/5.0
- Condition / age +2.5/5.0
- ARV discount +0.0/15.0
- Appreciation +0.0/10.0
$85,000
🖨 Deal sheet 📄 Offer letter ✓ Due diligence
Listing remarks
Enjoy the convenience of this well located 2 bedroom home situated near Good Samaritan Hospital and a neighborhood park. Featuring beautiful hardwood floors throughout, included kitchen appliances, off-street parking, and a full basement for extra storage, this home is a great opportunity for homeowners and investors alike.
Key facts
- Kitchen appliances
- Full basement
- Neighborhood park
Tags
Property features AI
Finance
- HOA & community: Sidewalks in the neighborhood
Exterior
- Parking: Gravel off-street parking
- Utilities: Public water; Public sewer
- Home design: Single-family site-built home; One story
- Construction: Vinyl siding; Full unfinished basement
- Exterior features: Covered porch; Shingle roof; Lot is level to sloped with a rectangular layout
Interior
- Kitchen: Refrigerator; Electric range
- Bathrooms: One full bathroom on the main level
- Heating & cooling: Natural gas forced-air heating; Central air conditioning
- Interior features: Refrigerator; Electric range; Gas water heater; Water heater
- Laundry & utility: Laundry located in the basement
Neighborhood map
What this means for you Summary
Snapshot
- This is a 2-bed/1.0-bath single-family listed at $85k.
Deal economics
- At list price, monthly cash flow is $139 ($2k/yr) — positive.
- The deal already cash-flows at list — no discount required.
- Meets the 1% rule at list price ($879 rent vs $85k).
- Cap rate 8.3% vs local median 5.1% in Vincennes — top-decile yield for the area; either an underpriced asset or a hidden risk that comps aren't pricing in. Stress-test before assuming the spread holds.
Location & tenants
- Location reads 70/100 on livability (#148 in IN) — a middle-class / working-renter tenant base. Strengths: cost of living A+, housing A+, health & safety A+; Watch: amenities F, commute F, employment D-.
- Vincennes Community School Corporation (town): math 34% / reading 38% proficiency, ranked #193 of 301 in IN (top 64%) — families likely to look elsewhere, expect single-tenant / working-renter base with shorter leases.
- Zoned schools: Francis Vigo Elementary School (math 52% / reading 37%, grade F, #379 of 994 statewide, top 41%, 347 students, 62% FRL); George Rogers Clark School (math 27% / reading 34%, grade F, #203 of 330 statewide, top 63%, 609 students, 57% FRL); Lincoln High School (math 27% / reading 47%, grade F, #247 of 369 statewide, top 70%, 765 students, 55% FRL) — zoned schools at 58% FRL track the district average.
- Market conditions: 136 active listings in the ZIP; 36 units permitted in Knox County in 2024 (0 in 5+ unit buildings).
Forward outlook
- Local home prices are declining (-3.0%/yr); year-one equity from $588 of loan paydown is wiped out by about $3k of value loss. Plan a longer hold.
- Knox County population projected at -13% by 2050 — secular population decline; favor cash flow + early exit over multi-decade hold.
Negotiation context
- Only 2 days on market — expect competitive offers; lowballing is unlikely to land.
- 2 sale attempts since 7y ago with the ask held roughly flat each time — persistent listings suggest the price (not the market) is what's stuck; bring a comps-based counter.
- Current owner paid $40k; list at $85k implies a 112% gain — meaningful room to come down on a strong offer.
Risks & watch-outs
- Watch-outs: built in 1946 — expect roof / HVAC / electrical / plumbing capex.
- Climate carrying-cost: extreme-heat days projected 7→19/yr by 2055 (HVAC capex compounding) — expect insurance premiums to compound above CPI over the hold.
Questions for the listing agent
- Built in 1946 — when were the roof, HVAC, electrical panel, plumbing, and water heater last replaced?
- Is there a deadline driving the sale (1031 exchange, divorce, estate, relocation)? That informs how much negotiation room exists.
- Schools are D-rated, which usually means shorter tenancies and higher turnover. Who's the typical renter profile here, and what's been the actual vacancy rate?
- The area grade is low — what's the realistic commute time and amenity access for the typical tenant pool here? Any planned neighborhood developments (good or bad) we should know about?
- What's the average days-on-market for RENTAL listings here right now (not sales)? A rising rental-DOM trend means longer vacancies and softer asking-rent achievability than the comps imply.
- What's the recent tenant-quality profile in this submarket — average credit score on applications, eviction rate, late-payment / NSF rate, and stable-employment percentage? A property-management company in the area should have these aggregated.
- How much new for-sale + rental construction is in the pipeline within 1–3 miles? Heavy new supply typically softens prices + rents 12–24 months out; constrained supply supports both.
Investment metrics
- 1% rule
- 1.03% ✓
- Cap rate
- 8.26%
- Cash-on-cash
- 7.02%
- DSCR
- 1.31
- GRM
- 8.1
CMA / ARV
- ARV (on-the-fly)
- $65,520
- Comps found
- 9
Show comp detail 9 sales within ~0.75 mi
| Address | Dist | Beds/Ba | Sqft | Sold | Price | $/sf | Match |
|---|---|---|---|---|---|---|---|
| 1022 Barnett St | 0.18mi | 1/1.0 (-1) | 773 (+7%) | 2mo | $89,500 | $116 | 72 |
| 1322 Vigo St | 0.46mi | 2/1.0 | 784 (+9%) | 18mo | $56,000 | $71 | 49 |
| 1320 Perry St | 0.69mi | 1/1.0 (-1) | 768 (+7%) | 4mo | $28,000 | $36 | 48 |
| 404 S 12 1/2 St | 0.25mi | 1/1.0 (-1) | 616 (-14%) | 14mo | $35,000 | $57 | 48 |
| 1523 Vigo St | 0.59mi | 2/1.0 | 768 (+7%) | 18mo | $70,000 | $91 | 47 |
| 117 N 14th St | 0.60mi | 2/1.0 | 814 (+13%) | 7mo | $122,500 | $150 | 44 |
| 1325 Hart St | 0.74mi | 2/1.0 | 768 (+7%) | 14mo | $72,500 | $94 | 43 |
| 1612 Parkinson St | 0.60mi | 1/1.0 (-1) | 696 (-3%) | 24mo | $43,500 | $63 | 42 |
| 1328 Parkinson St | 0.37mi | 3/1.0 (+1) | 816 (+13%) | 21mo | $124,900 | $153 | 38 |
Match score weights: distance 35% · size 25% · config 20% · recency 20%. Top-matched comps best support the ARV.
Projected returns pro-forma
-3.0% appreciation · 3.0% rent growth · sell at horizon
- IRR
- -5.5%
- Equity multiple
- 0.79×
- Total profit
- $-4,910
- Equity at exit
- $12,674
- IRR
- 4.1%
- Equity multiple
- 1.30×
- Total profit
- $7,119
- Equity at exit
- $7,349
Cash invested: $23,800 (down + closing). Projections, not guarantees.
Landlord ↔ Tenant lean methodology
- Overall (STATE)
- 90 Strongly Landlord-Friendly
- State Indiana
- 90 Strongly Landlord-Friendly · R+11
- County
- — inherits STATE
- City
- — inherits STATE
ZIP-level market 47591
- Home prices YoY
- -19.5%
- Active inventory
- 136
- Price-to-rent
- 8.1×
Monthly cashflow live
- Estimated rent
- $879 medium interval (Pro) →
- Mortgage (P&I)
- −$446
- Tax from tax record
- −$74 /mo · $889/yr
- Insurance
- −$35
- HOA
- −$0
- Vacancy / Maint / Mgmt
- −$185
- Net cashflow
- $139
Break-even live
UW: 25.0% down · 7.5% · 30yr · 1.5% tax · 5.0% vac · 8.0% maint · 8.0% mgmt
Financing live
Cash to close
- Down payment
- $21,250
- Closing costs
- $2,550
- Reserves months
- —
- Total cash needed
- —
Loan-product check · same deal, 3 products live
Conventional
25% down · 7.5% · 30yr
- Down + closing
- —
- Monthly P&I
- —
- Monthly cashflow
- —
- DSCR
- —
- Eligible?
- —
Personal DTI + credit; lowest rate.
DSCR
20% down · 8.5% · 30yr
- Down + closing
- —
- Monthly P&I
- —
- Monthly cashflow
- —
- DSCR
- —
- Eligible?
- —
No personal income docs; deal must DSCR.
Hard money
10% down · 12.0% · 12mo
- Down + closing
- —
- Monthly P&I
- —
- Monthly cashflow
- —
- DSCR
- —
- Eligible?
- —
Short-term bridge; refi at stabilization.
Listing history 3 events
-
2026-06-18days on market $85,000 Active 2 DOM
-
2026-06-17remarks 325-char remark
-
2026-06-17$85,000 Active 1 DOM
ⓘ Source: listings_history table (triggers on properties + properties_extension) + one-shot
backfill from property_details.listing_events for pre-trigger history.
Tax reassessment forecast IN · Partial reset (capped growth)
- Current annual tax
- $889 · $74/mo
- Projected year-2 tax
- $889 · $74/mo
- Expected delta
- $0/yr ($0/mo · 0.0%)
ⓘ Screening estimate from a state-policy table — verify with the county assessor before closing.
Climate risk First Street
- Flood 1/10 Low 0% chance over 30 yrs
- Wildfire 1/10 Low
- Heat 5/10 Major 7 d/yr ≥106°F today · 19 d/yr by 30 yrs out
- Wind 2/10 Low 2% chance of damaging wind over 30 yrs
- Air quality 3/10 Moderate 2 unhealthy d/yr today · 3 by 30 yrs out
Nearby sold comps map
Loading sold comps map…
Walkable amenities ~0.75 mi
Loading nearby amenities…
Taxation est. · year 1
- Rental income
- $10,549
- − Mortgage interest
- −$4,761
- − Property taxes
- −$889
- − Insurance
- −$425
- − Repairs & maintenance
- −$844
- − Management
- −$844
- − Depreciation
- −$2,473
- Taxable income
- $314
- Est. tax owed @ 24.0%
- −$75
- After-tax cash flow
- $1,596/yr
For passive investors: Depreciation is non-cash, so a rental often shows a tax loss while cash-flowing — sheltering income. Rental losses are passive: they offset passive income freely, and up to $25,000/yr can offset ordinary (W-2) income if you actively participate and your MAGI is under $100k (phasing out to $0 by $150k); unused losses carry forward. On sale, claimed depreciation is recaptured at up to 25%, and gains may owe capital-gains tax (a 1031 exchange can defer both). Figures are a year-1 estimate at your 24.0% rate — not tax advice; consult a CPA.
Schools (NCES district)
- District
- Vincennes Community School Corporation
- NCES district ID
- 1812120
- Math proficiency
- 34% ▼ -5.00%
- Reading proficiency
- 38% ▼ -4.00%
- Median HH income
- $38,359
- Composite
- 30.05/100
- National rank
- #6354
- State rank
- #193 of 301 in IN
Livability — Vincennes
- Score
- 70/100
- State rank
- #148
- US rank
- #7480
Category grades
Schools grade is shown separately in the Schools card above.
Census & demographics
- Census place
- Vincennes, IN
- Population (ZIP)
- 25,191
Population outlook (Knox County) Hauer SSP2
- Today (2025)
- 37,092 people
- By 2030
- 36,271 · -2.2%
- By 2040
- 34,196 · -7.8%
- By 2050
- 32,405 · -12.6%
- By 2075
- 28,754 · -22.5%
- By 2100
- 24,110 · -35.0%
Race, ethnicity, and origin ACS 2023
- Neighborhood character
- Predominantly White (88%)
- Race & ethnicity
- White 88% Two or more races 6% Hispanic / Latino 3% Black 2% Asian 1%
- Common ancestry
- Lithuanian 4% Romanian 2% Slovak 2%
- Foreign-born
- 3% · Canada, China
- Languages at home
- 95% English-only · Spanish 2% French/Haitian/Cajun 1% Chinese 1%
Political lean MEDSL · Knox
- 2024 margin
- Solid R (+50.4) · D 24.0% · R 74.4% · Other 1.6%
- 2008→2024 swing
- -43.9pp toward R · 2008: -6.5pp · 2024: -50.4pp
- All cycles
- 2024: R+50.4 2020: R+47.4 2016: R+47.2 2012: R+28.9 2008: R+6.5
Not yet ingested
- Civics
- —
Market trends
- HPI YoY
- ▼ -47.26%
- Current HPI
- 194.903
- Rent YoY
- —
- Metro
- —
- State GDP YoY
- ▲ 2.90%
- F500 in state
- 18
Industry mix (Fortune 500 HQ in IN)
| Industry | F500 HQs | Revenue |
|---|---|---|
| Industrial Machinery | 2 | $37B |
|
||
| Healthcare | 1 | $177B |
|
||
| Pharmaceuticals | 1 | $45B |
|
||
| Metals / Steel | 1 | $18B |
|
||
| Agriculture | 1 | $17B |
|
||
| Packaging | 1 | $12B |
|
||
Price history
+112.5% since first listed3 events — show timeline
- 2026-06-16 Listed $85,000 IRMLS
- 2019-07-01 Sold (MLS) $40,000 IRMLS
- 2019-07-01 Listed $40,000 IRMLS
Property tax history
-2.4%/yrLatest (2024): $889 · +3.7% YoY. Source: county tax records.
Cash-flow waterfall
monthlySold comps — $/sqft
last 12 mo · ≤1 miLoading sold comps…