93 2nd Ave · Midway, GA
Flood risk 1/10 · Minimal
- FEMA flood zone
- X (unshaded)
- Chance of flooding over 30 yrs
- 0.0%
- Est. flood insurance / yr
- $507 – $1,088
Fire risk 5/10 · Moderate
- Est. fire insurance / yr
- $963 – $1,789
Heat risk 9/10 · Severe
- Hot days now (above 109°F)
- 7 days/yr
- Hot days in 30 yrs
- 18 days/yr
Wind risk 8/10 · Major
- Chance of severe wind over 30 yrs
- 99.0%
Air-quality risk 2/10 · Minimal
- Unhealthy air days now
- 2 days/yr
- Unhealthy air days in 30 yrs
- 2 days/yr
Risk factors via First Street. Map © Google.
Why this score? — see what drove the B- grade
The composite is a weighted blend of 9 inputs, each scored 0–100. Each bar is that input's sub-score; the figure is the points it added to the 100-point composite (weight × sub-score).
- Cash flow +30.0/30.0
- DSCR +10.0/10.0
- 1% rule +9.5/10.0
- ARV discount +6.8/15.0
- Livability +3.2/5.0
- Rent growth +2.5/5.0
- Condition / age +2.5/5.0
- Schools +2.0/10.0
- Appreciation +0.0/10.0
$136,500
🖨 Deal sheet (PDF) 📄 Offer letter ✓ Due diligence
Listing remarks
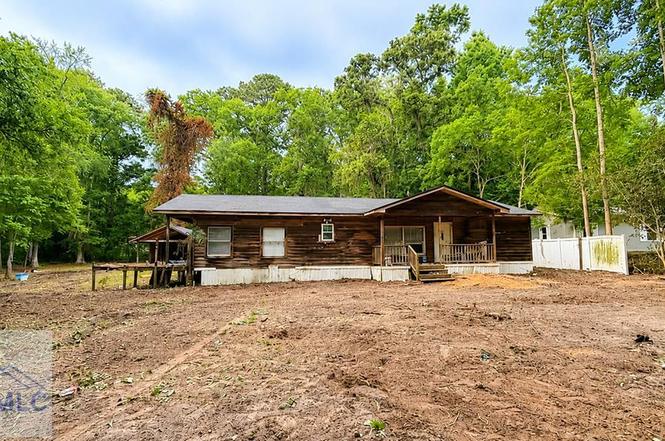
Opportunity awaits with this 3-bedroom, 2-bath manufactured home situated on approximately 0.46 acres in the established Woodland Lakes community of Hinesville. Surrounded by mature trees and offering a peaceful setting, this property is ready for a complete renovation and presents potential for investors, flippers, landlords, or buyers looking for a project. The home features approximately 1,344 square feet, covered porch areas, detached storage structures, and a spacious lot with room to improve and customize. Interior renovations have been started but remain unfinished. The property is being sold strictly AS-IS, with no repairs to be made by the seller. Cash or renovation financing may b
Key facts
- Spacious lot
- Covered porch areas
- Interior renovations
Tags
Property features AI
Finance
- Other: Property type: Residential single family residence
Exterior
- Parking: Unpaved parking
- Utilities: Electric on property; electricity available and connected; Water available
- Home design: Manufactured house; One level; Under construction
- Construction: Wood siding and frame construction; Raised foundation; Shingle roof; Built as manufactured home
- Exterior features: Partial fencing; Outbuilding; Cleared, level, and wooded lot; Gravel road access
Interior
- Bathrooms: 2 full bathrooms
- Interior features: Pantry; Storage
- Laundry & utility: Washer hookup
Neighborhood map
What this means for you Summary
Snapshot
- This is a 3-bed/2.0-bath manufactured listed at $136k.
Deal economics
- At list price, monthly cash flow is $742 ($9k/yr) — positive.
- The deal already cash-flows at list — no discount required.
- Meets the 1% rule at list price ($2k rent vs $136k).
- Cap rate 12.8% vs local median 4.3% in Midway — top-decile yield for the area; either an underpriced asset or a hidden risk that comps aren't pricing in. Stress-test before assuming the spread holds.
Location & tenants
- Location reads 65/100 on livability (#219 in GA) — a middle-class / working-renter tenant base. Strengths: crime A+, cost of living A+, housing A+; Watch: schools D-, amenities F, commute F.
- Liberty County (urban): math 19% / reading 28% proficiency, ranked #133 of 174 in GA (top 76%) — low school quality limits family demand, transient renter base, plan for 1-2y turnover.
- Market conditions: 213 active listings in the ZIP; solid renter incomes; 471 units permitted in Liberty County in 2024 (0 in 5+ unit buildings).
- This rent runs 31% of the median local income ($77k/yr) — at the standard rent-burdened threshold; future hikes will face affordability resistance.
Forward outlook
- Local home prices are declining (-3.0%/yr); year-one equity from $944 of loan paydown is wiped out by about $4k of value loss. Plan a longer hold.
- Liberty County population projected to shrink 8% by 2050 — rents likely to lag national; underwrite the cash flow, not the appreciation.
- At projected returns (-3.0% appreciation + 3.0% rent growth), your $38k cash investment doubles in ~6 years — after that, you're playing with house money.
Negotiation context
- Only 2 days on market — expect competitive offers; lowballing is unlikely to land.
Risks & watch-outs
- Climate carrying-cost: severe wind risk, 99% chance of damaging wind over 30y; moderate wildfire risk; extreme-heat days projected 7→18/yr by 2055 (HVAC capex compounding) — expect insurance premiums to compound above CPI over the hold.
Questions for the listing agent
- Built in 1976 — when were the roof, HVAC, electrical panel, plumbing, and water heater last replaced?
- Is there a deadline driving the sale (1031 exchange, divorce, estate, relocation)? That informs how much negotiation room exists.
- Schools are D-rated, which usually means shorter tenancies and higher turnover. Who's the typical renter profile here, and what's been the actual vacancy rate?
- What's the average days-on-market for RENTAL listings here right now (not sales)? A rising rental-DOM trend means longer vacancies and softer asking-rent achievability than the comps imply.
- What's the recent tenant-quality profile in this submarket — average credit score on applications, eviction rate, late-payment / NSF rate, and stable-employment percentage? A property-management company in the area should have these aggregated.
- How much new for-sale + rental construction is in the pipeline within 1–3 miles? Heavy new supply typically softens prices + rents 12–24 months out; constrained supply supports both.
Investment metrics
- 1% rule
- 1.45% ✓
- Cap rate
- 12.82%
- Cash-on-cash
- 23.30%
- DSCR
- 2.04
- GRM
- 5.7
CMA / ARV
- ARV (on-the-fly)
- $134,400
- Comps found
- 3
Show comp detail 3 sales within ~0.75 mi
| Address | Dist | Beds/Ba | Sqft | Sold | Price | $/sf | Match |
|---|---|---|---|---|---|---|---|
| 357 Wild Heron Dr | 0.17mi | 3/2.0 | 1,440 (+7%) | 11mo | $100,000 | $69 | 72 |
| 204 Clubhouse Dr | 0.36mi | 3/2.0 | 1,350 (+0%) | 18mo | $214,900 | $159 | 68 |
| 370 Wild Heron Dr | 0.24mi | 2/2.0 (-1) | 1,300 (-3%) | 15mo | $130,000 | $100 | 66 |
Match score weights: distance 35% · size 25% · config 20% · recency 20%. Top-matched comps best support the ARV.
Projected returns pro-forma
-3.0% appreciation · 3.0% rent growth · sell at horizon
- IRR
- 16.3%
- Equity multiple
- 1.66×
- Total profit
- $25,102
- Equity at exit
- $20,353
- IRR
- 24.9%
- Equity multiple
- 3.16×
- Total profit
- $82,542
- Equity at exit
- $11,802
Cash invested: $38,220 (down + closing). Projections, not guarantees.
Landlord ↔ Tenant lean methodology
- Overall (STATE)
- 90 Strongly Landlord-Friendly
- State Georgia
- 90 Strongly Landlord-Friendly · R+3
- County
- — inherits STATE
- City
- — inherits STATE
ZIP-level market 31320
- Home prices YoY
- -9.7%
- Active inventory
- 213
- Price-to-rent
- 5.7×
Monthly cashflow live
- Estimated rent
- $1,983 medium interval (Pro) →
- Mortgage (P&I)
- −$716
- Tax from tax record
- −$51 /mo · $618/yr
- Insurance
- −$57
- HOA
- −$0
- Vacancy / Maint / Mgmt
- −$416
- Net cashflow
- $742
Break-even live
Sensitivity live
| Price | -10% $819 | -5% $781 | +0% $742 | +5% $703 | +10% $665 |
|---|---|---|---|---|---|
| Rent | -10% $585 | -5% $664 | +0% $742 | +5% $820 | +10% $899 |
| Rate | -1.0pp $811 | -0.5pp $777 | base $742 | +0.5pp $707 | +1.0pp $671 |
UW: 25.0% down · 7.5% · 30yr · 1.5% tax · 5.0% vac · 8.0% maint · 8.0% mgmt
Financing live
Cash to close
- Down payment
- $34,125
- Closing costs
- $4,095
- Reserves months
- —
- Total cash needed
- —
Loan-product check · same deal, 3 products live
Conventional
25% down · 7.5% · 30yr
- Down + closing
- —
- Monthly P&I
- —
- Monthly cashflow
- —
- DSCR
- —
- Eligible?
- —
Personal DTI + credit; lowest rate.
DSCR
20% down · 8.5% · 30yr
- Down + closing
- —
- Monthly P&I
- —
- Monthly cashflow
- —
- DSCR
- —
- Eligible?
- —
No personal income docs; deal must DSCR.
Hard money
10% down · 12.0% · 12mo
- Down + closing
- —
- Monthly P&I
- —
- Monthly cashflow
- —
- DSCR
- —
- Eligible?
- —
Short-term bridge; refi at stabilization.
Listing history 3 events
-
2026-06-21days on market $136,500 Active 2 DOM
-
2026-06-19remarks 699-char remark
-
2026-06-19$136,500 Active 1 DOM
ⓘ Source: listings_history table (triggers on properties + properties_extension) + one-shot
backfill from property_details.listing_events for pre-trigger history.
Tax reassessment forecast GA · Resets to sale price
- Current annual tax
- $618 · $51/mo
- Projected year-2 tax
- $1,256 · $105/mo
- Expected delta
- +$638/yr (+$53/mo · 103.3%)
ⓘ Screening estimate from a state-policy table — verify with the county assessor before closing.
Climate risk First Street
- Flood 1/10 Low FEMA zone X (unshaded) · 0% chance over 30 yrs
- Wildfire 5/10 Major
- Heat 9/10 Extreme 7 d/yr ≥109°F today · 18 d/yr by 30 yrs out
- Wind 8/10 Severe 99% chance of damaging wind over 30 yrs
- Air quality 2/10 Low 2 unhealthy d/yr today · 2 by 30 yrs out
Nearby sold comps map
Loading sold comps map…
Walkable amenities ~0.75 mi
Loading nearby amenities…
Taxation est. · year 1
- Rental income
- $23,791
- − Mortgage interest
- −$7,646
- − Property taxes
- −$618
- − Insurance
- −$682
- − Repairs & maintenance
- −$1,903
- − Management
- −$1,903
- − Depreciation
- −$3,971
- Taxable income
- $7,067
- Est. tax owed @ 24.0%
- −$1,696
- After-tax cash flow
- $7,209/yr
For passive investors: Depreciation is non-cash, so a rental often shows a tax loss while cash-flowing — sheltering income. Rental losses are passive: they offset passive income freely, and up to $25,000/yr can offset ordinary (W-2) income if you actively participate and your MAGI is under $100k (phasing out to $0 by $150k); unused losses carry forward. On sale, claimed depreciation is recaptured at up to 25%, and gains may owe capital-gains tax (a 1031 exchange can defer both). Figures are a year-1 estimate at your 24.0% rate — not tax advice; consult a CPA.
Schools (NCES district)
- District
- Liberty County
- NCES district ID
- 1303300
- Math proficiency
- 19% ▼ -16.00%
- Reading proficiency
- 28% ▼ -13.00%
- Median HH income
- $43,911
- Composite
- 20.2/100
- National rank
- #8630
- State rank
- #133 of 174 in GA
Livability — Midway
- Score
- 65/100
- State rank
- #219
- US rank
- #12952
Category grades
Schools grade is shown separately in the Schools card above.
Census & demographics
- County
- Liberty County · 58,565 people
- City population
- 10,794
- Metro
- Hinesville, GA
- Population (ZIP)
- 10,794
- Household income
- $77,195
- Rent vs Own
- Severe rent burden
- 136.0
Population outlook (Liberty County) Hauer SSP2
- Today (2025)
- 58,689 people
- By 2030
- 57,670 · -1.7%
- By 2040
- 55,750 · -5.0%
- By 2050
- 54,155 · -7.7%
- By 2075
- 58,947 · +0.4%
- By 2100
- 66,919 · +14.0%
Race, ethnicity, and origin ACS 2023
- Neighborhood character
- Diverse neighborhood (Simpson 0.57)
- Race & ethnicity
- White 56% Black 33% Two or more races 8% Hispanic / Latino 5%
- Hispanic origin (detail)
- Mexican 1% Puerto Rican 3%
- Common ancestry
- Italian 2% Slovak 2% Lithuanian 1%
- Foreign-born
- 2% · Canada
- Languages at home
- 96% English-only · Spanish 3% German/W. Germanic 1%
Political lean MEDSL · Liberty
- 2024 margin
- D (+17.4) · D 58.5% · R 41.0%
- 2008→2024 swing
- -10.9pp toward R · 2008: 28.4pp · 2024: 17.4pp
- All cycles
- 2024: D+17.4 2020: D+24.1 2016: D+21.2 2012: D+30.2 2008: D+28.4
Not yet ingested
- Civics
- —
Market trends
- HPI YoY
- ▼ -25.67%
- Current HPI
- 239.3136
- Rent YoY
- —
- Metro
- Hinesville, GA
- State GDP YoY
- ▲ 2.66%
- F500 in state
- 28
Industry mix (Fortune 500 HQ in GA)
| Industry | F500 HQs | Revenue |
|---|---|---|
| Paper / Packaging | 2 | $29B |
|
||
| Retail | 1 | $160B |
|
||
| Transportation / Logistics | 1 | $91B |
|
||
| Airlines | 1 | $62B |
|
||
| Consumer Goods | 1 | $47B |
|
||
| Utilities | 1 | $25B |
|
||
Price history
1 event — show timeline
- 2026-06-19 Listed $136,500 HABR
Property tax history
+6.1%/yrLatest (2025): $618 · +109.9% YoY. Source: county tax records.
Cash-flow waterfall
monthlySold comps — $/sqft
last 12 mo · ≤1 miLoading sold comps…