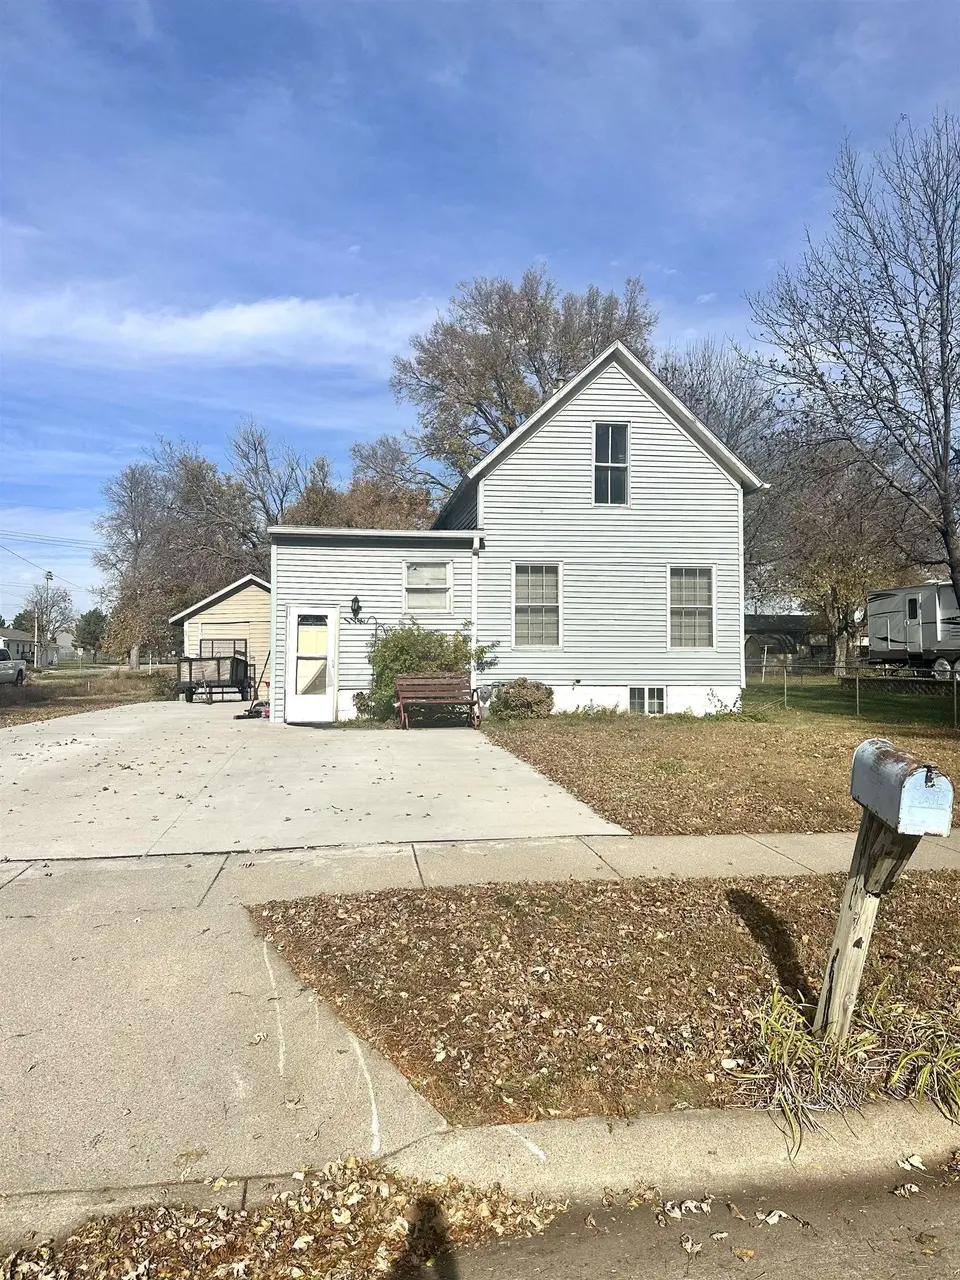
114 Cedar Ave · Norfolk, NE
Flood risk 1/10 · Minimal
- FEMA flood zone
- X (unshaded)
- Chance of flooding over 30 yrs
- 0.0%
- Est. flood insurance / yr
- $473 – $860
Fire risk 3/10 · Minor
- Est. fire insurance / yr
- $1,161 – $2,155
Heat risk 3/10 · Minor
- Hot days now (above 102°F)
- 7 days/yr
- Hot days in 30 yrs
- 15 days/yr
Wind risk 2/10 · Minimal
- Chance of severe wind over 30 yrs
- —
Air-quality risk 2/10 · Minimal
- Unhealthy air days now
- 1 days/yr
- Unhealthy air days in 30 yrs
- 1 days/yr
Risk factors via First Street. Map © Google.
Why this score? — see what drove the B grade
The composite is a weighted blend of 9 inputs, each scored 0–100. Each bar is that input's sub-score; the figure is the points it added to the 100-point composite (weight × sub-score).
- Cash flow +30.0/30.0
- ARV discount +12.4/15.0
- DSCR +10.0/10.0
- 1% rule +9.0/10.0
- Livability +3.9/5.0
- Schools +3.8/10.0
- Rent growth +3.3/5.0
- Condition / age +2.5/5.0
- Appreciation +0.0/10.0
$155,000
🖨 Deal sheet 📄 Offer letter ✓ Due diligence
Listing remarks MLS
Nestled at 114 W Cedar, this affordable home features two bedrooms upstairs primary bedroom on the main floor and a single bath with main floor laundry. wood deck, ample outdoor space and recently replaced driveway.
Key facts
- Ample outdoor space
- Wood deck
- Built 1915
Tags
Neighborhood map
What this means for you Summary
Snapshot
- This is a 3-bed/2.0-bath single-family listed at $155k.
Deal economics
- At list price, monthly cash flow is $755 ($9k/yr) — positive.
- The deal already cash-flows at list — no discount required.
- Meets the 1% rule at list price ($2k rent vs $155k).
- Recommended offer: $136k (12.0% below list) — sets the bar for market timing.
- Cap rate 12.1% vs local median 3.2% in Norfolk — top-decile yield for the area; either an underpriced asset or a hidden risk that comps aren't pricing in. Stress-test before assuming the spread holds.
Location & tenants
- Location reads 78/100 on livability (#54 in NE, #2,611 nationally) — a middle-class / working-renter tenant base. Strengths: cost of living A+, housing A+, health & safety A+; Watch: employment C-, amenities F, commute F.
- Norfolk Public Schools (town): math 44% / reading 46% proficiency, ranked #84 of 111 in NE (top 76%) — families likely to look elsewhere, expect single-tenant / working-renter base with shorter leases.
- Market conditions: Rents rising (+3.3%/yr); 230 active listings in the ZIP; 3 comparable units currently listed for rent nearby; rentals at typical pace (median 23d on market — plan ~3-4 weeks tenant-placement turnaround); 270 units permitted in Madison County in 2024 (196 in 5+ unit buildings).
- This rent runs 42% of the median local income ($63k/yr) — at the standard rent-burdened threshold; future hikes will face affordability resistance.
Forward outlook
- Local home prices are declining (-3.0%/yr); year-one equity from $1k of loan paydown is wiped out by about $5k of value loss. Plan a longer hold.
- At projected returns (-3.0% appreciation + 3.3% rent growth), your $43k cash investment doubles in ~6 years — after that, you're playing with house money.
Negotiation context
- It's been on market 566 days — a 12% lower offer ($136k) is reasonable based on typical stale-listing flexibility.
- 2 sale attempts since 2y ago; this cycle's ask has dropped $30k (16%) from the opening price — seller is motivated, your offer sets the floor, not the list.
Risks & watch-outs
- Watch-outs: built in 1915 — expect roof / HVAC / electrical / plumbing capex.
Questions for the listing agent
- It's been on market 566 days. Have you received any prior offers? Is the seller open to a 12% concession, seller financing, or rate buy-down credit?
- Built in 1915 — when were the roof, HVAC, electrical panel, plumbing, and water heater last replaced?
- Why hasn't it sold? Are there any deal-killer items the seller is aware of (foundation, flood, title, zoning, code violations)?
- Is there a deadline driving the sale (1031 exchange, divorce, estate, relocation)? That informs how much negotiation room exists.
- Schools are B-rated — typically a magnet for longer-tenancy family renters. What's the average tenant stay here, and is there a school-zone premium baked into asking?
- What's the average days-on-market for RENTAL listings here right now (not sales)? A rising rental-DOM trend means longer vacancies and softer asking-rent achievability than the comps imply.
- What's the recent tenant-quality profile in this submarket — average credit score on applications, eviction rate, late-payment / NSF rate, and stable-employment percentage? A property-management company in the area should have these aggregated.
- How much new for-sale + rental construction is in the pipeline within 1–3 miles? Heavy new supply typically softens prices + rents 12–24 months out; constrained supply supports both.
Investment metrics
- 1% rule
- 1.40% ✓
- Cap rate
- 12.14%
- Cash-on-cash
- 20.89%
- DSCR
- 1.93
- GRM
- 5.9
CMA / ARV
- ARV (median comp)
- $174,000
- List price
- $155,000
- Delta
- -10.92%
- Verdict
- UNDERPRICED
- Comps
- 20 within 1.0 mi
Show comp detail 12 sales within ~0.75 mi
| Address | Dist | Beds/Ba | Sqft | Sold | Price | $/sf | Match |
|---|---|---|---|---|---|---|---|
| 601 Oak St | 0.25mi | 4/2.0 (+1) | 1,560 (-1%) | 9mo | $253,000 | $162 | 74 |
| 200 Cedar Ave | 0.03mi | 3/1.0 | 1,754 (+11%) | 9mo | $170,000 | $97 | 68 |
| 203 Maple Ave | 0.17mi | 4/2.0 (+1) | 1,728 (+10%) | 16mo | $232,500 | $135 | 57 |
| 105 Klug Ave | 0.34mi | 3/1.0 | 1,661 (+5%) | 20mo | $179,000 | $108 | 55 |
| 1007 N 8th St | 0.51mi | 3/2.0 | 1,472 (-7%) | 14mo | $206,000 | $140 | 53 |
| 703 Spruce Ave | 0.47mi | 4/1.0 (+1) | 1,591 (+1%) | 19mo | $210,000 | $132 | 51 |
| 906 Harrison Ave | 0.69mi | 3/1.0 | 1,684 (+7%) | 2mo | $215,000 | $128 | 50 |
| 703 Hespe Dr | 0.61mi | 2/2.0 (-1) | 1,476 (-6%) | 8mo | $253,000 | $171 | 50 |
| 1010 7th St | 0.42mi | 3/2.0 | 1,440 (-9%) | 23mo | $262,500 | $182 | 46 |
| 401 Hespe Dr | 0.63mi | 2/2.0 (-1) | 1,431 (-9%) | 13mo | $235,000 | $164 | 39 |
| 904 Larayne Ln | 0.74mi | 2/2.0 (-1) | 1,399 (-11%) | 8mo | $235,000 | $168 | 36 |
| 1200 Queen City Blvd | 0.64mi | 2/2.0 (-1) | 1,731 (+10%) | 18mo | $172,500 | $100 | 34 |
Match score weights: distance 35% · size 25% · config 20% · recency 20%. Top-matched comps best support the ARV.
Projected returns pro-forma
-3.0% appreciation · 3.31% rent growth · sell at horizon
- IRR
- 13.6%
- Equity multiple
- 1.54×
- Total profit
- $23,641
- Equity at exit
- $23,111
- IRR
- 22.6%
- Equity multiple
- 2.96×
- Total profit
- $85,204
- Equity at exit
- $13,402
Cash invested: $43,400 (down + closing). Projections, not guarantees.
Landlord ↔ Tenant lean methodology
- Overall (STATE)
- 83 Strongly Landlord-Friendly
- State Nebraska
- 83 Strongly Landlord-Friendly · R+13
- County
- — inherits STATE
- City
- — inherits STATE
ZIP-level market 68701
- Rents YoY
- 3.3%
- Active inventory
- 230
- Price-to-rent
- 5.9×
Monthly cashflow live
- Estimated rent
- $2,172 medium interval (Pro) →
- Mortgage (P&I)
- −$813
- Tax from tax record
- −$83 /mo · $1,000/yr
- Insurance
- −$65
- HOA
- −$0
- Vacancy / Maint / Mgmt
- −$456
- Net cashflow
- $755
Break-even live
UW: 25.0% down · 7.5% · 30yr · 1.5% tax · 5.0% vac · 8.0% maint · 8.0% mgmt
Financing live
Cash to close
- Down payment
- $38,750
- Closing costs
- $4,650
- Reserves months
- —
- Total cash needed
- —
Loan-product check · same deal, 3 products live
Conventional
25% down · 7.5% · 30yr
- Down + closing
- —
- Monthly P&I
- —
- Monthly cashflow
- —
- DSCR
- —
- Eligible?
- —
Personal DTI + credit; lowest rate.
DSCR
20% down · 8.5% · 30yr
- Down + closing
- —
- Monthly P&I
- —
- Monthly cashflow
- —
- DSCR
- —
- Eligible?
- —
No personal income docs; deal must DSCR.
Hard money
10% down · 12.0% · 12mo
- Down + closing
- —
- Monthly P&I
- —
- Monthly cashflow
- —
- DSCR
- —
- Eligible?
- —
Short-term bridge; refi at stabilization.
Rent comps 3 comps
| Address | Beds | Baths | Sqft | Rent | $/sqft | DOM | Units | Dist |
|---|---|---|---|---|---|---|---|---|
| 1401 Lakewood Dr Norfolk, NE | 2.0–3.0 | 1.0–1.5 | 937 | $1,345 | $1.43 | 23d | 2 | 0.63mi |
| 1007 E Maple Ave Norfolk, NE | 3.0 | 2.0 | 2050 | $3,595 | $1.75 | 23d | 1 | 0.76mi |
| 1208 Koenigstein Ave Norfolk, NE | 3.0 | 1.5 | 1140 | $2,200 | $1.93 | 43d | 1 | 0.99mi |
Listing history 21 events
-
2026-06-19days on market $155,000 Active 566 DOM
-
2026-06-18days on market $155,000 Active 565 DOM
-
2026-06-17days on market $155,000 Active 564 DOM
-
2026-06-16days on market $155,000 Active 563 DOM
-
2026-06-15days on market $155,000 Active 562 DOM
-
2026-06-14days on market $155,000 Active 560 DOM
-
2026-06-12days on market $155,000 Active 559 DOM
-
2026-06-09days on market $155,000 Active 556 DOM
-
2026-06-08days on market $155,000 Active 555 DOM
-
2026-06-07days on market $155,000 Active 554 DOM
-
2026-06-05days on market $155,000 Active 551 DOM
-
2026-06-03days on market $155,000 Active 550 DOM
-
2026-06-02days on market $155,000 Active 549 DOM
-
2026-06-01days on market $155,000 Active 548 DOM
-
2026-05-31days on market $155,000 Active 547 DOM
-
2026-05-30days on market $155,000 Active 546 DOM
-
2025-08-22status Active 215-char remark
Show marketing remark (215 chars)
Nestled at 114 W Cedar, this affordable home features two bedrooms upstairs primary bedroom on the main floor and a single bath with main floor laundry. wood deck, ample outdoor space and recently replaced driveway.
-
2025-08-01historical 215-char remark
Show marketing remark (215 chars)
Nestled at 114 W Cedar, this affordable home features two bedrooms upstairs primary bedroom on the main floor and a single bath with main floor laundry. wood deck, ample outdoor space and recently replaced driveway.
-
2025-07-24price $155,000 215-char remark
Show marketing remark (215 chars)
Nestled at 114 W Cedar, this affordable home features two bedrooms upstairs primary bedroom on the main floor and a single bath with main floor laundry. wood deck, ample outdoor space and recently replaced driveway.
-
2025-04-29price $165,000 215-char remark
Show marketing remark (215 chars)
Nestled at 114 W Cedar, this affordable home features two bedrooms upstairs primary bedroom on the main floor and a single bath with main floor laundry. wood deck, ample outdoor space and recently replaced driveway.
-
2024-11-08$185,000 Active 215-char remark
Show marketing remark (215 chars)
Nestled at 114 W Cedar, this affordable home features two bedrooms upstairs primary bedroom on the main floor and a single bath with main floor laundry. wood deck, ample outdoor space and recently replaced driveway.
ⓘ Source: listings_history table (triggers on properties + properties_extension) + one-shot
backfill from property_details.listing_events for pre-trigger history.
Tax reassessment forecast NE · Resets to sale price
- Current annual tax
- $1,000 · $83/mo
- Projected year-2 tax
- $2,682 · $223/mo
- Expected delta
- +$1,681/yr (+$140/mo · 168.1%)
ⓘ Screening estimate from a state-policy table — verify with the county assessor before closing.
Climate risk First Street
- Flood 1/10 Low FEMA zone X (unshaded) · 0% chance over 30 yrs
- Wildfire 3/10 Moderate
- Heat 3/10 Moderate 7 d/yr ≥102°F today · 15 d/yr by 30 yrs out
- Wind 2/10 Low
- Air quality 2/10 Low 1 unhealthy d/yr today · 1 by 30 yrs out
Nearby sold comps map
Loading sold comps map…
Walkable amenities ~0.75 mi
Loading nearby amenities…
Taxation est. · year 1
- Rental income
- $26,069
- − Mortgage interest
- −$8,682
- − Property taxes
- −$1,000
- − Insurance
- −$775
- − Repairs & maintenance
- −$2,086
- − Management
- −$2,086
- − Depreciation
- −$4,509
- Taxable income
- $6,931
- Est. tax owed @ 24.0%
- −$1,663
- After-tax cash flow
- $7,402/yr
For passive investors: Depreciation is non-cash, so a rental often shows a tax loss while cash-flowing — sheltering income. Rental losses are passive: they offset passive income freely, and up to $25,000/yr can offset ordinary (W-2) income if you actively participate and your MAGI is under $100k (phasing out to $0 by $150k); unused losses carry forward. On sale, claimed depreciation is recaptured at up to 25%, and gains may owe capital-gains tax (a 1031 exchange can defer both). Figures are a year-1 estimate at your 24.0% rate — not tax advice; consult a CPA.
Schools (NCES district)
- District
- Norfolk Public Schools
- NCES district ID
- 3174430
- Math proficiency
- 44% ▼ -7.00%
- Reading proficiency
- 46% ▼ -7.00%
- Median HH income
- $46,579
- Composite
- 38.31/100
- National rank
- #4227
- State rank
- #84 of 111 in NE
Livability — Norfolk
- Score
- 78/100
- State rank
- #54
- US rank
- #2611
Category grades
Schools grade is shown separately in the Schools card above.
Census & demographics
- Census place
- Norfolk, NE
- County
- Madison County · 31,417 people
- City population
- 31,417
- Metro
- Norfolk, NE
- Population (ZIP)
- 31,417
- Household income
- $62,633
- Rent vs Own
- Severe rent burden
- 861.0
Population outlook (Madison County) Hauer SSP2
- Today (2025)
- 35,536 people
- By 2030
- 35,518 · -0.1%
- By 2040
- 35,170 · -1.0%
- By 2050
- 34,606 · -2.6%
- By 2075
- 34,522 · -2.9%
- By 2100
- 34,307 · -3.5%
Race, ethnicity, and origin ACS 2023
- Neighborhood character
- Predominantly White (80%)
- Race & ethnicity
- White 80% Hispanic / Latino 14% Two or more races 9% Native American 1% Black 1%
- Hispanic origin (detail)
- Mexican 11% Cuban 1%
- Common ancestry
- Portuguese 2% Romanian 1% Lithuanian 1%
- Foreign-born
- 6% · Canada
- Languages at home
- 90% English-only · Spanish 9%
Political lean MEDSL · Madison
- 2024 margin
- Solid R (+56.0) · D 21.4% · R 77.4% · Other 1.2%
- 2008→2024 swing
- -16.8pp toward R · 2008: -39.2pp · 2024: -56.0pp
- All cycles
- 2024: R+56.0 2020: R+53.5 2016: R+56.3 2012: R+48.1 2008: R+39.2
Not yet ingested
- Civics
- —
Market trends
- HPI YoY
- ▼ -172.61%
- Current HPI
- 260.5574
- Rent YoY
- ▲ 3.31%
- Metro
- Norfolk, NE
- State GDP YoY
- ▲ 0.68%
- F500 in state
- 2
Industry mix (Fortune 500 HQ in NE)
| Industry | F500 HQs | Revenue |
|---|---|---|
| Conglomerate | 1 | $371B |
|
||
Price history
-16.2% since first listed5 events — show timeline
- 2025-08-22 Relisted — NNEMLS
- 2025-08-01 Delisted — NNEMLS
- 2025-07-24 Price Changed $155,000 NNEMLS
- 2025-04-29 Price Changed $165,000 NNEMLS
- 2024-11-08 Listed $185,000 NNEMLS
Property tax history
+0.7%/yrLatest (2025): $1,000 · +3.6% YoY. Source: county tax records.
Cash-flow waterfall
monthlySold comps — $/sqft
last 12 mo · ≤1 miLoading sold comps…