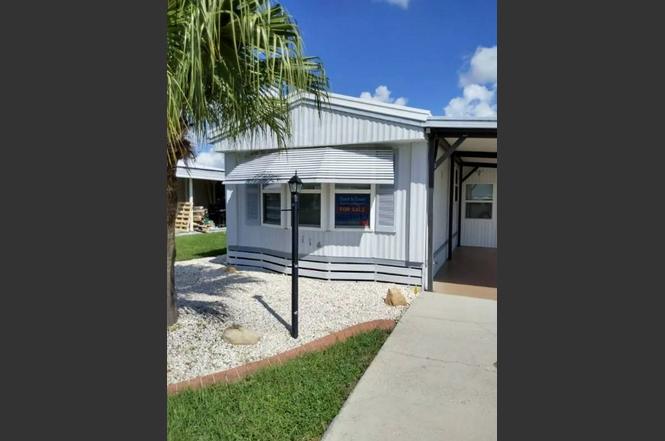
2114 Timber Ln · Sebring, FL
Flood risk No data
- FEMA flood zone
- —
- Chance of flooding over 30 yrs
- —
- Est. flood insurance / yr
- —
Fire risk No data
- Est. fire insurance / yr
- —
Heat risk No data
- Hot days now (above threshold)
- —
- Hot days in 30 yrs
- —
Wind risk No data
- Chance of severe wind over 30 yrs
- —
Air-quality risk No data
- Unhealthy air days now
- —
- Unhealthy air days in 30 yrs
- —
Risk factors via First Street. Map © Google.
Why this score? — see what drove the D grade
The composite is a weighted blend of 9 inputs, each scored 0–100. Each bar is that input's sub-score; the figure is the points it added to the 100-point composite (weight × sub-score).
- Cash flow +15.0/30.0
- ARV discount +7.5/15.0
- 1% rule +5.0/10.0
- DSCR +5.0/10.0
- Schools +3.6/10.0
- Livability +3.3/5.0
- Rent growth +2.9/5.0
- Condition / age +2.5/5.0
- Appreciation +0.0/10.0
$37,000
🖨 Deal sheet (PDF) 📄 Offer letter ✓ Due diligence
Listing remarks
For Sale: 2 Bed / 1.5 Bath Mobile Home Sebring, FL 2114 Timber Ln, Sebring, FL 33872 2 Bedrooms | 1.5 Bathrooms Property Type: Mobile Home This well-maintained 2-bedroom, 1.5-bath mobile home is located in a quiet Wood Haven Estates neighborhood and offers a comfortable, functional layout perfect for full-time living, a seasonal residence, or an investment opportunity. Features include: ~ Bright living area with natural light ~ Functional kitchen with ample cabinet space ~ Dedicated laundry area with washer & dryer ~ Spacious bedrooms with storage ~ Quiet street in an established area Conveniently located near shopping, dining, medical facilities, and recreational amenities Sebri
Key facts
- Functional kitchen
- Quiet street
- Built 1986
Tags
Neighborhood map
What this means for you Summary
Snapshot
- This is a 2-bed/1.5-bath single-family listed at $37k.
Deal economics
- At list price, monthly cash flow is $1k ($12k/yr) — positive.
- The deal already cash-flows at list — no discount required.
- Meets the 1% rule at list price ($2k rent vs $37k).
- Recommended offer: $33k (12.0% below list) — sets the bar for market timing.
- Cap rate 39.2% vs local median 4.3% in Sebring — top-decile yield for the area; either an underpriced asset or a hidden risk that comps aren't pricing in. Stress-test before assuming the spread holds.
Location & tenants
- Location reads 66/100 on livability (#618 in FL) — a middle-class / working-renter tenant base. Strengths: cost of living A+, housing A+, health & safety A; Watch: schools D, amenities F, commute F.
- Highlands (other): math 45% / reading 43% proficiency, ranked #54 of 73 in FL (top 74%) — families likely to look elsewhere, expect single-tenant / working-renter base with shorter leases; 68% free/reduced lunch — lower-income household profile, screen leases tightly.
- Market conditions: Rents rising (+1.6%/yr); 700 active listings in the ZIP; 1 comparable units currently listed for rent nearby; 980 units permitted in Highlands County in 2024 (80 in 5+ unit buildings).
Forward outlook
- Local home prices are declining (-3.0%/yr); year-one equity from $256 of loan paydown is wiped out by about $1k of value loss. Plan a longer hold.
- At projected returns (-3.0% appreciation + 1.6% rent growth), your $10k cash investment doubles in ~1 year — after that, you're playing with house money.
Negotiation context
- It's been on market 135 days — a 12% lower offer ($33k) is reasonable based on typical stale-listing flexibility.
Questions for the listing agent
- It's been on market 135 days. Have you received any prior offers? Is the seller open to a 12% concession, seller financing, or rate buy-down credit?
- Why hasn't it sold? Are there any deal-killer items the seller is aware of (foundation, flood, title, zoning, code violations)?
- Is there a deadline driving the sale (1031 exchange, divorce, estate, relocation)? That informs how much negotiation room exists.
- Schools are D-rated, which usually means shorter tenancies and higher turnover. Who's the typical renter profile here, and what's been the actual vacancy rate?
- The area grade is low — what's the realistic commute time and amenity access for the typical tenant pool here? Any planned neighborhood developments (good or bad) we should know about?
- What's the average days-on-market for RENTAL listings here right now (not sales)? A rising rental-DOM trend means longer vacancies and softer asking-rent achievability than the comps imply.
- What's the recent tenant-quality profile in this submarket — average credit score on applications, eviction rate, late-payment / NSF rate, and stable-employment percentage? A property-management company in the area should have these aggregated.
- How much new for-sale + rental construction is in the pipeline within 1–3 miles? Heavy new supply typically softens prices + rents 12–24 months out; constrained supply supports both.
Investment metrics
- 1% rule
- 4.35% ✓
- Cap rate
- 39.19%
- Cash-on-cash
- 117.50%
- DSCR
- 6.23
- GRM
- 1.9
CMA / ARV
- ARV (on-the-fly)
- $207,090
- Comps found
- 12
Show comp detail 12 sales within ~0.75 mi
| Address | Dist | Beds/Ba | Sqft | Sold | Price | $/sf | Match |
|---|---|---|---|---|---|---|---|
| 1535 Caribbean Rd | 0.38mi | 2/2.0 | 1,151 (-2%) | 1mo | $142,500 | $124 | 77 |
| 2024 Ashley Oaks Cir | 0.62mi | 2/2.0 | 1,232 (+5%) | 2mo | $215,000 | $175 | 58 |
| 3205 Jacklin Ave | 0.63mi | 3/2.0 (+1) | 1,154 (-1%) | 10mo | $110,000 | $95 | 53 |
| 326 Meadowlark Ave | 0.60mi | 3/2.0 (+1) | 1,193 (+2%) | 12mo | $227,500 | $191 | 51 |
| 812 Golfside Ln | 0.69mi | 2/2.0 | 1,125 (-4%) | 14mo | $185,000 | $164 | 48 |
| 301 Tanager Ave | 0.50mi | 3/2.0 (+1) | 1,247 (+7%) | 14mo | $260,000 | $209 | 47 |
| 212 Roadrunner Ave | 0.45mi | 3/2.0 (+1) | 1,263 (+8%) | 15mo | $256,990 | $203 | 46 |
| 337 Pelican Ave | 0.68mi | 3/2.0 (+1) | 1,206 (+3%) | 15mo | $214,000 | $177 | 44 |
| 317 Brant Ave | 0.58mi | 2/1.0 | 1,050 (-10%) | 16mo | $185,000 | $176 | 41 |
| 2038 Ashley Oaks Cir | 0.60mi | 2/2.0 | 1,299 (+11%) | 16mo | $205,000 | $158 | 38 |
| 339 Vireo Ave | 0.63mi | 3/2.0 (+1) | 1,334 (+14%) | 4mo | $327,000 | $245 | 37 |
| 328 Roadrunner Ave | 0.69mi | 2/2.0 | 1,036 (-12%) | 13mo | $200,000 | $193 | 36 |
Match score weights: distance 35% · size 25% · config 20% · recency 20%. Top-matched comps best support the ARV.
Projected returns pro-forma
-3.0% appreciation · 1.65% rent growth · sell at horizon
- IRR
- —
- Equity multiple
- 6.45×
- Total profit
- $56,484
- Equity at exit
- $5,517
- IRR
- —
- Equity multiple
- 12.96×
- Total profit
- $123,874
- Equity at exit
- $3,199
Cash invested: $10,360 (down + closing). Projections, not guarantees.
Landlord ↔ Tenant lean methodology
- Overall (STATE)
- 87 Strongly Landlord-Friendly
- State Florida
- 87 Strongly Landlord-Friendly · R+3
- County
- — inherits STATE
- City
- — inherits STATE
ZIP-level market 33872
- Home prices YoY
- -25.8%
- Rents YoY
- 1.6%
- Active inventory
- 700
- Price-to-rent
- 1.9×
Monthly cashflow live
- Estimated rent
- $1,608 medium interval (Pro) →
- Mortgage (P&I)
- −$194
- Tax est. 1.5%
- −$46 /mo · $555/yr
- Insurance
- −$15
- HOA
- −$0
- Vacancy / Maint / Mgmt
- −$338
- Net cashflow
- $1,014
Break-even live
Sensitivity live
| Price | -10% $1,040 | -5% $1,027 | +0% $1,014 | +5% $1,002 | +10% $989 |
|---|---|---|---|---|---|
| Rent | -10% $887 | -5% $951 | +0% $1,014 | +5% $1,078 | +10% $1,141 |
| Rate | -1.0pp $1,033 | -0.5pp $1,024 | base $1,014 | +0.5pp $1,005 | +1.0pp $995 |
UW: 25.0% down · 7.5% · 30yr · 1.5% tax · 5.0% vac · 8.0% maint · 8.0% mgmt
Financing live
Cash to close
- Down payment
- $9,250
- Closing costs
- $1,110
- Reserves months
- —
- Total cash needed
- —
Loan-product check · same deal, 3 products live
Conventional
25% down · 7.5% · 30yr
- Down + closing
- —
- Monthly P&I
- —
- Monthly cashflow
- —
- DSCR
- —
- Eligible?
- —
Personal DTI + credit; lowest rate.
DSCR
20% down · 8.5% · 30yr
- Down + closing
- —
- Monthly P&I
- —
- Monthly cashflow
- —
- DSCR
- —
- Eligible?
- —
No personal income docs; deal must DSCR.
Hard money
10% down · 12.0% · 12mo
- Down + closing
- —
- Monthly P&I
- —
- Monthly cashflow
- —
- DSCR
- —
- Eligible?
- —
Short-term bridge; refi at stabilization.
Rent comps 1 comps
| Address | Beds | Baths | Sqft | Rent | $/sqft | DOM | Units | Dist |
|---|---|---|---|---|---|---|---|---|
| 2545 Brunns Rd Sebring, FL | 3.0 | 2.0 | 1248 | $1,600 | $1.28 | 21d | 1 | 0.26mi |
Listing history 15 events
-
2026-06-19days on market $37,000 Active 135 DOM
-
2026-06-18days on market $37,000 Active 134 DOM
-
2026-06-17days on market $37,000 Active 133 DOM
-
2026-06-16days on market $37,000 Active 132 DOM
-
2026-06-15days on market $37,000 Active 131 DOM
-
2026-06-14days on market $37,000 Active 129 DOM
-
2026-06-10days on market $37,000 Active 126 DOM
-
2026-06-09days on market $37,000 Active 125 DOM
-
2026-06-08days on market $37,000 Active 124 DOM
-
2026-06-07days on market $37,000 Active 123 DOM
-
2026-06-02days on market $37,000 Active 118 DOM
-
2026-06-01days on market $37,000 Active 117 DOM
-
2026-05-31days on market $37,000 Active 116 DOM
-
2026-05-30days on market $37,000 Active 115 DOM
-
2026-02-04$37,000 Active
ⓘ Source: listings_history table (triggers on properties + properties_extension) + one-shot
backfill from property_details.listing_events for pre-trigger history.
Nearby sold comps map
Loading sold comps map…
Walkable amenities ~0.75 mi
Loading nearby amenities…
Taxation est. · year 1
- Rental income
- $19,293
- − Mortgage interest
- −$2,073
- − Property taxes
- −$555
- − Insurance
- −$185
- − Repairs & maintenance
- −$1,543
- − Management
- −$1,543
- − Depreciation
- −$1,076
- Taxable income
- $12,317
- Est. tax owed @ 24.0%
- −$2,956
- After-tax cash flow
- $9,217/yr
For passive investors: Depreciation is non-cash, so a rental often shows a tax loss while cash-flowing — sheltering income. Rental losses are passive: they offset passive income freely, and up to $25,000/yr can offset ordinary (W-2) income if you actively participate and your MAGI is under $100k (phasing out to $0 by $150k); unused losses carry forward. On sale, claimed depreciation is recaptured at up to 25%, and gains may owe capital-gains tax (a 1031 exchange can defer both). Figures are a year-1 estimate at your 24.0% rate — not tax advice; consult a CPA.
Schools (NCES district)
- District
- Highlands
- NCES district ID
- 1200840
- Math proficiency
- 45% ▼ -7.00%
- Reading proficiency
- 43% ▼ -3.00%
- Median HH income
- $35,276
- Composite
- 36.42/100
- National rank
- #4672
- State rank
- #54 of 73 in FL
Livability — Sebring
- Score
- 66/100
- State rank
- #618
- US rank
- #11992
Category grades
Schools grade is shown separately in the Schools card above.
Census & demographics
- County
- Highlands County · 98,898 people
- City population
- 50,797
- Metro
- Sebring-Avon Park, FL
- Population (ZIP)
- 13,746
- Household income
- $69,578
- Rent vs Own
- Severe rent burden
- 222.0
Population outlook (Highlands County) Hauer SSP2
- Today (2025)
- 99,674 people
- By 2030
- 99,615 · -0.1%
- By 2040
- 99,342 · -0.3%
- By 2050
- 98,242 · -1.4%
- By 2075
- 93,291 · -6.4%
- By 2100
- 79,894 · -19.8%
Race, ethnicity, and origin ACS 2023
- Neighborhood character
- Majority White (65%)
- Race & ethnicity
- White 65% Hispanic / Latino 22% Two or more races 11% Black 5% Asian 4% Native American 1%
- Hispanic origin (detail)
- Mexican 5% Puerto Rican 9% Cuban 3%
- Common ancestry
- Romanian 2% Russian 2% Slovak 2%
- Foreign-born
- 12% · Canada, Jamaica
- Languages at home
- 79% English-only · Spanish 16% Other Asian/Pacific 2% Other Indo-European 1%
Political lean MEDSL · Highlands
- 2024 margin
- Solid R (+40.8) · D 29.3% · R 70.1%
- 2008→2024 swing
- -22.7pp toward R · 2008: -18.1pp · 2024: -40.8pp
- All cycles
- 2024: R+40.8 2020: R+34.4 2016: R+32.0 2012: R+23.0 2008: R+18.1
Not yet ingested
- Civics
- —
Market trends
- HPI YoY
- ▼ -78.20%
- Current HPI
- 225.3761
- Rent YoY
- ▲ 1.65%
- Metro
- Sebring-Avon Park, FL
- State GDP YoY
- ▲ 3.28%
- F500 in state
- 36
Industry mix (Fortune 500 HQ in FL)
| Industry | F500 HQs | Revenue |
|---|---|---|
| Industrial Technology | 2 | $29B |
|
||
| Insurance | 2 | $17B |
|
||
| Retail | 1 | $60B |
|
||
| Technology Distribution | 1 | $58B |
|
||
| Homebuilding | 1 | $35B |
|
||
| Technology Manufacturing | 1 | $35B |
|
||
Price history
1 event — show timeline
- 2026-02-04 Listed $37,000 ForSaleByOwner.com
Cash-flow waterfall
monthlySold comps — $/sqft
last 12 mo · ≤1 miLoading sold comps…