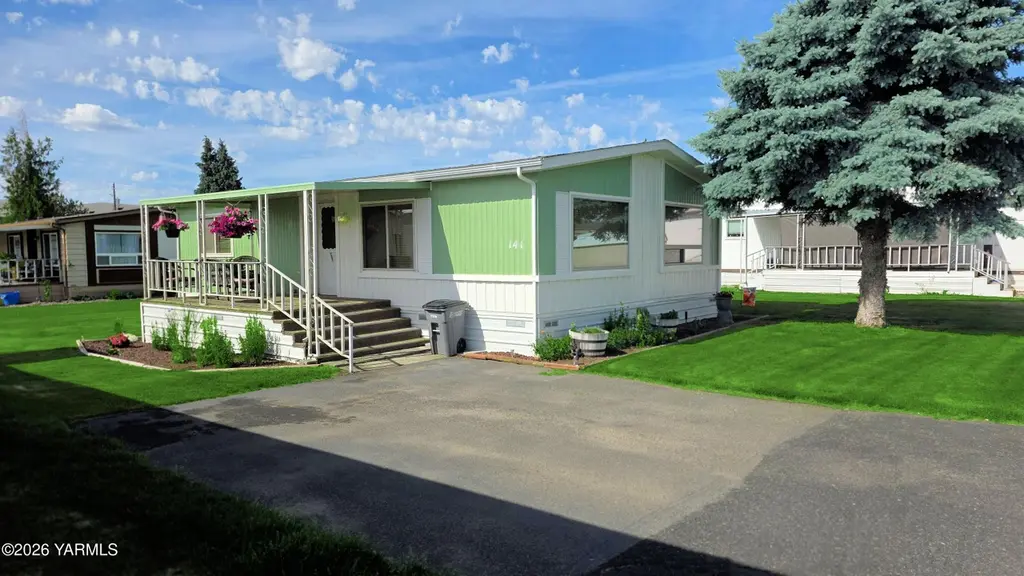
55 W Washington Ave #141 · Yakima, WA
Flood risk 1/10 · Minimal
- FEMA flood zone
- X (unshaded)
- Chance of flooding over 30 yrs
- 0.0%
- Est. flood insurance / yr
- $507 – $1,088
Fire risk 7/10 · Major
- Est. fire insurance / yr
- $604 – $1,122
Heat risk 4/10 · Minor
- Hot days now (above 98°F)
- 7 days/yr
- Hot days in 30 yrs
- 13 days/yr
Wind risk 1/10 · Minimal
- Chance of severe wind over 30 yrs
- —
Air-quality risk 9/10 · Severe
- Unhealthy air days now
- 16 days/yr
- Unhealthy air days in 30 yrs
- 19 days/yr
Risk factors via First Street. Map © Google.
Why this score? — see what drove the B- grade
The composite is a weighted blend of 9 inputs, each scored 0–100. Each bar is that input's sub-score; the figure is the points it added to the 100-point composite (weight × sub-score).
- Cash flow +30.0/30.0
- 1% rule +10.0/10.0
- DSCR +10.0/10.0
- ARV discount +7.5/15.0
- Livability +4.0/5.0
- Schools +3.4/10.0
- Rent growth +2.5/5.0
- Condition / age +2.5/5.0
- Appreciation +0.0/10.0
$49,500
🖨 Deal sheet (PDF) 📄 Offer letter ✓ Due diligence
Listing remarks
Complete pride of ownership -- you will absolutely fall in love with this newly updated, move-in ready home. Featuring fresh interior and exterior paint, new flooring, updated lighting, a remodeled bathroom, and custom accents throughout, this home is designed to impress. You will feel right at home the moment you walk through the door. The family has spent months carefully updating and preparing this home with meticulous attention to detail, ensuring it is truly ready for its next owner to move right in.
Key facts
- Remodeled bathroom
- New flooring
- Move in ready
Tags
Property features AI
Finance
- Other: Zoning: R3 - Multi Fam Res
- HOA & community: Community pool; Senior community
Exterior
- Parking: Off-street parking
- Utilities: Public water; Sewer connected
- Home design: Manufactured home (on leased land); Single-story
- Construction: Metal siding
- Exterior features: Metal roof; Shed(s); Level lot
Interior
- Kitchen: Range; Refrigerator
- Flooring: Carpet
- Bathrooms: 1 full bathroom
- Heating & cooling: Central air conditioning; Electric forced air heating
- Interior features: Range; Refrigerator; Carpet flooring; Central air conditioning; Electric forced air heating
Neighborhood map
What this means for you Summary
Snapshot
- This is a 2-bed/1.0-bath single-family listed at $50k.
Deal economics
- At list price, monthly cash flow is $680 ($8k/yr) — positive.
- The deal already cash-flows at list — no discount required.
- Meets the 1% rule at list price ($1k rent vs $50k).
- Recommended offer: $49k (1.5% below list) — sets the bar for market timing.
- Cap rate 22.8% vs local median 3.4% in Yakima — top-decile yield for the area; either an underpriced asset or a hidden risk that comps aren't pricing in. Stress-test before assuming the spread holds.
Location & tenants
- Location reads 80/100 on livability (#98 in WA, #1,912 nationally) — a professional / high-income tenant draw. Strengths: amenities A+, commute A+, housing A+; Watch: employment D, crime F.
- Yakima School District (urban): math 34% / reading 42% proficiency, ranked #238 of 291 in WA (top 82%) — families likely to look elsewhere, expect single-tenant / working-renter base with shorter leases; 76% free/reduced lunch — lower-income household profile, screen leases tightly.
- Market conditions: 172 active listings in the ZIP; 9 comparable units currently listed for rent nearby; rentals at typical pace (median 14d on market — plan ~3-4 weeks tenant-placement turnaround); 468 units permitted in Yakima County in 2024 (23 in 5+ unit buildings).
Forward outlook
- Local home prices are declining (-3.0%/yr); year-one equity from $342 of loan paydown is wiped out by about $1k of value loss. Plan a longer hold.
- Yakima County population projected at +6% by 2050 — modest demand growth; plan on rents tracking national, not racing it.
- At projected returns (-3.0% appreciation + 3.0% rent growth), your $14k cash investment doubles in ~2 years — after that, you're playing with house money.
Negotiation context
- It's been on market 23 days — a 2% lower offer ($49k) is reasonable based on typical stale-listing flexibility.
Risks & watch-outs
- Climate carrying-cost: major wildfire risk — expect insurance premiums to compound above CPI over the hold.
Questions for the listing agent
- Built in 1977 — when were the roof, HVAC, electrical panel, plumbing, and water heater last replaced?
- Is there a deadline driving the sale (1031 exchange, divorce, estate, relocation)? That informs how much negotiation room exists.
- Crime grade is F in this area — have there been break-ins, vandalism, or insurance claims at this property in the last 3 years? What carrier currently insures it and at what premium?
- What's the average days-on-market for RENTAL listings here right now (not sales)? A rising rental-DOM trend means longer vacancies and softer asking-rent achievability than the comps imply.
- What's the recent tenant-quality profile in this submarket — average credit score on applications, eviction rate, late-payment / NSF rate, and stable-employment percentage? A property-management company in the area should have these aggregated.
- How much new for-sale + rental construction is in the pipeline within 1–3 miles? Heavy new supply typically softens prices + rents 12–24 months out; constrained supply supports both.
Investment metrics
- 1% rule
- 2.51% ✓
- Cap rate
- 22.78%
- Cash-on-cash
- 58.88%
- DSCR
- 3.62
- GRM
- 3.3
CMA / ARV
- ARV (median comp)
- $245,335
- List price
- $49,500
- Delta
- -79.82%
- Verdict
- UNDERPRICED
- Comps
- 20 within 1.0 mi
Show comp detail 12 sales within ~0.75 mi
| Address | Dist | Beds/Ba | Sqft | Sold | Price | $/sf | Match |
|---|---|---|---|---|---|---|---|
| 1914 Landon Ave | 0.24mi | 2/1.0 | 944 (-2%) | 8mo | $220,000 | $233 | 80 |
| 1522 Landon Ave | 0.28mi | 2/1.0 | 900 (-6%) | 14mo | $229,000 | $254 | 65 |
| 2006 Cornell Ave | 0.61mi | 2/1.0 | 928 (-3%) | 9mo | $239,900 | $259 | 59 |
| 1906 Corpman Ln | 0.36mi | 2/1.0 | 840 (-12%) | 5mo | $210,000 | $250 | 58 |
| 1506 S 2nd Ave | 0.40mi | 2/1.0 | 840 (-12%) | 7mo | $275,000 | $327 | 55 |
| 2019 S 2nd Ave | 0.41mi | 3/1.0 (+1) | 1,092 (+14%) | 1mo | $295,000 | $270 | 52 |
| 1318 S 6th Ave | 0.71mi | 2/1.0 | 1,044 (+9%) | 1mo | $215,000 | $206 | 52 |
| 1511 S 5th Ave | 0.50mi | 3/1.5 (+1) | 1,025 (+7%) | 9mo | $310,000 | $302 | 51 |
| 1513 S 2nd Ave | 0.36mi | 2/1.0 | 1,094 (+14%) | 14mo | $275,000 | $251 | 48 |
| 2110 S 7th Ave | 0.74mi | 2/1.0 | 1,016 (+6%) | 11mo | $235,000 | $231 | 46 |
| 708 W Mead Ave | 0.74mi | 2/2.0 | 1,010 (+5%) | 14mo | $314,000 | $311 | 41 |
| 1716 S 7th Ave | 0.61mi | 2/1.0 | 816 (-15%) | 14mo | $245,000 | $300 | 35 |
Match score weights: distance 35% · size 25% · config 20% · recency 20%. Top-matched comps best support the ARV.
Projected returns pro-forma
-3.0% appreciation · 3.0% rent growth · sell at horizon
- IRR
- 57.5%
- Equity multiple
- 3.55×
- Total profit
- $35,285
- Equity at exit
- $7,381
- IRR
- 62.4%
- Equity multiple
- 7.24×
- Total profit
- $86,468
- Equity at exit
- $4,280
Cash invested: $13,860 (down + closing). Projections, not guarantees.
Landlord ↔ Tenant lean methodology
- Overall (STATE)
- 28 Tenant-Leaning
- State Washington
- 28 Tenant-Leaning · D+8
- County
- — inherits STATE
- City
- — inherits STATE
ZIP-level market 98903
- Home prices YoY
- -21.8%
- Active inventory
- 172
- Price-to-rent
- 3.3×
Monthly cashflow live
- Estimated rent
- $1,240 high interval (Pro) →
- Mortgage (P&I)
- −$260
- Tax from tax record
- −$20 /mo · $234/yr
- Insurance
- −$21
- HOA
- −$0
- Vacancy / Maint / Mgmt
- −$260
- Net cashflow
- $680
Break-even live
Sensitivity live
| Price | -10% $708 | -5% $694 | +0% $680 | +5% $666 | +10% $652 |
|---|---|---|---|---|---|
| Rent | -10% $582 | -5% $631 | +0% $680 | +5% $729 | +10% $778 |
| Rate | -1.0pp $705 | -0.5pp $693 | base $680 | +0.5pp $667 | +1.0pp $654 |
UW: 25.0% down · 7.5% · 30yr · 1.5% tax · 5.0% vac · 8.0% maint · 8.0% mgmt
Financing live
Cash to close
- Down payment
- $12,375
- Closing costs
- $1,485
- Reserves months
- —
- Total cash needed
- —
Loan-product check · same deal, 3 products live
Conventional
25% down · 7.5% · 30yr
- Down + closing
- —
- Monthly P&I
- —
- Monthly cashflow
- —
- DSCR
- —
- Eligible?
- —
Personal DTI + credit; lowest rate.
DSCR
20% down · 8.5% · 30yr
- Down + closing
- —
- Monthly P&I
- —
- Monthly cashflow
- —
- DSCR
- —
- Eligible?
- —
No personal income docs; deal must DSCR.
Hard money
10% down · 12.0% · 12mo
- Down + closing
- —
- Monthly P&I
- —
- Monthly cashflow
- —
- DSCR
- —
- Eligible?
- —
Short-term bridge; refi at stabilization.
Rent comps 9 comps
| Address | Beds | Baths | Sqft | Rent | $/sqft | DOM | Units | Dist |
|---|---|---|---|---|---|---|---|---|
| 1606 S 1st Ave Unit 1 Yakima, WA | 2.0 | 1.0 | 911 | $1,250 | $1.37 | 14d | 1 | 0.24mi |
| 1418 Cornell Ave Yakima, WA | 3.0 | 1.0 | 1000 | $1,800 | $1.80 | 44d | 1 | 0.65mi |
| 1522 S 9th Ave Unit B Yakima, WA | 1.0 | 1.0 | 595 | $875 | $1.47 | 21d | 1 | 0.75mi |
| 1420 Queen Ave Unit 1420 Yakima, WA | 1.0 | 1.0 | 650 | $1,050 | $1.62 | 14d | 1 | 1.02mi |
| 1121 E Viola Ave Yakima, WA | 3.0–4.0 | 2.0 | 1168 | $1,200 | $1.03 | 14d | 1 | 1.03mi |
| 2718 Kateenah Way Apt 26 Union Gap, WA | 1.0 | 1.0 | 576 | $1,050 | $1.82 | 44d | 1 | 1.33mi |
| 2718 Kateenah Way Union Gap, WA | 1.0 | 1.0 | 576 | $1,028 | $1.78 | 14d | 3 | 1.34mi |
| 1213 S 16th Ave Apt 3 Yakima, WA | 1.0 | 1.0 | 540 | $950 | $1.76 | 44d | 1 | 1.38mi |
| 1206 S 15th Ave Yakima, WA | 1.0 | 1.0 | 575 | $990 | $1.72 | 14d | 2 | 1.39mi |
Listing history 8 events
-
2026-06-07statusdays on market $49,500 Pending 23 DOM
-
2026-06-05days on market $49,500 Active 21 DOM
-
2026-06-03days on market $49,500 Active 20 DOM
-
2026-06-02days on market $49,500 Active 19 DOM
-
2026-06-01days on market $49,500 Active 18 DOM
-
2026-05-31days on market $49,500 Active 17 DOM
-
2026-05-30days on market $49,500 Active 16 DOM
-
2026-05-14$49,500 Active 510-char remark
ⓘ Source: listings_history table (triggers on properties + properties_extension) + one-shot
backfill from property_details.listing_events for pre-trigger history.
Tax reassessment forecast WA · Resets to sale price
- Current annual tax
- $234 · $20/mo
- Projected year-2 tax
- $485 · $40/mo
- Expected delta
- +$251/yr (+$21/mo · 107.0%)
ⓘ Screening estimate from a state-policy table — verify with the county assessor before closing.
Climate risk First Street
- Flood 1/10 Low FEMA zone X (unshaded) · 0% chance over 30 yrs
- Wildfire 7/10 Severe
- Heat 4/10 Moderate 7 d/yr ≥98°F today · 13 d/yr by 30 yrs out
- Wind 1/10 Low
- Air quality 9/10 Extreme 16 unhealthy d/yr today · 19 by 30 yrs out
Nearby sold comps map
Loading sold comps map…
Walkable amenities ~0.75 mi
Loading nearby amenities…
Taxation est. · year 1
- Rental income
- $14,883
- − Mortgage interest
- −$2,773
- − Property taxes
- −$234
- − Insurance
- −$248
- − Repairs & maintenance
- −$1,191
- − Management
- −$1,191
- − Depreciation
- −$1,440
- Taxable income
- $7,807
- Est. tax owed @ 24.0%
- −$1,874
- After-tax cash flow
- $6,287/yr
For passive investors: Depreciation is non-cash, so a rental often shows a tax loss while cash-flowing — sheltering income. Rental losses are passive: they offset passive income freely, and up to $25,000/yr can offset ordinary (W-2) income if you actively participate and your MAGI is under $100k (phasing out to $0 by $150k); unused losses carry forward. On sale, claimed depreciation is recaptured at up to 25%, and gains may owe capital-gains tax (a 1031 exchange can defer both). Figures are a year-1 estimate at your 24.0% rate — not tax advice; consult a CPA.
Schools (NCES district)
- District
- Yakima School District
- NCES district ID
- 5310110
- Math proficiency
- 34% ▼ -1.00%
- Reading proficiency
- 42% ▬ 0.00%
- Median HH income
- $36,538
- Composite
- 34.04/100
- National rank
- #10305
- State rank
- #238 of 291 in WA
Livability — Yakima
- Score
- 80/100
- State rank
- #98
- US rank
- #1912
Category grades
Schools grade is shown separately in the Schools card above.
Census & demographics
- Census place
- Yakima, WA
- City population
- 115,918
- Population (ZIP)
- 19,010
Population outlook (Yakima County) Hauer SSP2
- Today (2025)
- 256,514 people
- By 2030
- 259,403 · +1.1%
- By 2040
- 265,677 · +3.6%
- By 2050
- 273,061 · +6.5%
- By 2075
- 296,991 · +15.8%
- By 2100
- 315,291 · +22.9%
Race, ethnicity, and origin ACS 2023
- Neighborhood character
- Diverse neighborhood (Simpson 0.58)
- Race & ethnicity
- White 49% Hispanic / Latino 42% Two or more races 19% Asian 3% Native American 3%
- Hispanic origin (detail)
- Mexican 38%
- Common ancestry
- Italian 3% Portuguese 2% Lithuanian 1%
- Foreign-born
- 15% · Canada, Vietnam
- Languages at home
- 63% English-only · Spanish 33% Other Asian/Pacific 1% Other Indo-European 1%
Political lean MEDSL · Yakima
- 2024 margin
- R (+14.3) · D 41.6% · R 55.9% · Other 2.5%
- 2008→2024 swing
- -3.8pp toward R · 2008: -10.6pp · 2024: -14.3pp
- All cycles
- 2024: R+14.3 2020: R+7.7 2016: R+15.4 2012: R+15.1 2008: R+10.6
Not yet ingested
- Civics
- —
Market trends
- HPI YoY
- ▼ -83.90%
- Current HPI
- 300.5753
- Rent YoY
- —
- Metro
- —
- State GDP YoY
- ▲ 4.65%
- F500 in state
- 22
Industry mix (Fortune 500 HQ in WA)
| Industry | F500 HQs | Revenue |
|---|---|---|
| Retail | 2 | $269B |
|
||
| Technology / Retail | 1 | $638B |
|
||
| Technology | 1 | $245B |
|
||
| Telecommunications | 1 | $38B |
|
||
| Food / Beverage | 1 | $36B |
|
||
| Automotive / Trucks | 1 | $34B |
|
||
Price history
-6.4% since first listed3 events — show timeline
- 2026-06-11 Sold (MLS) $46,350 YAMLS
- 2026-06-06 Pending — YAMLS
- 2026-05-14 Listed $49,500 YAMLS
Property tax history
+0.9%/yrLatest (2023): $234 · -11.1% YoY. Source: county tax records.
Cash-flow waterfall
monthlySold comps — $/sqft
last 12 mo · ≤1 miLoading sold comps…