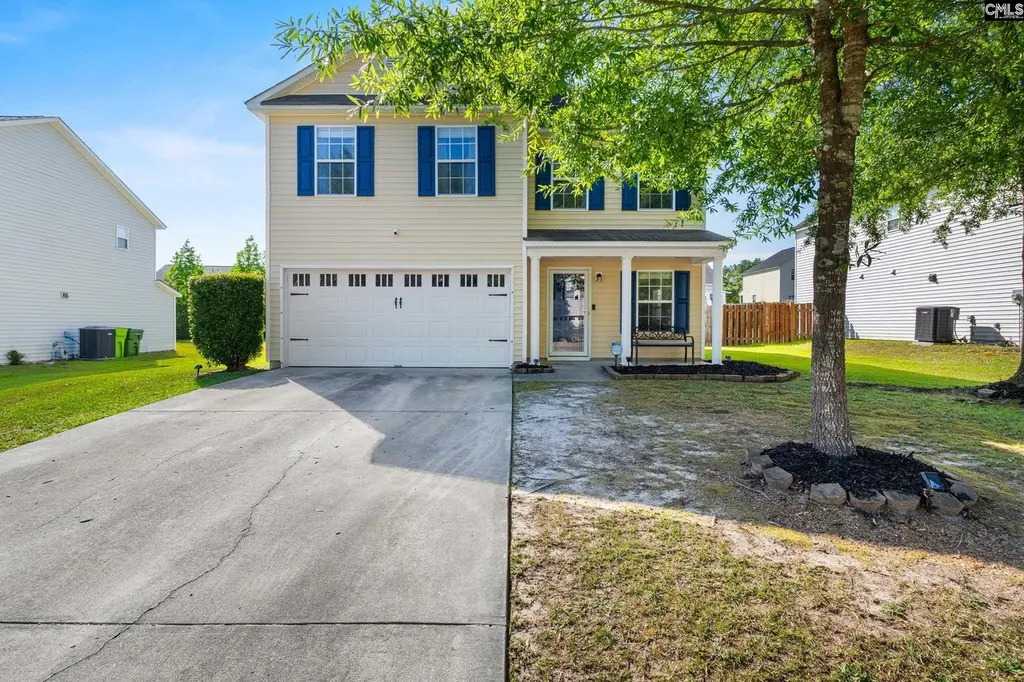
513 Silver Spoon Ln · Columbia, SC
Flood risk 1/10 · Minimal
- FEMA flood zone
- X (unshaded)
- Chance of flooding over 30 yrs
- 0.0%
- Est. flood insurance / yr
- $507 – $1,088
Fire risk 4/10 · Minor
- Est. fire insurance / yr
- $783 – $1,453
Heat risk 7/10 · Major
- Hot days now (above 107°F)
- 7 days/yr
- Hot days in 30 yrs
- 16 days/yr
Wind risk 6/10 · Moderate
- Chance of severe wind over 30 yrs
- 65.0%
Air-quality risk 3/10 · Minor
- Unhealthy air days now
- 3 days/yr
- Unhealthy air days in 30 yrs
- 3 days/yr
Risk factors via First Street. Map © Google.
Why this score? — see what drove the C- grade
The composite is a weighted blend of 9 inputs, each scored 0–100. Each bar is that input's sub-score; the figure is the points it added to the 100-point composite (weight × sub-score).
- Cash flow +16.3/30.0
- ARV discount +10.7/15.0
- DSCR +5.1/10.0
- Appreciation +5.0/10.0
- Livability +3.9/5.0
- 1% rule +3.7/10.0
- Schools +3.6/10.0
- Rent growth +2.5/5.0
- Condition / age +2.5/5.0
$240,000
🖨 Deal sheet (PDF) 📄 Offer letter ✓ Due diligence
Listing remarks
This well-maintained 4 bedroom, 2.5 bath home in Elgin features over 1,800 square feet of comfortable living space. The layout includes spacious living areas, a functional kitchen, and plenty of room for everyday living and entertaining. Enjoy the convenience of a two-car garage and a fenced backyard perfect for relaxing or gathering with friends and family. Located in an established neighborhood with easy access to shopping, dining, and schools. Disclaimer: CMLS has not reviewed and, therefore, does not endorse vendors who may appear in listings.
Key facts
- Functional kitchen
- Fenced backyard
- 2 garage spots
Tags
Property features AI
Finance
- HOA & community: Homeowners association present; amenities include playground and pool, plus road and sidewalk maintenance
Exterior
- Parking: Attached garage with 2 garage spaces
- Utilities: Public water; Public sewer
- Home design: Two-story home; Paved road access
- Construction: Slab foundation
- Exterior features: Vinyl exterior; Rear wood fence
Interior
- Kitchen: Granite countertops; Laminate flooring; Dishwasher; Disposal; Smooth surface range
- Bedrooms: Master bedroom on second level with private bath, walk-in closet, tub/shower, ceiling fan, and carpeted floors; Additional bedrooms on second level each with ceiling fan and private closets
- Flooring: Carpet in bedrooms; Laminate flooring in living room and kitchen
- Bathrooms: Two full bathrooms; One half bathroom; Two additional full secondary baths
- Heating & cooling: Central cooling; Gas Pac heating
- Interior features: Smoke detector; Attic access; Loft (on second level)
- Laundry & utility: Laundry closet on second level
Neighborhood map
What this means for you Summary
Snapshot
- This is a 4-bed/3.0-bath single-family listed at $240k.
Deal economics
- At list price, monthly cash flow is $133 ($2k/yr) — positive.
- The deal already cash-flows at list — no discount required.
- To meet the 1% rule (rent ≥ 1% of price), the offer needs to be $209k (13.1% below list).
- Recommended offer: $209k (13.1% below list) — sets the bar for 1% rule.
Location & tenants
- Location reads 78/100 on livability (#18 in SC, #2,436 nationally) — a middle-class / working-renter tenant base. Strengths: amenities A+, commute A+, cost of living A+; Watch: employment D, crime F.
- Richland 02 (suburban): math 35% / reading 47% proficiency, ranked #29 of 80 in SC (top 36%) — families likely to look elsewhere, expect single-tenant / working-renter base with shorter leases.
- Zoned schools: Bookman Road Elementary (math 47% / reading 52%, grade D, #168 of 597 statewide, top 31%, 499 students, 62% FRL); Spring Valley High (math 53% / reading 92%, grade B+, #46 of 196 statewide, top 24%, 2,187 students, 49% FRL) — zoned schools average 55% FRL vs 38% district-wide (17 pts higher); higher-poverty schools than district average — tighter screening recommended.
- Zoned-school proficiency averages 61% at this address vs 41% district-wide (+20 pts) — the actual schools serving this property are materially stronger than the Richland 02 average implies; a family-tenant draw the district grade alone would hide.
- Market conditions: 34 active listings in the ZIP; 6 comparable units currently listed for rent nearby; rentals leasing fast (median 5d on market — plan ~1-2 weeks tenant-placement turnaround); 3,472 units permitted in Richland County in 2024 (1,096 in 5+ unit buildings).
Forward outlook
- In year one you build about $9k of equity ($2k loan paydown + $7k appreciation (3.0% local appreciation)).
- Richland County population projected at +30% by 2050 — long-run rental-demand tailwind backs the buy-and-hold thesis.
- At projected returns (3.0% appreciation + 3.0% rent growth), your $67k cash investment doubles in ~6 years — after that, you're playing with house money.
- By year 4, paydown + projected appreciation supports a ~$30k cash-out refi (75% LTV) — recoverable capital for the next deal without selling this one.
Negotiation context
- Only 9 days on market — expect competitive offers; lowballing is unlikely to land.
- 2 sale attempts since 7y ago with the ask held roughly flat each time — persistent listings suggest the price (not the market) is what's stuck; bring a comps-based counter.
- Current owner paid $155k; list at $240k implies a 55% gain — meaningful room to come down on a strong offer.
Risks & watch-outs
- Climate carrying-cost: major wind risk, 65% chance of damaging wind over 30y; extreme-heat days projected 7→16/yr by 2055 (HVAC capex compounding) — expect insurance premiums to compound above CPI over the hold.
Questions for the listing agent
- Is there a deadline driving the sale (1031 exchange, divorce, estate, relocation)? That informs how much negotiation room exists.
- Schools are D-rated, which usually means shorter tenancies and higher turnover. Who's the typical renter profile here, and what's been the actual vacancy rate?
- Crime grade is F in this area — have there been break-ins, vandalism, or insurance claims at this property in the last 3 years? What carrier currently insures it and at what premium?
- What's the average days-on-market for RENTAL listings here right now (not sales)? A rising rental-DOM trend means longer vacancies and softer asking-rent achievability than the comps imply.
- What's the recent tenant-quality profile in this submarket — average credit score on applications, eviction rate, late-payment / NSF rate, and stable-employment percentage? A property-management company in the area should have these aggregated.
- How much new for-sale + rental construction is in the pipeline within 1–3 miles? Heavy new supply typically softens prices + rents 12–24 months out; constrained supply supports both.
Investment metrics
- 1% rule
- 0.87% ✗
- Cap rate
- 6.96%
- Cash-on-cash
- 2.38%
- DSCR
- 1.11
- GRM
- 9.6
CMA / ARV
- ARV (on-the-fly)
- $258,312
- Comps found
- 5
Show comp detail 5 sales within ~0.75 mi
| Address | Dist | Beds/Ba | Sqft | Sold | Price | $/sf | Match |
|---|---|---|---|---|---|---|---|
| 732 Jack Russell Ct | 0.53mi | 4/2.5 | 1,920 (+5%) | 9mo | $234,990 | $122 | 58 |
| 1 Loggerhead Dr | 0.47mi | 3/2.0 (-1) | 1,800 (-2%) | 11mo | $268,000 | $149 | 57 |
| 396 Longfellows Ln | 0.35mi | 4/2.5 | 1,648 (-10%) | 17mo | $235,000 | $143 | 51 |
| 752 Jack Russell Ct | 0.57mi | 3/2.5 (-1) | 1,714 (-6%) | 13mo | $242,000 | $141 | 45 |
| 116 Windwood Dr | 0.51mi | 3/2.5 (-1) | 2,095 (+14%) | 4mo | $184,000 | $88 | 42 |
Match score weights: distance 35% · size 25% · config 20% · recency 20%. Top-matched comps best support the ARV.
Projected returns pro-forma
3.0% appreciation · 3.0% rent growth · sell at horizon
- IRR
- 9.7%
- Equity multiple
- 1.56×
- Total profit
- $37,331
- Equity at exit
- $107,914
- IRR
- 12.1%
- Equity multiple
- 2.80×
- Total profit
- $120,974
- Equity at exit
- $166,309
Cash invested: $67,200 (down + closing). Projections, not guarantees.
Landlord ↔ Tenant lean methodology
- Overall (STATE)
- 90 Strongly Landlord-Friendly
- State South Carolina
- 90 Strongly Landlord-Friendly · R+6
- County
- — inherits STATE
- City
- — inherits STATE
ZIP-level market 29045-0000
- Active inventory
- 34
- Price-to-rent
- 9.6×
Monthly cashflow live
- Estimated rent
- $2,085 high interval (Pro) →
- Mortgage (P&I)
- −$1,259
- Tax from tax record
- −$156 /mo · $1,866/yr
- Insurance
- −$100
- HOA
- −$0
- Vacancy / Maint / Mgmt
- −$438
- Net cashflow
- $133
Break-even live
Sensitivity live
| Price | -10% $269 | -5% $201 | +0% $133 | +5% $65 | +10% $-3 |
|---|---|---|---|---|---|
| Rent | -10% $-32 | -5% $51 | +0% $133 | +5% $215 | +10% $298 |
| Rate | -1.0pp $254 | -0.5pp $194 | base $133 | +0.5pp $71 | +1.0pp $8 |
UW: 25.0% down · 7.5% · 30yr · 1.5% tax · 5.0% vac · 8.0% maint · 8.0% mgmt
Financing live
Cash to close
- Down payment
- $60,000
- Closing costs
- $7,200
- Reserves months
- —
- Total cash needed
- —
Loan-product check · same deal, 3 products live
Conventional
25% down · 7.5% · 30yr
- Down + closing
- —
- Monthly P&I
- —
- Monthly cashflow
- —
- DSCR
- —
- Eligible?
- —
Personal DTI + credit; lowest rate.
DSCR
20% down · 8.5% · 30yr
- Down + closing
- —
- Monthly P&I
- —
- Monthly cashflow
- —
- DSCR
- —
- Eligible?
- —
No personal income docs; deal must DSCR.
Hard money
10% down · 12.0% · 12mo
- Down + closing
- —
- Monthly P&I
- —
- Monthly cashflow
- —
- DSCR
- —
- Eligible?
- —
Short-term bridge; refi at stabilization.
Rent comps 6 comps
| Address | Beds | Baths | Sqft | Rent | $/sqft | DOM | Units | Dist |
|---|---|---|---|---|---|---|---|---|
| 430 Grand National Ln Elgin, SC | 4.0 | 2.5 | 2060 | $2,049 | $0.99 | 4d | 1 | 0.07mi |
| 1111 Triple Crown Ct Elgin, SC | 4.0 | 2.5 | 2624 | $2,395 | $0.91 | 25d | 1 | 0.36mi |
| 344 Longfellows Ln Elgin, SC | 3.0 | 2.5 | 1652 | $1,999 | $1.21 | 5d | 1 | 0.41mi |
| 304 Longfellows Ln Elgin, SC | 4.0 | 2.5 | 2050 | $2,269 | $1.11 | 5d | 1 | 0.49mi |
| 10682 Two Notch Rd Elgin, SC | 1.0–3.0 | 1.0–2.0 | 1052 | $1,675 | $1.59 | 4d | 10 | 0.91mi |
| 512 N Crossing Dr Columbia, SC | 3.0 | 2.0 | 1302 | $1,799 | $1.38 | 25d | 1 | 1.26mi |
Listing history 6 events
-
2026-05-18$240,000 Active
-
2019-12-30soldstatus $155,000
-
2019-11-24historical
-
2019-11-14$155,000 Active
-
2019-10-23price $159,900
-
2009-10-09soldstatus $160,000
ⓘ Source: listings_history table (triggers on properties + properties_extension) + one-shot
backfill from property_details.listing_events for pre-trigger history.
Tax reassessment forecast SC · Resets to sale price
- Current annual tax
- $1,866 · $156/mo
- Projected year-2 tax
- $1,866 · $156/mo
- Expected delta
- $0/yr ($0/mo · 0.0%)
ⓘ Screening estimate from a state-policy table — verify with the county assessor before closing.
Climate risk First Street
- Flood 1/10 Low FEMA zone X (unshaded) · 0% chance over 30 yrs
- Wildfire 4/10 Moderate
- Heat 7/10 Severe 7 d/yr ≥107°F today · 16 d/yr by 30 yrs out
- Wind 6/10 Major 65% chance of damaging wind over 30 yrs
- Air quality 3/10 Moderate 3 unhealthy d/yr today · 3 by 30 yrs out
Nearby sold comps map
Loading sold comps map…
Walkable amenities ~0.75 mi
Loading nearby amenities…
Taxation est. · year 1
- Rental income
- $25,020
- − Mortgage interest
- −$13,444
- − Property taxes
- −$1,866
- − Insurance
- −$1,200
- − Repairs & maintenance
- −$2,002
- − Management
- −$2,002
- − Depreciation
- −$6,982
- Taxable loss
- −$2,474
- Est. tax savings @ 24.0%
- +$594
- After-tax cash flow
- $2,191/yr
For passive investors: Depreciation is non-cash, so a rental often shows a tax loss while cash-flowing — sheltering income. Rental losses are passive: they offset passive income freely, and up to $25,000/yr can offset ordinary (W-2) income if you actively participate and your MAGI is under $100k (phasing out to $0 by $150k); unused losses carry forward. On sale, claimed depreciation is recaptured at up to 25%, and gains may owe capital-gains tax (a 1031 exchange can defer both). Figures are a year-1 estimate at your 24.0% rate — not tax advice; consult a CPA.
Schools (NCES district)
- District
- Richland 02
- NCES district ID
- 4503390
- Math proficiency
- 35% ▼ -15.00%
- Reading proficiency
- 47% ▼ -5.00%
- Median HH income
- $59,684
- Composite
- 36.2/100
- National rank
- #4730
- State rank
- #29 of 80 in SC
Livability — Columbia
- Score
- 78/100
- State rank
- #18
- US rank
- #2436
Category grades
Schools grade is shown separately in the Schools card above.
Census & demographics
No demographic data for this ZIP.
Market trends
- HPI YoY
- —
- Current HPI
- —
- Rent YoY
- —
- Metro
- —
- State GDP YoY
- ▲ 4.51%
- F500 in state
- 2
Industry mix (Fortune 500 HQ in SC)
| Industry | F500 HQs | Revenue |
|---|---|---|
| Packaging | 1 | $7B |
|
||
Price history
+50.0% since first listed6 events — show timeline
- 2026-05-18 Listed $240,000 Consolidated MLS
- 2019-12-30 Sold (Public Records) $155,000 Public Records
- 2019-11-24 Delisted — Consolidated MLS
- 2019-11-14 Listed $155,000 Consolidated MLS
- 2019-10-23 Price Changed $159,900 Consolidated MLS
- 2009-10-09 Sold (Public Records) $160,000 Public Records
Property tax history
+1.9%/yrLatest (2025): $1,866 · +3.6% YoY. Source: county tax records.
Cash-flow waterfall
monthlySold comps — $/sqft
last 12 mo · ≤1 miLoading sold comps…