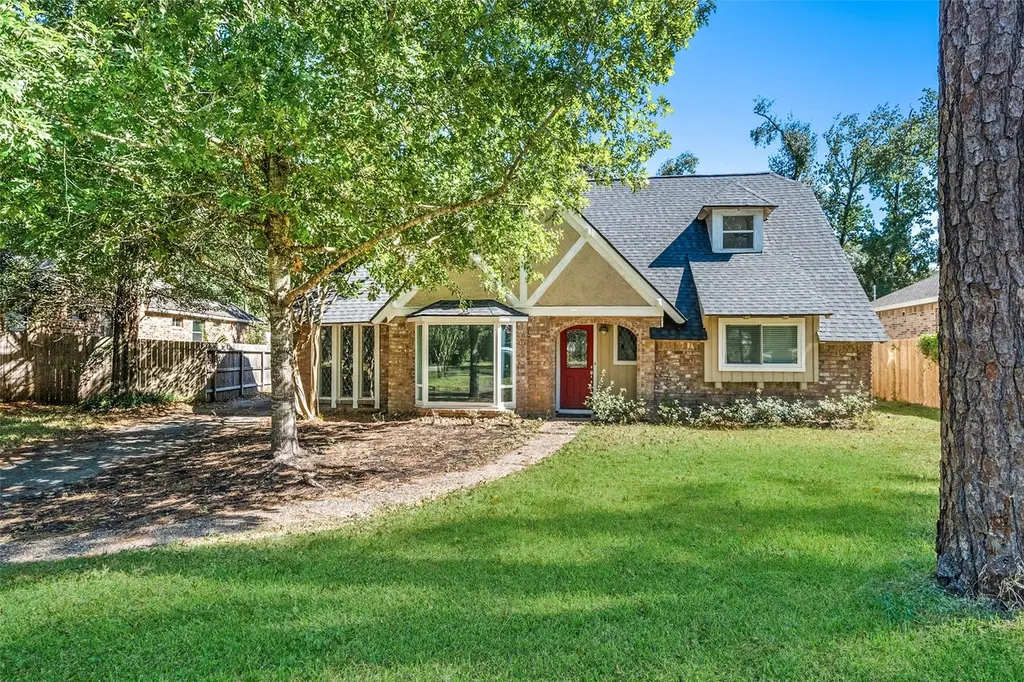
499 Mississippi Park · Conroe, TX
Flood risk 6/10 · Moderate
- FEMA flood zone
- X (unshaded)
- Chance of flooding over 30 yrs
- 0.74%
- Est. flood insurance / yr
- $507 – $1,088
Fire risk 2/10 · Minimal
- Est. fire insurance / yr
- $1,222 – $2,270
Heat risk 9/10 · Severe
- Hot days now (above 111°F)
- 7 days/yr
- Hot days in 30 yrs
- 24 days/yr
Wind risk 8/10 · Major
- Chance of severe wind over 30 yrs
- 99.0%
Air-quality risk 2/10 · Minimal
- Unhealthy air days now
- 2 days/yr
- Unhealthy air days in 30 yrs
- 2 days/yr
Risk factors via First Street. Map © Google.
Why this score? — see what drove the D grade
The composite is a weighted blend of 9 inputs, each scored 0–100. Each bar is that input's sub-score; the figure is the points it added to the 100-point composite (weight × sub-score).
- Cash flow +13.2/30.0
- ARV discount +7.6/15.0
- Schools +5.1/10.0
- 1% rule +4.6/10.0
- DSCR +4.0/10.0
- Livability +3.7/5.0
- Rent growth +3.3/5.0
- Condition / age +2.5/5.0
- Appreciation +0.0/10.0
$319,000
🖨 Deal sheet (PDF) 📄 Offer letter ✓ Due diligence
Listing remarks
Newly remodeled home in sought-after River Plantation! This beautiful renovated residence features a brand-new roof (2025), HVAC replaced in 2024, new flooring and fresh paint throughout. Situated on a quiet cul-de-sac lot and NEVER flooded. The spacious primary suite offers a completely remodeled ensuite bath with double sinks, frameless glass shower, and a large soaking tub, plus a huge walk-in closet with built-ins. Flexible floor plan includes formal living and dining rooms, a family room, and a charming niche under the stairs—perfect for storage or décor. Move-in ready and beautifully updated!
Key facts
- Hvac replaced
- Fresh paint
- New flooring
Tags
Property features AI
Finance
- HOA & community: Part of Somerset Association Management; Annual HOA fee; Association amenities include clubhouse, pool, playground, tennis courts, pickleball, basketball court, picnic area, trails, and golf; HOA fee covers common areas and recreation facilities
Exterior
- Parking: Detached garage; 2-car garage
- Security: Smoke detector(s)
- Utilities: Public water; Public sewer
- Home design: Residential property; Full ownership; Slab foundation; Composition roof; Located on a cul-de-sac; Near golf course; Subdivision setting; Additional parcel(s) included
- Construction: Brick and wood siding exterior; Built in 1969
- Exterior features: Covered patio; Deck; Patio; Porch; Private yard; Fence (back yard); Tennis court(s) on property or in community; Covered patio/porch/deck combinations
Interior
- Kitchen: Dishwasher; Electric cooktop; Electric oven; Disposal; Oven; Pantry; Granite counters
- Bedrooms: Primary bedroom (First level); Three additional bedrooms (Second level)
- Flooring: Carpet; Laminate
- Bathrooms: Two full bathrooms; One half bathroom
- Heating & cooling: Central heating (gas); Central air (electric)
- Interior features: Gas fireplace (one); Double vanity; Granite counters; High ceilings; Primary bedroom with bath; Soaking tub; Separate shower; Vanity; Ceiling fans; Pantry
- Laundry & utility: Washer hookup; Electric dryer hookup; Utility room (First level, 9x7)
Neighborhood map
What this means for you Summary
Snapshot
- This is a 4-bed/2.5-bath single-family listed at $319k.
Deal economics
- At list price, monthly cash flow is $-5 ($-61/yr) — negative.
- To cash-flow at today's rent, offer at most $318k (0.3% below list).
- To meet the 1% rule (rent ≥ 1% of price), the offer needs to be $305k (4.4% below list).
- Recommended offer: $305k (4.4% below list) — sets the bar for 1% rule.
- Cap rate 6.3% vs local median 3.1% in Conroe — top-decile yield for the area; either an underpriced asset or a hidden risk that comps aren't pricing in. Stress-test before assuming the spread holds.
Location & tenants
- Location reads 74/100 on livability (#169 in TX, #4,447 nationally) — a middle-class / working-renter tenant base. Strengths: cost of living A+, housing A+, amenities B; Watch: commute F, health & safety F.
- Conroe ISD (other): math 57% / reading 57% proficiency, ranked #69 of 826 in TX (top 8%) — acceptable for families but not a draw, mixed tenant base, ~2y average lease.
- Zoned schools: Wilkinson El (math 38% / reading 43%, grade F, #1,490 of 4,322 statewide, top 35%, 944 students, 54% FRL); Peet J H (math 45% / reading 50%, grade C-, #408 of 1,662 statewide, top 25%, 1,289 students, 58% FRL); Conroe H S (math 32% / reading 51%, grade F, #767 of 1,632 statewide, top 47%, 4,915 students, 61% FRL) — zoned schools average 58% FRL vs 34% district-wide (23 pts higher); higher-poverty schools than district average — tighter screening recommended.
- Zoned-school proficiency averages 43% at this address vs 57% district-wide (-14 pts) — the specific schools serving this property underperform the Conroe ISD average; the district grade overstates school quality for this exact location.
- Market conditions: Rents rising (+3.3%/yr); 1120 active listings in the ZIP; 3 comparable units currently listed for rent nearby; rentals at typical pace (median 27d on market — plan ~3-4 weeks tenant-placement turnaround); solid renter incomes; 13,259 units permitted in Montgomery County in 2024 (1,402 in 5+ unit buildings).
- This rent runs 43% of the median local income ($85k/yr) — at the standard rent-burdened threshold; future hikes will face affordability resistance.
Forward outlook
- Local home prices are declining (-3.0%/yr); year-one equity from $2k of loan paydown is wiped out by about $10k of value loss. Plan a longer hold.
- Montgomery County population projected at +65% by 2050 — long-run rental-demand tailwind backs the buy-and-hold thesis.
Negotiation context
- It's been on market 49 days — a 3% lower offer ($309k) is reasonable based on typical stale-listing flexibility.
- 8 sale attempts since 9y ago with the ask held roughly flat each time — persistent listings suggest the price (not the market) is what's stuck; bring a comps-based counter.
Risks & watch-outs
- Climate carrying-cost: major flood risk; severe wind risk, 99% chance of damaging wind over 30y; extreme-heat days projected 7→24/yr by 2055 (HVAC capex compounding) — expect insurance premiums to compound above CPI over the hold.
Questions for the listing agent
- What do current leases actually rent for vs. the listed asking? Can we see a recent rent roll and the last 12 months of T-12 income?
- It's been on market 49 days. Have you received any prior offers? Is the seller open to a 4% concession, seller financing, or rate buy-down credit?
- Built in 1969 — when were the roof, HVAC, electrical panel, plumbing, and water heater last replaced?
- What does the HOA fee cover, when was the last increase, and are there any pending special assessments or reserve-fund shortfalls?
- Is there a deadline driving the sale (1031 exchange, divorce, estate, relocation)? That informs how much negotiation room exists.
- Schools are D-rated, which usually means shorter tenancies and higher turnover. Who's the typical renter profile here, and what's been the actual vacancy rate?
- The area grade is low — what's the realistic commute time and amenity access for the typical tenant pool here? Any planned neighborhood developments (good or bad) we should know about?
- What's the average days-on-market for RENTAL listings here right now (not sales)? A rising rental-DOM trend means longer vacancies and softer asking-rent achievability than the comps imply.
- What's the recent tenant-quality profile in this submarket — average credit score on applications, eviction rate, late-payment / NSF rate, and stable-employment percentage? A property-management company in the area should have these aggregated.
- How much new for-sale + rental construction is in the pipeline within 1–3 miles? Heavy new supply typically softens prices + rents 12–24 months out; constrained supply supports both.
Investment metrics
- 1% rule
- 0.96% ✗
- Cap rate
- 6.27%
- Cash-on-cash
- -0.07%
- DSCR
- 1.00
- GRM
- 8.7
CMA / ARV
- ARV (median comp)
- $319,625
- List price
- $319,000
- Delta
- -0.20%
- Verdict
- FAIR
- Comps
- 20 within 1.0 mi
Show comp detail 12 sales within ~0.75 mi
| Address | Dist | Beds/Ba | Sqft | Sold | Price | $/sf | Match |
|---|---|---|---|---|---|---|---|
| 502 Monitor Park | 0.10mi | 3/2.5 (-1) | 2,580 (+2%) | 1mo | $425,000 | $165 | 86 |
| 526 Marymont Park | 0.14mi | 4/3.0 | 2,503 (-1%) | 7mo | $365,000 | $146 | 85 |
| 614 Orangewood Dr | 0.43mi | 4/2.5 | 2,688 (+6%) | 3mo | $289,900 | $108 | 67 |
| 12846 Meadow Wind Way | 0.60mi | 4/2.5 | 2,442 (-3%) | 3mo | $389,514 | $160 | 64 |
| 530 Bull Run Ct | 0.57mi | 4/2.5 | 2,665 (+6%) | 1mo | $299,900 | $113 | 63 |
| 12853 Meadow Wind Way | 0.60mi | 4/2.5 | 2,630 (+4%) | 3mo | $406,704 | $155 | 63 |
| 606 Orangewood Dr | 0.41mi | 5/4.0 (+1) | 2,668 (+6%) | 6mo | $350,000 | $131 | 55 |
| 702 Fairway Oaks | 0.61mi | 3/3.0 (-1) | 2,702 (+7%) | 3mo | $554,000 | $205 | 50 |
| 528 Robert E Lee Dr | 0.67mi | 5/2.5 (+1) | 2,670 (+6%) | 4mo | $250,000 | $94 | 50 |
| 12818 Meadow Wind Way | 0.60mi | 4/2.5 | 2,206 (-13%) | 1mo | $364,315 | $165 | 50 |
| 559 Hampton Rd | 0.55mi | 4/3.5 | 2,804 (+11%) | 2mo | $419,000 | $149 | 50 |
| 454 Stephen F Austin Dr | 0.69mi | 4/3.5 | 2,693 (+7%) | 5mo | $374,500 | $139 | 48 |
Match score weights: distance 35% · size 25% · config 20% · recency 20%. Top-matched comps best support the ARV.
Projected returns pro-forma
-3.0% appreciation · 3.3% rent growth · sell at horizon
- IRR
- -16.0%
- Equity multiple
- 0.43×
- Total profit
- $-50,916
- Equity at exit
- $47,564
- IRR
- -6.9%
- Equity multiple
- 0.55×
- Total profit
- $-40,232
- Equity at exit
- $27,581
Cash invested: $89,320 (down + closing). Projections, not guarantees.
Landlord ↔ Tenant lean methodology
- Overall (STATE)
- 87 Strongly Landlord-Friendly
- State Texas
- 87 Strongly Landlord-Friendly · R+5
- County
- — inherits STATE
- City
- — inherits STATE
ZIP-level market 77302
- Rents YoY
- 3.3%
- Active inventory
- 1120
- Price-to-rent
- 8.7×
Monthly cashflow live
- Estimated rent
- $3,049 medium interval (Pro) →
- Mortgage (P&I)
- −$1,673
- Tax from tax record
- −$518 /mo · $6,217/yr
- Insurance
- −$133
- HOA
- −$90
- Lot rent
- −$0
- Vacancy / Maint / Mgmt
- −$640
- Net cashflow
- $-5
Break-even live
Sensitivity live
| Price | -10% $176 | -5% $85 | +0% $-5 | +5% $-95 | +10% $-186 |
|---|---|---|---|---|---|
| Rent | -10% $-246 | -5% $-126 | +0% $-5 | +5% $115 | +10% $236 |
| Rate | -1.0pp $156 | -0.5pp $76 | base $-5 | +0.5pp $-88 | +1.0pp $-172 |
UW: 25.0% down · 7.5% · 30yr · 1.5% tax · 5.0% vac · 8.0% maint · 8.0% mgmt
Financing live
Cash to close
- Down payment
- $79,750
- Closing costs
- $9,570
- Reserves months
- —
- Total cash needed
- —
Loan-product check · same deal, 3 products live
Conventional
25% down · 7.5% · 30yr
- Down + closing
- —
- Monthly P&I
- —
- Monthly cashflow
- —
- DSCR
- —
- Eligible?
- —
Personal DTI + credit; lowest rate.
DSCR
20% down · 8.5% · 30yr
- Down + closing
- —
- Monthly P&I
- —
- Monthly cashflow
- —
- DSCR
- —
- Eligible?
- —
No personal income docs; deal must DSCR.
Hard money
10% down · 12.0% · 12mo
- Down + closing
- —
- Monthly P&I
- —
- Monthly cashflow
- —
- DSCR
- —
- Eligible?
- —
Short-term bridge; refi at stabilization.
Rent comps 3 comps
| Address | Beds | Baths | Sqft | Rent | $/sqft | DOM | Units | Dist |
|---|---|---|---|---|---|---|---|---|
| 493 Monticello Park Conroe, TX | 5.0 | 3.5 | 2921 | $3,400 | $1.16 | 26d | 1 | 0.60mi |
| 461 Stephen F Austin Dr Conroe, TX | 4.0 | 2.5 | 3023 | $3,036 | $1.00 | 7d | 1 | 0.70mi |
| 915 Longleaf Ln Conroe, TX | 3.0 | 2.0 | 1767 | $1,975 | $1.12 | 46d | 1 | 1.01mi |
HOA detail
- Monthly dues
- $90 · $1,080/yr
Listing history 42 events
-
2026-06-22days on market $319,000 Active 49 DOM
-
2026-06-21days on market $319,000 Active 48 DOM
-
2026-06-18days on market $319,000 Active 45 DOM
-
2026-06-17days on market $319,000 Active 44 DOM
-
2026-06-16days on market $319,000 Active 43 DOM
-
2026-06-15days on market $319,000 Active 42 DOM
-
2026-06-13days on market $319,000 Active 40 DOM
-
2026-06-09days on market $319,000 Active 36 DOM
-
2026-06-08days on market $319,000 Active 35 DOM
-
2026-06-07days on market $319,000 Active 34 DOM
-
2026-06-04days on market $319,000 Active 31 DOM
-
2026-06-03days on market $319,000 Active 30 DOM
-
2026-06-02days on market $319,000 Active 29 DOM
-
2026-06-01days on market $319,000 Active 28 DOM
-
2026-05-31days on market $319,000 Active 27 DOM
-
2026-05-04$319,000 Active 618-char remark
-
2026-05-04historical
-
2025-10-31$330,000 Active
-
2025-10-14historical
-
2025-10-01status Active
-
2025-09-28historical
-
2025-06-13price $330,000
-
2025-04-30status Active
-
2025-04-29historical
-
2025-04-28price $335,000
-
2025-04-03price $344,500
-
2025-03-10price $349,800
-
2025-03-09$348,500 Active
-
2024-09-06soldstatus
-
2020-09-25soldstatus
-
2020-09-24soldstatus Sold
-
2020-09-06status Pending
-
2020-08-31status Option Pending
-
2020-04-03$229,900 Active
-
2018-03-22historical
-
2018-03-01$239,900 Active
-
2018-02-28historical
-
2018-01-17price $242,900
-
2017-12-01price $249,900
-
2017-11-09$259,900 Active
-
2016-07-22soldstatus
-
2006-04-07soldstatus
ⓘ Source: listings_history table (triggers on properties + properties_extension) + one-shot
backfill from property_details.listing_events for pre-trigger history.
Tax reassessment forecast TX · Resets to sale price
- Current annual tax
- $6,217 · $518/mo
- Projected year-2 tax
- $6,217 · $518/mo
- Expected delta
- $0/yr ($0/mo · 0.0%)
ⓘ Screening estimate from a state-policy table — verify with the county assessor before closing.
Climate risk First Street
- Flood 6/10 Major FEMA zone X (unshaded) · 74% chance over 30 yrs
- Wildfire 2/10 Low
- Heat 9/10 Extreme 7 d/yr ≥111°F today · 24 d/yr by 30 yrs out
- Wind 8/10 Severe 99% chance of damaging wind over 30 yrs
- Air quality 2/10 Low 2 unhealthy d/yr today · 2 by 30 yrs out
Nearby sold comps map
Loading sold comps map…
Walkable amenities ~0.75 mi
Loading nearby amenities…
Taxation est. · year 1
- Rental income
- $36,590
- − Mortgage interest
- −$17,869
- − Property taxes
- −$6,217
- − Insurance
- −$1,595
- − Repairs & maintenance
- −$2,927
- − Management
- −$2,927
- − HOA
- −$1,080
- − Depreciation
- −$9,280
- Taxable loss
- −$5,306
- Est. tax savings @ 24.0%
- +$1,273
- After-tax cash flow
- $1,213/yr
For passive investors: Depreciation is non-cash, so a rental often shows a tax loss while cash-flowing — sheltering income. Rental losses are passive: they offset passive income freely, and up to $25,000/yr can offset ordinary (W-2) income if you actively participate and your MAGI is under $100k (phasing out to $0 by $150k); unused losses carry forward. On sale, claimed depreciation is recaptured at up to 25%, and gains may owe capital-gains tax (a 1031 exchange can defer both). Figures are a year-1 estimate at your 24.0% rate — not tax advice; consult a CPA.
Schools (NCES district)
- District
- Conroe ISD
- NCES district ID
- 4815000
- Math proficiency
- 57% ▼ -6.00%
- Reading proficiency
- 57% ▼ -1.00%
- Median HH income
- $71,541
- Composite
- 50.65/100
- National rank
- #1833
- State rank
- #69 of 826 in TX
Livability — Conroe
- Score
- 74/100
- State rank
- #169
- US rank
- #4447
Category grades
Schools grade is shown separately in the Schools card above.
Census & demographics
- County
- Montgomery County · 663,713 people
- City population
- 205,417
- Metro
- Houston-The Woodlands-Sugar Land, TX
- Population (ZIP)
- 21,546
- Household income
- $84,673
- Rent vs Own
- Severe rent burden
- 205.0
Population outlook (Montgomery County) Hauer SSP2
- Today (2025)
- 713,896 people
- By 2030
- 805,263 · +12.8%
- By 2040
- 992,708 · +39.1%
- By 2050
- 1,179,590 · +65.2%
- By 2075
- 1,628,084 · +128.1%
- By 2100
- 1,937,880 · +171.5%
Race, ethnicity, and origin ACS 2023
- Neighborhood character
- Majority White (63%)
- Race & ethnicity
- White 63% Hispanic / Latino 29% Two or more races 19% Black 3% Asian 1%
- Hispanic origin (detail)
- Mexican 26% Puerto Rican 1%
- Common ancestry
- Lithuanian 3% Italian 2% Slovak 2%
- Foreign-born
- 13% · Canada, Vietnam, China
- Languages at home
- 78% English-only · Spanish 20% Russian/Polish/Slavic 1% Other Indo-European 0%
Political lean MEDSL · Montgomery
- 2024 margin
- Solid R (+45.5) · D 26.8% · R 72.3%
- 2008→2024 swing
- +7.2pp toward D · 2008: -52.7pp · 2024: -45.5pp
- All cycles
- 2024: R+45.5 2020: R+43.8 2016: R+51.4 2012: R+60.7 2008: R+52.7
Not yet ingested
- Civics
- —
Market trends
- HPI YoY
- ▼ -187.56%
- Current HPI
- 262.1879
- Rent YoY
- ▲ 3.30%
- Metro
- Houston-The Woodlands-Sugar Land, TX
- State GDP YoY
- ▲ 3.95%
- F500 in state
- 110
Industry mix (Fortune 500 HQ in TX)
| Industry | F500 HQs | Revenue |
|---|---|---|
| Energy | 16 | $1,198B |
|
||
| Technology | 5 | $198B |
|
||
| Engineering / Construction | 4 | $72B |
|
||
| Energy Services | 3 | $60B |
|
||
| Utilities | 3 | $41B |
|
||
| Healthcare | 2 | $330B |
|
||
Price history
+22.7% since first listed27 events — show timeline
- 2026-05-04 Listing Removed — HARMLS
- 2026-05-04 Listed $319,000 HARMLS
- 2025-10-31 Listed $330,000 HARMLS
- 2025-10-14 Listing Removed — HARMLS
- 2025-10-01 Relisted — HARMLS
- 2025-09-28 Listing Removed — HARMLS
- 2025-06-13 Price Changed $330,000 HARMLS
- 2025-04-30 Relisted — HARMLS
- 2025-04-29 Listing Removed — HARMLS
- 2025-04-28 Price Changed $335,000 HARMLS
- 2025-04-03 Price Changed $344,500 HARMLS
- 2025-03-10 Price Changed $349,800 HARMLS
- 2025-03-09 Listed $348,500 HARMLS
- 2024-09-06 Sold (Public Records) — Public Records
- 2020-09-25 Sold (Public Records) — Public Records
- 2020-09-24 Sold (MLS) — HARMLS
- 2020-09-06 Pending — HARMLS
- 2020-08-31 Pending — HARMLS
- 2020-04-03 Listed $229,900 HARMLS
- 2018-03-22 Listing Removed — HARMLS
- 2018-03-01 Listed $239,900 HARMLS
- 2018-02-28 Listing Removed — HARMLS
- 2018-01-17 Price Changed $242,900 HARMLS
- 2017-12-01 Price Changed $249,900 HARMLS
- 2017-11-09 Listed $259,900 HARMLS
- 2016-07-22 Sold (Public Records) — Public Records
- 2006-04-07 Sold (Public Records) — Public Records
Property tax history
+5.6%/yrLatest (2025): $6,217 · -3.7% YoY. Source: county tax records.
Cash-flow waterfall
monthlySold comps — $/sqft
last 12 mo · ≤1 miLoading sold comps…