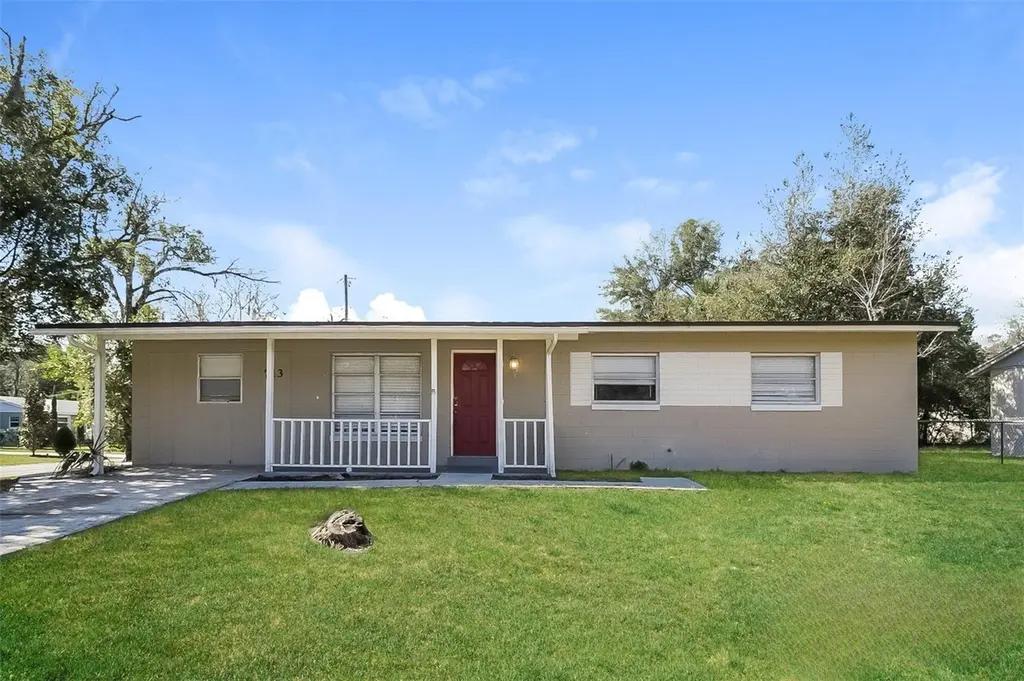
713 Laisy Dr · DeLand, FL
Flood risk 1/10 · Minimal
- FEMA flood zone
- X (unshaded)
- Chance of flooding over 30 yrs
- 0.0%
- Est. flood insurance / yr
- $507 – $1,088
Fire risk 1/10 · Minimal
- Est. fire insurance / yr
- $947 – $1,759
Heat risk 9/10 · Severe
- Hot days now (above 107°F)
- 7 days/yr
- Hot days in 30 yrs
- 20 days/yr
Wind risk 9/10 · Severe
- Chance of severe wind over 30 yrs
- 99.0%
Air-quality risk 2/10 · Minimal
- Unhealthy air days now
- 1 days/yr
- Unhealthy air days in 30 yrs
- 1 days/yr
Risk factors via First Street. Map © Google.
Why this score? — see what drove the D grade
The composite is a weighted blend of 9 inputs, each scored 0–100. Each bar is that input's sub-score; the figure is the points it added to the 100-point composite (weight × sub-score).
- Cash flow +14.3/30.0
- ARV discount +7.5/15.0
- DSCR +4.3/10.0
- Schools +3.9/10.0
- 1% rule +3.7/10.0
- Livability +3.4/5.0
- Rent growth +3.2/5.0
- Condition / age +2.5/5.0
- Appreciation +0.0/10.0
$199,900
🖨 Deal sheet (PDF) 📄 Offer letter ✓ Due diligence
Listing remarks MLS
Under contract taking backups. .. SHORT SALE - Investors special - in need of some repair but has great potential. Garage can be converted back. Sold as is.
Key facts
- 8,715 sq ft lot
- Built 1960
- Listed 5 days
Property features AI
Finance
- Other: Residential zoning (05R-1B); Unfurnished; Living area about 1,040 square feet
- Financial info: No lease restrictions
- HOA & community: No association
Exterior
- Parking: Driveway
- Utilities: Public water; Public sewer; Electricity connected; Water connected; Sewer connected
- Home design: Single family residence; One story; East-facing entry
- Construction: Block construction; Shingle roof; Slab foundation; Built on lot of about 0.2 acres
- Exterior features: Sidewalk; Paved road access
Interior
- Kitchen: Microwave; Range; Refrigerator
- Bedrooms: 3 bedrooms
- Flooring: Tile flooring; Vinyl flooring
- Bathrooms: 1 full bath; 1 half bath
- Heating & cooling: Natural gas heating; Central air conditioning
- Interior features: Ceiling fans
- Laundry & utility: Laundry room (other)
Neighborhood map
What this means for you Summary
Snapshot
- This is a 3-bed/1.5-bath single-family listed at $200k.
Deal economics
- At list price, monthly cash flow is $36 ($431/yr) — positive.
- The deal already cash-flows at list — no discount required.
- To meet the 1% rule (rent ≥ 1% of price), the offer needs to be $173k (13.3% below list).
- Recommended offer: $173k (13.3% below list) — sets the bar for 1% rule.
Location & tenants
- Location reads 68/100 on livability (#498 in FL) — a middle-class / working-renter tenant base. Strengths: housing A+, cost of living A, crime B; Watch: amenities F, commute F, health & safety D-.
- Volusia (suburban): math 44% / reading 49% proficiency, ranked #47 of 73 in FL (top 64%) — families likely to look elsewhere, expect single-tenant / working-renter base with shorter leases.
- Zoned schools: Freedom Elementary School (math 55% / reading 64%, grade B-, #690 of 2,144 statewide, top 34%, 768 students, 49% FRL); Deland Middle School (math 38% / reading 43%, grade F, #360 of 571 statewide, top 64%, 1,074 students, 61% FRL); Deland High School (math 26% / reading 45%, grade F, #367 of 667 statewide, top 57%, 2,926 students, 50% FRL) — zoned schools at 53% FRL track the district average.
- Market conditions: Rents rising (+2.8%/yr); 669 active listings in the ZIP; 19 comparable units currently listed for rent nearby; rentals at typical pace (median 26d on market — plan ~3-4 weeks tenant-placement turnaround); 3,402 units permitted in Volusia County in 2024 (681 in 5+ unit buildings).
Forward outlook
- Local home prices are declining (-3.0%/yr); year-one equity from $1k of loan paydown is wiped out by about $6k of value loss. Plan a longer hold.
- Volusia County population projected at +19% by 2050 — long-run rental-demand tailwind backs the buy-and-hold thesis.
Negotiation context
- Only 5 days on market — expect competitive offers; lowballing is unlikely to land.
- 3 sale attempts since 15y ago with the ask held roughly flat each time — persistent listings suggest the price (not the market) is what's stuck; bring a comps-based counter.
- Current owner paid $25k; list at $200k implies a 700% gain — meaningful room to come down on a strong offer.
Risks & watch-outs
- Climate carrying-cost: severe wind risk, 99% chance of damaging wind over 30y; extreme-heat days projected 7→20/yr by 2055 (HVAC capex compounding) — expect insurance premiums to compound above CPI over the hold.
Questions for the listing agent
- Built in 1960 — when were the roof, HVAC, electrical panel, plumbing, and water heater last replaced?
- Is there a deadline driving the sale (1031 exchange, divorce, estate, relocation)? That informs how much negotiation room exists.
- Schools are D-rated, which usually means shorter tenancies and higher turnover. Who's the typical renter profile here, and what's been the actual vacancy rate?
- The area grade is low — what's the realistic commute time and amenity access for the typical tenant pool here? Any planned neighborhood developments (good or bad) we should know about?
- What's the average days-on-market for RENTAL listings here right now (not sales)? A rising rental-DOM trend means longer vacancies and softer asking-rent achievability than the comps imply.
- What's the recent tenant-quality profile in this submarket — average credit score on applications, eviction rate, late-payment / NSF rate, and stable-employment percentage? A property-management company in the area should have these aggregated.
- How much new for-sale + rental construction is in the pipeline within 1–3 miles? Heavy new supply typically softens prices + rents 12–24 months out; constrained supply supports both.
Investment metrics
- 1% rule
- 0.87% ✗
- Cap rate
- 6.51%
- Cash-on-cash
- 0.77%
- DSCR
- 1.03
- GRM
- 9.6
CMA / ARV
No comps found within radius.
Projected returns pro-forma
-3.0% appreciation · 2.82% rent growth · sell at horizon
- IRR
- -15.3%
- Equity multiple
- 0.46×
- Total profit
- $-30,421
- Equity at exit
- $29,806
- IRR
- -7.0%
- Equity multiple
- 0.56×
- Total profit
- $-24,840
- Equity at exit
- $17,284
Cash invested: $55,972 (down + closing). Projections, not guarantees.
Landlord ↔ Tenant lean methodology
- Overall (STATE)
- 87 Strongly Landlord-Friendly
- State Florida
- 87 Strongly Landlord-Friendly · R+3
- County
- — inherits STATE
- City
- — inherits STATE
ZIP-level market 32724
- Rents YoY
- 2.8%
- Active inventory
- 669
- Price-to-rent
- 9.6×
Monthly cashflow live
- Estimated rent
- $1,733 high interval (Pro) →
- Mortgage (P&I)
- −$1,048
- Tax from tax record
- −$201 /mo · $2,418/yr
- Insurance
- −$83
- HOA
- −$0
- Vacancy / Maint / Mgmt
- −$364
- Net cashflow
- $36
Break-even live
Sensitivity live
| Price | -10% $149 | -5% $93 | +0% $36 | +5% $-21 | +10% $-77 |
|---|---|---|---|---|---|
| Rent | -10% $-101 | -5% $-33 | +0% $36 | +5% $104 | +10% $173 |
| Rate | -1.0pp $137 | -0.5pp $87 | base $36 | +0.5pp $-16 | +1.0pp $-69 |
UW: 25.0% down · 7.5% · 30yr · 1.5% tax · 5.0% vac · 8.0% maint · 8.0% mgmt
Financing live
Cash to close
- Down payment
- $49,975
- Closing costs
- $5,997
- Reserves months
- —
- Total cash needed
- —
Loan-product check · same deal, 3 products live
Conventional
25% down · 7.5% · 30yr
- Down + closing
- —
- Monthly P&I
- —
- Monthly cashflow
- —
- DSCR
- —
- Eligible?
- —
Personal DTI + credit; lowest rate.
DSCR
20% down · 8.5% · 30yr
- Down + closing
- —
- Monthly P&I
- —
- Monthly cashflow
- —
- DSCR
- —
- Eligible?
- —
No personal income docs; deal must DSCR.
Hard money
10% down · 12.0% · 12mo
- Down + closing
- —
- Monthly P&I
- —
- Monthly cashflow
- —
- DSCR
- —
- Eligible?
- —
Short-term bridge; refi at stabilization.
Rent comps 19 comps
| Address | Beds | Baths | Sqft | Rent | $/sqft | DOM | Units | Dist |
|---|---|---|---|---|---|---|---|---|
| 400 E Howry Ave Deland, FL | 1.0–2.0 | 1.0–2.0 | 956 | $1,995 | $2.09 | 13d | 25 | 0.64mi |
| 240 E Howry Ave DeLand, FL | 2.0 | 1.0 | 816 | $1,500 | $1.84 | 25d | 1 | 0.70mi |
| 727 Wood St Deland, FL | 3.0 | 1.0 | 900 | $1,329 | $1.48 | 21d | 1 | 0.86mi |
| 1312 Water Willow Dr DeLand, FL | 1.0–2.0 | 1.0–2.0 | 785 | $1,324 | $1.69 | 25d | 1 | 0.90mi |
| 116 Hurts CT DeLand, FL | 3.0 | 2.0 | 1318 | $2,100 | $1.59 | 25d | 1 | 0.90mi |
| 622 E Rich Ave Deland, FL | 2.0 | 1.0 | 884 | $1,230 | $1.39 | 16d | 1 | 1.03mi |
| 737 S Stone St Deland, FL | 3.0 | 1.5 | 1050 | $1,695 | $1.61 | 25d | 1 | 1.05mi |
| 832 E Indiana Ave Deland, FL | 2.0 | 1.0 | 893 | $1,275 | $1.43 | 25d | 1 | 1.09mi |
| 903 E New York Ave DeLand, FL | 3.0 | 2.0 | 1500 | $2,200 | $1.47 | 25d | 1 | 1.10mi |
| 703 W Chelsea St Deland, FL | 3.0 | 2.0 | 1000 | $1,695 | $1.70 | 16d | 1 | 1.10mi |
| 313 Heritage Estates Ln Deland, FL | 3.0 | 2.0 | 1459 | $2,509 | $1.72 | 25d | 1 | 1.16mi |
| 121 N Colorado Ave Deland, FL | 2.0 | 1.0 | 770 | $1,095 | $1.42 | 21d | 1 | 1.25mi |
| 125 S Salisbury Ave Deland, FL | 2.0 | 1.0 | 625 | $1,200 | $1.92 | 16d | 2 | 1.26mi |
| 125 S Salisbury Ave Unit B4 DeLand, FL | 2.0 | 1.0 | 800 | $1,200 | $1.50 | 25d | 1 | 1.26mi |
| 315 Winslow Ave Deland, FL | 2.0 | 1.0 | 1100 | $1,450 | $1.32 | 25d | 1 | 1.26mi |
| 119 N Orange Ave Unit 2B DeLand, FL | 2.0 | 1.0 | 827 | $1,100 | $1.33 | 25d | 1 | 1.28mi |
| 611 S Boundary Ave DeLand, FL | 3.0 | 2.0 | 1423 | $1,200 | $0.84 | 13d | 1 | 1.32mi |
| 12 S University Cir Deland, FL | 2.0 | 2.0 | 1105 | $1,775 | $1.61 | 25d | 1 | 1.46mi |
| 919 E Michigan Ave Deland, FL | 2.0 | 2.0 | 1323 | $1,950 | $1.47 | 13d | 1 | 1.46mi |
Listing history 11 events
-
2026-05-12status Pending
-
2026-05-07$199,900 Active
-
2022-02-17price $1,469
-
2013-04-01soldstatus $25,000 156-char remark
Show marketing remark (156 chars)
Under contract taking backups. .. SHORT SALE - Investors special - in need of some repair but has great potential. Garage can be converted back. Sold as is.
-
2012-11-28historical 156-char remark
Show marketing remark (156 chars)
Under contract taking backups. .. SHORT SALE - Investors special - in need of some repair but has great potential. Garage can be converted back. Sold as is.
-
2012-11-14$28,000 156-char remark
Show marketing remark (156 chars)
Under contract taking backups. .. SHORT SALE - Investors special - in need of some repair but has great potential. Garage can be converted back. Sold as is.
-
2012-06-30historical
-
2011-06-27$45,000
-
2007-05-08soldstatus $115,000
-
2005-06-03soldstatus $85,000
-
1968-08-01soldstatus $11,000
ⓘ Source: listings_history table (triggers on properties + properties_extension) + one-shot
backfill from property_details.listing_events for pre-trigger history.
Tax reassessment forecast FL · Resets to sale price
- Current annual tax
- $2,418 · $201/mo
- Projected year-2 tax
- $2,418 · $201/mo
- Expected delta
- $0/yr ($0/mo · 0.0%)
ⓘ Screening estimate from a state-policy table — verify with the county assessor before closing.
Climate risk First Street
- Flood 1/10 Low FEMA zone X (unshaded) · 0% chance over 30 yrs
- Wildfire 1/10 Low
- Heat 9/10 Extreme 7 d/yr ≥107°F today · 20 d/yr by 30 yrs out
- Wind 9/10 Extreme 99% chance of damaging wind over 30 yrs
- Air quality 2/10 Low 1 unhealthy d/yr today · 1 by 30 yrs out
Nearby sold comps map
Loading sold comps map…
Walkable amenities ~0.75 mi
Loading nearby amenities…
Taxation est. · year 1
- Rental income
- $20,795
- − Mortgage interest
- −$11,198
- − Property taxes
- −$2,418
- − Insurance
- −$1,000
- − Repairs & maintenance
- −$1,664
- − Management
- −$1,664
- − Depreciation
- −$5,815
- Taxable loss
- −$2,962
- Est. tax savings @ 24.0%
- +$711
- After-tax cash flow
- $1,142/yr
For passive investors: Depreciation is non-cash, so a rental often shows a tax loss while cash-flowing — sheltering income. Rental losses are passive: they offset passive income freely, and up to $25,000/yr can offset ordinary (W-2) income if you actively participate and your MAGI is under $100k (phasing out to $0 by $150k); unused losses carry forward. On sale, claimed depreciation is recaptured at up to 25%, and gains may owe capital-gains tax (a 1031 exchange can defer both). Figures are a year-1 estimate at your 24.0% rate — not tax advice; consult a CPA.
Schools (NCES district)
- District
- Volusia
- NCES district ID
- 1201920
- Math proficiency
- 44% ▼ -9.00%
- Reading proficiency
- 49% ▼ -3.00%
- Median HH income
- $42,946
- Composite
- 39.2/100
- National rank
- #4019
- State rank
- #47 of 73 in FL
Livability — DeLand
- Score
- 68/100
- State rank
- #498
- US rank
- #9197
Category grades
Schools grade is shown separately in the Schools card above.
Census & demographics
- Census place
- DeLand, FL
- County
- Volusia County · 556,871 people
- City population
- 81,399
- Metro
- Deltona-Daytona Beach-Ormond Beach, FL
- Population (ZIP)
- 45,140
- Household income
- $73,592
- Rent vs Own
- Severe rent burden
- 942.0
Population outlook (Volusia County) Hauer SSP2
- Today (2025)
- 572,749 people
- By 2030
- 598,695 · +4.5%
- By 2040
- 644,880 · +12.6%
- By 2050
- 681,451 · +19.0%
- By 2075
- 759,957 · +32.7%
- By 2100
- 778,902 · +36.0%
Race, ethnicity, and origin ACS 2023
- Neighborhood character
- Predominantly White (71%)
- Race & ethnicity
- White 71% Hispanic / Latino 19% Two or more races 9% Black 6% Asian 1%
- Hispanic origin (detail)
- Mexican 9% Puerto Rican 5%
- Common ancestry
- Romanian 2% Slovak 2% Lithuanian 2%
- Foreign-born
- 10% · Canada, Jamaica
- Languages at home
- 83% English-only · Spanish 14% Other Indo-European 1% French/Haitian/Cajun 1%
Political lean MEDSL · Volusia
- 2024 margin
- Strong R (+21.8) · D 38.7% · R 60.5%
- 2008→2024 swing
- -27.4pp toward R · 2008: 5.7pp · 2024: -21.8pp
- All cycles
- 2024: R+21.8 2020: R+14.1 2016: R+13.1 2012: R+1.2 2008: D+5.7
Not yet ingested
- Civics
- —
Market trends
- HPI YoY
- ▼ -215.80%
- Current HPI
- 297.1837
- Rent YoY
- ▲ 2.82%
- Metro
- Deltona-Daytona Beach-Ormond Beach, FL
- State GDP YoY
- ▲ 3.28%
- F500 in state
- 36
Industry mix (Fortune 500 HQ in FL)
| Industry | F500 HQs | Revenue |
|---|---|---|
| Industrial Technology | 2 | $29B |
|
||
| Insurance | 2 | $17B |
|
||
| Retail | 1 | $60B |
|
||
| Technology Distribution | 1 | $58B |
|
||
| Homebuilding | 1 | $35B |
|
||
| Technology Manufacturing | 1 | $35B |
|
||
Price history
+1717.3% since first listed11 events — show timeline
- 2026-05-12 Pending — Stellar MLS as Distributed by MLS Grid
- 2026-05-07 Listed $199,900 Stellar MLS as Distributed by MLS Grid
- 2022-02-17 Price Changed $1,469 RENT.
- 2013-04-01 Sold (MLS) $25,000 Stellar MLS as Distributed by MLS Grid
- 2012-11-28 Listing Removed — Stellar MLS as Distributed by MLS Grid
- 2012-11-14 Listed $28,000 Stellar MLS as Distributed by MLS Grid
- 2012-06-30 Listing Removed — Stellar MLS as Distributed by MLS Grid
- 2011-06-27 Listed $45,000 Stellar MLS as Distributed by MLS Grid
- 2007-05-08 Sold (Public Records) $115,000 Public Records
- 2005-06-03 Sold (Public Records) $85,000 Public Records
- 1968-08-01 Sold (Public Records) $11,000 Public Records
Property tax history
+11.2%/yrLatest (2025): $2,418 · +5.5% YoY. Source: county tax records.
Cash-flow waterfall
monthlySold comps — $/sqft
last 12 mo · ≤1 miLoading sold comps…