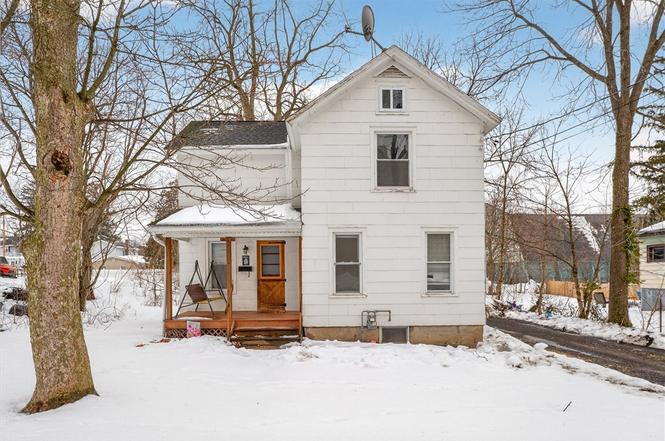
224 Norton St · Newark, NY
Flood risk No data
- FEMA flood zone
- —
- Chance of flooding over 30 yrs
- —
- Est. flood insurance / yr
- —
Fire risk No data
- Est. fire insurance / yr
- —
Heat risk No data
- Hot days now (above threshold)
- —
- Hot days in 30 yrs
- —
Wind risk No data
- Chance of severe wind over 30 yrs
- —
Air-quality risk No data
- Unhealthy air days now
- —
- Unhealthy air days in 30 yrs
- —
Risk factors via First Street. Map © Google.
Why this score? — see what drove the C+ grade
The composite is a weighted blend of 9 inputs, each scored 0–100. Each bar is that input's sub-score; the figure is the points it added to the 100-point composite (weight × sub-score).
- Cash flow +20.8/30.0
- ARV discount +15.0/15.0
- DSCR +6.6/10.0
- 1% rule +5.9/10.0
- Livability +3.6/5.0
- Schools +3.4/10.0
- Rent growth +2.5/5.0
- Condition / age +2.5/5.0
- Appreciation +0.0/10.0
$110,000
🖨 Deal sheet (PDF) 📄 Offer letter ✓ Due diligence
Listing remarks MLS
Two bedroom in need of rehab. Stove and refrigerator included. Sold in "as is condition". Cash only.
Key facts
- Natural woodwork
- 7,405 sq ft lot
- Built 1900
Tags
Neighborhood map
What this means for you Summary
Snapshot
- This is a 2-bed/1.0-bath single-family listed at $110k.
Deal economics
- At list price, monthly cash flow is $152 ($2k/yr) — positive.
- The deal already cash-flows at list — no discount required.
- Meets the 1% rule at list price ($1k rent vs $110k).
- Recommended offer: $107k (3.0% below list) — sets the bar for market timing.
- Cap rate 7.9% vs local median 5.0% in Newark — top-decile yield for the area; either an underpriced asset or a hidden risk that comps aren't pricing in. Stress-test before assuming the spread holds.
Location & tenants
- Location reads 71/100 on livability (#405 in NY) — a middle-class / working-renter tenant base. Strengths: cost of living A+, housing A+, commute B; Watch: employment D+, crime F, amenities F.
- Newark Central School District (town): math 33% / reading 46% proficiency, ranked #527 of 590 in NY (top 89%) — families likely to look elsewhere, expect single-tenant / working-renter base with shorter leases.
- Zoned schools: Norman R Kelley Intermediate School (math 34% / reading 41%, grade F, #1,516 of 2,108 statewide, top 72%, 387 students, 62% FRL); Newark Middle School (math 10% / reading 38%, grade F, #640 of 729 statewide, top 88%, 445 students, 59% FRL); Newark Senior High School (math 77% / reading 82%, grade A-, #518 of 1,100 statewide, top 51%, 602 students, 54% FRL) — zoned schools average 58% FRL vs 43% district-wide (16 pts higher); higher-poverty schools than district average — tighter screening recommended.
- Market conditions: 43 active listings in the ZIP; 1 comparable units currently listed for rent nearby; 259 units permitted in Wayne County in 2024 (90 in 5+ unit buildings).
Forward outlook
- Local home prices are declining (-3.0%/yr); year-one equity from $761 of loan paydown is wiped out by about $3k of value loss. Plan a longer hold.
- Wayne County population projected at -24% by 2050 — secular population decline; favor cash flow + early exit over multi-decade hold.
Negotiation context
- It's been on market 42 days — a 3% lower offer ($107k) is reasonable based on typical stale-listing flexibility.
- 2 sale attempts since 15y ago with the ask held roughly flat each time — persistent listings suggest the price (not the market) is what's stuck; bring a comps-based counter.
- Current owner paid $15k; list at $110k implies a 627% gain — meaningful room to come down on a strong offer.
Risks & watch-outs
- Watch-outs: built in 1900 — expect roof / HVAC / electrical / plumbing capex.
Questions for the listing agent
- It's been on market 42 days. Have you received any prior offers? Is the seller open to a 3% concession, seller financing, or rate buy-down credit?
- Built in 1900 — when were the roof, HVAC, electrical panel, plumbing, and water heater last replaced?
- Is there a deadline driving the sale (1031 exchange, divorce, estate, relocation)? That informs how much negotiation room exists.
- Schools are D-rated, which usually means shorter tenancies and higher turnover. Who's the typical renter profile here, and what's been the actual vacancy rate?
- Crime grade is F in this area — have there been break-ins, vandalism, or insurance claims at this property in the last 3 years? What carrier currently insures it and at what premium?
- What's the average days-on-market for RENTAL listings here right now (not sales)? A rising rental-DOM trend means longer vacancies and softer asking-rent achievability than the comps imply.
- What's the recent tenant-quality profile in this submarket — average credit score on applications, eviction rate, late-payment / NSF rate, and stable-employment percentage? A property-management company in the area should have these aggregated.
- How much new for-sale + rental construction is in the pipeline within 1–3 miles? Heavy new supply typically softens prices + rents 12–24 months out; constrained supply supports both.
Investment metrics
- 1% rule
- 1.09% ✓
- Cap rate
- 7.95%
- Cash-on-cash
- 5.90%
- DSCR
- 1.26
- GRM
- 7.6
CMA / ARV
- ARV (on-the-fly)
- $135,036
- Comps found
- 9
Show comp detail 9 sales within ~0.75 mi
| Address | Dist | Beds/Ba | Sqft | Sold | Price | $/sf | Match |
|---|---|---|---|---|---|---|---|
| 232 Norton St | 0.02mi | 3/1.0 (+1) | 1,120 (+0%) | 19mo | $135,000 | $121 | 78 |
| 350 E Union St | 0.36mi | 2/1.5 | 1,139 (+2%) | 7mo | $109,250 | $96 | 72 |
| 407 E Miller St | 0.39mi | 2/1.5 | 1,116 (0%) | 11mo | $15,000 | $13 | 71 |
| 112 Sherman Pkwy | 0.25mi | 3/1.5 (+1) | 1,138 (+2%) | 19mo | $170,000 | $149 | 62 |
| 307 W Miller St | 0.64mi | 2/1.0 | 1,161 (+4%) | 14mo | $202,000 | $174 | 52 |
| 204 Ford St | 0.19mi | 3/1.0 (+1) | 1,260 (+13%) | 22mo | $103,000 | $82 | 46 |
| 802 Driving Park Ave | 0.62mi | 2/1.0 | 950 (-15%) | 6mo | $125,000 | $132 | 41 |
| 438 Van Buren St | 0.67mi | 2/1.5 | 1,220 (+9%) | 23mo | $185,000 | $152 | 32 |
| 104 W Godfrey St | 0.74mi | 3/1.0 (+1) | 1,224 (+10%) | 19mo | $110,000 | $90 | 28 |
Match score weights: distance 35% · size 25% · config 20% · recency 20%. Top-matched comps best support the ARV.
Projected returns pro-forma
-3.0% appreciation · 3.0% rent growth · sell at horizon
- IRR
- -7.1%
- Equity multiple
- 0.74×
- Total profit
- $-8,132
- Equity at exit
- $16,401
- IRR
- 2.5%
- Equity multiple
- 1.18×
- Total profit
- $5,513
- Equity at exit
- $9,511
Cash invested: $30,800 (down + closing). Projections, not guarantees.
Landlord ↔ Tenant lean methodology
- Overall (STATE)
- 15 Strongly Tenant-Friendly
- State New York
- 15 Strongly Tenant-Friendly · D+10
- County
- — inherits STATE
- City
- — inherits STATE
ZIP-level market 14513
- Home prices YoY
- -16.7%
- Active inventory
- 43
- Price-to-rent
- 7.6×
Monthly cashflow live
- Estimated rent
- $1,200 medium interval (Pro) →
- Mortgage (P&I)
- −$577
- Tax from tax record
- −$174 /mo · $2,085/yr
- Insurance
- −$46
- HOA
- −$0
- Vacancy / Maint / Mgmt
- −$252
- Net cashflow
- $152
Break-even live
Sensitivity live
| Price | -10% $214 | -5% $183 | +0% $152 | +5% $120 | +10% $89 |
|---|---|---|---|---|---|
| Rent | -10% $57 | -5% $104 | +0% $152 | +5% $199 | +10% $246 |
| Rate | -1.0pp $207 | -0.5pp $180 | base $152 | +0.5pp $123 | +1.0pp $94 |
UW: 25.0% down · 7.5% · 30yr · 1.5% tax · 5.0% vac · 8.0% maint · 8.0% mgmt
Financing live
Cash to close
- Down payment
- $27,500
- Closing costs
- $3,300
- Reserves months
- —
- Total cash needed
- —
Loan-product check · same deal, 3 products live
Conventional
25% down · 7.5% · 30yr
- Down + closing
- —
- Monthly P&I
- —
- Monthly cashflow
- —
- DSCR
- —
- Eligible?
- —
Personal DTI + credit; lowest rate.
DSCR
20% down · 8.5% · 30yr
- Down + closing
- —
- Monthly P&I
- —
- Monthly cashflow
- —
- DSCR
- —
- Eligible?
- —
No personal income docs; deal must DSCR.
Hard money
10% down · 12.0% · 12mo
- Down + closing
- —
- Monthly P&I
- —
- Monthly cashflow
- —
- DSCR
- —
- Eligible?
- —
Short-term bridge; refi at stabilization.
Rent comps 1 comps
| Address | Beds | Baths | Sqft | Rent | $/sqft | DOM | Units | Dist |
|---|---|---|---|---|---|---|---|---|
| 310 Washington St Newark, NY | 2.0 | 1.0 | 900 | $1,200 | $1.33 | 4d | 1 | 0.90mi |
Listing history 5 events
-
2026-04-01status Pending
-
2026-02-18$110,000 Active
-
2012-05-30soldstatus $15,125
-
2012-05-29soldstatus $15,125 110-char remark
Show marketing remark (110 chars)
Two bedroom in need of rehab. Stove and refrigerator included. Sold in "as is condition". Cash only.
-
2011-10-21$28,000 110-char remark
Show marketing remark (110 chars)
Two bedroom in need of rehab. Stove and refrigerator included. Sold in "as is condition". Cash only.
ⓘ Source: listings_history table (triggers on properties + properties_extension) + one-shot
backfill from property_details.listing_events for pre-trigger history.
Tax reassessment forecast NY · Partial reset (capped growth)
- Current annual tax
- $2,085 · $174/mo
- Projected year-2 tax
- $2,085 · $174/mo
- Expected delta
- $0/yr ($0/mo · 0.0%)
ⓘ Screening estimate from a state-policy table — verify with the county assessor before closing.
Nearby sold comps map
Loading sold comps map…
Walkable amenities ~0.75 mi
Loading nearby amenities…
Taxation est. · year 1
- Rental income
- $14,400
- − Mortgage interest
- −$6,162
- − Property taxes
- −$2,085
- − Insurance
- −$550
- − Repairs & maintenance
- −$1,152
- − Management
- −$1,152
- − Depreciation
- −$3,200
- Taxable income
- $99
- Est. tax owed @ 24.0%
- −$24
- After-tax cash flow
- $1,795/yr
For passive investors: Depreciation is non-cash, so a rental often shows a tax loss while cash-flowing — sheltering income. Rental losses are passive: they offset passive income freely, and up to $25,000/yr can offset ordinary (W-2) income if you actively participate and your MAGI is under $100k (phasing out to $0 by $150k); unused losses carry forward. On sale, claimed depreciation is recaptured at up to 25%, and gains may owe capital-gains tax (a 1031 exchange can defer both). Figures are a year-1 estimate at your 24.0% rate — not tax advice; consult a CPA.
Schools (NCES district)
- District
- Newark Central School District
- NCES district ID
- 3620640
- Math proficiency
- 33% ▲ 2.00%
- Reading proficiency
- 46% ▲ 15.00%
- Median HH income
- $44,966
- Composite
- 33.55/100
- National rank
- #5428
- State rank
- #527 of 590 in NY
Livability — Newark
- Score
- 71/100
- State rank
- #405
- US rank
- #6978
Category grades
Schools grade is shown separately in the Schools card above.
Census & demographics
- Census place
- Newark, NY
- Population (ZIP)
- 13,501
Population outlook (Wayne County) Hauer SSP2
- Today (2025)
- 85,662 people
- By 2030
- 81,945 · -4.3%
- By 2040
- 73,735 · -13.9%
- By 2050
- 65,029 · -24.1%
- By 2075
- 47,451 · -44.6%
- By 2100
- 31,574 · -63.1%
Race, ethnicity, and origin ACS 2023
- Neighborhood character
- Predominantly White (80%)
- Race & ethnicity
- White 80% Hispanic / Latino 12% Two or more races 10% Black 3% Native American 1%
- Hispanic origin (detail)
- Puerto Rican 5%
- Common ancestry
- Iranian 13% Lithuanian 2% Romanian 2%
- Foreign-born
- 4% · Canada, Vietnam
- Languages at home
- 92% English-only · Spanish 7%
Political lean MEDSL · Wayne
- 2024 margin
- Strong R (+23.1) · D 38.5% · R 61.5%
- 2008→2024 swing
- -13.2pp toward R · 2008: -9.9pp · 2024: -23.1pp
- All cycles
- 2024: R+23.1 2020: R+19.6 2016: R+26.1 2012: R+9.3 2008: R+9.9
Not yet ingested
- Civics
- —
Market trends
- HPI YoY
- ▼ -50.98%
- Current HPI
- 253.627
- Rent YoY
- —
- Metro
- —
- State GDP YoY
- ▲ 2.60%
- F500 in state
- 92
Industry mix (Fortune 500 HQ in NY)
| Industry | F500 HQs | Revenue |
|---|---|---|
| Financial Services | 10 | $950B |
|
||
| Consumer Goods | 9 | $162B |
|
||
| Insurance | 4 | $225B |
|
||
| Telecommunications | 2 | $144B |
|
||
| Pharmaceuticals | 2 | $112B |
|
||
| Media / Entertainment | 2 | $69B |
|
||
Price history
+292.9% since first listed5 events — show timeline
- 2026-04-01 Pending — UNYREIS
- 2026-02-18 Listed $110,000 UNYREIS
- 2012-05-30 Sold (Public Records) $15,125 Public Records
- 2012-05-29 Sold (MLS) $15,125 UNYREIS
- 2011-10-21 Listed $28,000 UNYREIS
Property tax history
+0.3%/yrLatest (2025): $2,085 · -2.8% YoY. Source: county tax records.
Cash-flow waterfall
monthlySold comps — $/sqft
last 12 mo · ≤1 miLoading sold comps…