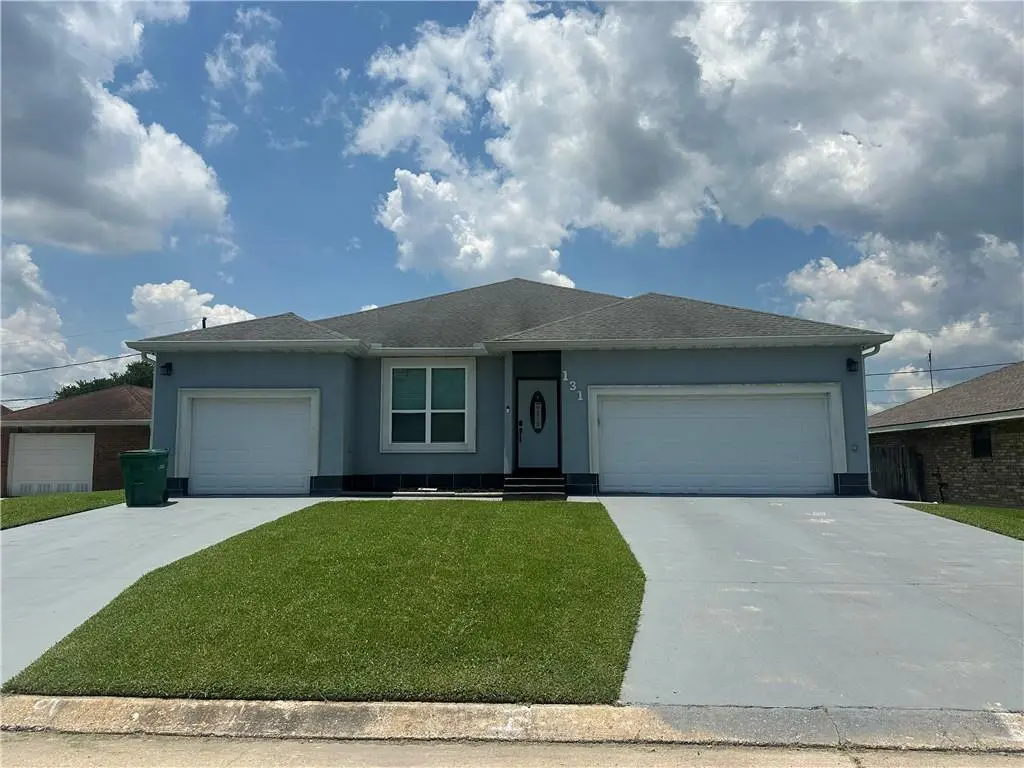
131 Belle Grove Dr · Laplace, LA
Flood risk 9/10 · Severe
- FEMA flood zone
- AE
- Chance of flooding over 30 yrs
- 0.99%
- Est. flood insurance / yr
- $1,737 – $8,500
Fire risk 1/10 · Minimal
- Est. fire insurance / yr
- $1,269 – $2,357
Heat risk 9/10 · Severe
- Hot days now (above 108°F)
- 7 days/yr
- Hot days in 30 yrs
- 21 days/yr
Wind risk 9/10 · Severe
- Chance of severe wind over 30 yrs
- 99.0%
Air-quality risk 3/10 · Minor
- Unhealthy air days now
- 2 days/yr
- Unhealthy air days in 30 yrs
- 3 days/yr
Risk factors via First Street. Map © Google.
Why this score? — see what drove the D- grade
The composite is a weighted blend of 9 inputs, each scored 0–100. Each bar is that input's sub-score; the figure is the points it added to the 100-point composite (weight × sub-score).
- ARV discount +12.3/15.0
- Cash flow +9.5/30.0
- Livability +3.5/5.0
- DSCR +2.7/10.0
- Rent growth +2.5/5.0
- Condition / age +2.5/5.0
- 1% rule +2.0/10.0
- Schools +1.7/10.0
- Appreciation +0.0/10.0
$290,000
🖨 Deal sheet (PDF) 📄 Offer letter ✓ Due diligence
Listing remarks MLS
Just like New! Only 3 years old - 5 bedrooms (1 currently used as a home office, but would be great as a nursery) 3.5 bathrooms. Nice Kitchen with upgraded countertops and features any chef would love. * Private covered patio perfect for relaxing on summer nights
Key facts
- 3 parking spots
- Built 2022
- Listed 382 days
Tags
Neighborhood map
What this means for you Summary
Snapshot
- This is a 5-bed/3.5-bath land listed at $290k.
Deal economics
- At list price, monthly cash flow is $-630 ($-8k/yr) — negative.
- To cash-flow at today's rent, offer at most $179k (38.4% below list).
- To meet the 1% rule (rent ≥ 1% of price), the offer needs to be $202k (30.2% below list).
- Recommended offer: $179k (38.4% below list) — sets the bar for cash-flow.
Location & tenants
- Location reads 70/100 on livability (#61 in LA) — a middle-class / working-renter tenant base. Strengths: cost of living A+, housing A+, health & safety A+; Watch: crime F, amenities F, commute F.
- St. John The Baptist Parish (suburban): math 13% / reading 25% proficiency, ranked #68 of 98 in LA (top 69%) — low school quality limits family demand, transient renter base, plan for 1-2y turnover; 82% free/reduced lunch — lower-income household profile, screen leases tightly.
- Zoned schools: Lake Pontchartrain Elementary School (math 12% / reading 24%, grade F, #472 of 646 statewide, top 74%, 754 students, 28% FRL); East St. John Preparatory Academy (math 6% / reading 16%, grade F, #195 of 218 statewide, top 90%, 392 students, 63% FRL); East St. John High School (math 19% / reading 25%, grade F, #171 of 265 statewide, top 66%, 1,459 students, 48% FRL) — zoned schools average 46% FRL vs 82% district-wide (36 pts lower); this property's tenant base skews higher-income than the district average.
- Market conditions: 179 active listings in the ZIP; 61 units permitted in St. John the Baptist Parish in 2024 (0 in 5+ unit buildings).
- This rent runs 35% of the median local income ($68k/yr) — at the standard rent-burdened threshold; future hikes will face affordability resistance.
Forward outlook
- Local home prices are declining (-3.0%/yr); year-one equity from $2k of loan paydown is wiped out by about $9k of value loss. Plan a longer hold.
- St. John the Baptist County population projected at -20% by 2050 — secular population decline; favor cash flow + early exit over multi-decade hold.
Negotiation context
- It's been on market 383 days — a 12% lower offer ($255k) is reasonable based on typical stale-listing flexibility.
- 4 sale attempts since 13y ago; this cycle's ask has dropped $20k (6%) from the opening price — seller is motivated, your offer sets the floor, not the list.
- Current owner paid $35k; list at $290k implies a 729% gain — meaningful room to come down on a strong offer.
Risks & watch-outs
- Watch-outs: flood insurance adds $427/mo.
- Climate carrying-cost: in FEMA flood zone AE (mandatory federal flood insurance); severe wind risk, 99% chance of damaging wind over 30y; extreme-heat days projected 7→21/yr by 2055 (HVAC capex compounding) — expect insurance premiums to compound above CPI over the hold.
Questions for the listing agent
- What do current leases actually rent for vs. the listed asking? Can we see a recent rent roll and the last 12 months of T-12 income?
- It's been on market 383 days. Have you received any prior offers? Is the seller open to a 38% concession, seller financing, or rate buy-down credit?
- What's the actual annual flood-insurance premium (NFIP or private), and is the property in a SFHA with mandatory coverage?
- Why hasn't it sold? Are there any deal-killer items the seller is aware of (foundation, flood, title, zoning, code violations)?
- Is there a deadline driving the sale (1031 exchange, divorce, estate, relocation)? That informs how much negotiation room exists.
- Crime grade is F in this area — have there been break-ins, vandalism, or insurance claims at this property in the last 3 years? What carrier currently insures it and at what premium?
- The area grade is low — what's the realistic commute time and amenity access for the typical tenant pool here? Any planned neighborhood developments (good or bad) we should know about?
- What's the average days-on-market for RENTAL listings here right now (not sales)? A rising rental-DOM trend means longer vacancies and softer asking-rent achievability than the comps imply.
- What's the recent tenant-quality profile in this submarket — average credit score on applications, eviction rate, late-payment / NSF rate, and stable-employment percentage? A property-management company in the area should have these aggregated.
- How much new for-sale + rental construction is in the pipeline within 1–3 miles? Heavy new supply typically softens prices + rents 12–24 months out; constrained supply supports both.
Investment metrics
- 1% rule
- 0.70% ✗
- Cap rate
- 5.45%
- Cash-on-cash
- -3.00%
- DSCR
- 0.87
- GRM
- 11.9
CMA / ARV
- ARV (median comp)
- $325,000
- List price
- $290,000
- Delta
- -10.77%
- Verdict
- UNDERPRICED
- Comps
- 17 within 1.0 mi
Projected returns pro-forma
-3.0% appreciation · 3.0% rent growth · sell at horizon
- IRR
- -32.8%
- Equity multiple
- -0.07×
- Total profit
- $-86,931
- Equity at exit
- $43,240
- IRR
- -38.5%
- Equity multiple
- -0.56×
- Total profit
- $-126,657
- Equity at exit
- $25,074
Cash invested: $81,200 (down + closing). Projections, not guarantees.
Landlord ↔ Tenant lean methodology
- Overall (STATE)
- 90 Strongly Landlord-Friendly
- State Louisiana
- 90 Strongly Landlord-Friendly · R+12
- County
- — inherits STATE
- City
- — inherits STATE
ZIP-level market 70068
- Home prices YoY
- -20.1%
- Active inventory
- 179
- Price-to-rent
- 11.9×
Monthly cashflow live
- Estimated rent
- $2,025 medium interval (Pro) →
- Mortgage (P&I)
- −$1,521
- Tax from tax record
- −$161 /mo · $1,931/yr
- Insurance
- −$121
- Flood insurance flood zone
- −$427 /mo · $5,118/yr
- HOA
- −$0
- Vacancy / Maint / Mgmt
- −$425
- Net cashflow
- $-630
Break-even live
Sensitivity live
| Price | -10% $-466 | -5% $-548 | +0% $-630 | +5% $-712 | +10% $-794 |
|---|---|---|---|---|---|
| Rent | -10% $-790 | -5% $-710 | +0% $-630 | +5% $-550 | +10% $-470 |
| Rate | -1.0pp $-484 | -0.5pp $-556 | base $-630 | +0.5pp $-705 | +1.0pp $-781 |
UW: 25.0% down · 7.5% · 30yr · 1.5% tax · 5.0% vac · 8.0% maint · 8.0% mgmt
Financing live
Cash to close
- Down payment
- $72,500
- Closing costs
- $8,700
- Reserves months
- —
- Total cash needed
- —
Loan-product check · same deal, 3 products live
Conventional
25% down · 7.5% · 30yr
- Down + closing
- —
- Monthly P&I
- —
- Monthly cashflow
- —
- DSCR
- —
- Eligible?
- —
Personal DTI + credit; lowest rate.
DSCR
20% down · 8.5% · 30yr
- Down + closing
- —
- Monthly P&I
- —
- Monthly cashflow
- —
- DSCR
- —
- Eligible?
- —
No personal income docs; deal must DSCR.
Hard money
10% down · 12.0% · 12mo
- Down + closing
- —
- Monthly P&I
- —
- Monthly cashflow
- —
- DSCR
- —
- Eligible?
- —
Short-term bridge; refi at stabilization.
Listing history 25 events
-
2026-06-21days on market $290,000 Active 383 DOM
-
2026-06-19days on market $290,000 Active 381 DOM
-
2026-06-18days on market $290,000 Active 380 DOM
-
2026-06-17days on market $290,000 Active 379 DOM
-
2026-06-16days on market $290,000 Active 378 DOM
-
2026-06-15days on market $290,000 Active 377 DOM
-
2026-06-14days on market $290,000 Active 375 DOM
-
2026-06-13days on market $290,000 Active 374 DOM
-
2026-06-10days on market $290,000 Active 372 DOM
-
2026-06-09days on market $290,000 Active 371 DOM
-
2026-06-08days on market $290,000 Active 370 DOM
-
2026-06-07days on market $290,000 Active 369 DOM
-
2026-06-02days on market $290,000 Active 364 DOM
-
2026-06-01days on market $290,000 Active 363 DOM
-
2026-05-31days on market $290,000 Active 362 DOM
-
2026-05-30days on market $290,000 Active 361 DOM
-
2026-05-18price $290,000 263-char remark
Show marketing remark (265 chars)
Just like New! Only 3 years old - 5 bedrooms (1 currently used as a home office, but would be great as a nursery) 3.5 bathrooms. Nice Kitchen with upgraded countertops and features any chef would love. * Private covered patio perfect for relaxing on summer nights
-
2026-05-18price $290,000 265-char remark
Show marketing remark (265 chars)
Just like New! Only 3 years old - 5 bedrooms (1 currently used as a home office, but would be great as a nursery) 3.5 bathrooms. Nice Kitchen with upgraded countertops and features any chef would love. * Private covered patio perfect for relaxing on summer nights
-
2025-07-05price $299,000 263-char remark
Show marketing remark (265 chars)
Just like New! Only 3 years old - 5 bedrooms (1 currently used as a home office, but would be great as a nursery) 3.5 bathrooms. Nice Kitchen with upgraded countertops and features any chef would love. * Private covered patio perfect for relaxing on summer nights
-
2025-07-05price $299,000 265-char remark
Show marketing remark (265 chars)
Just like New! Only 3 years old - 5 bedrooms (1 currently used as a home office, but would be great as a nursery) 3.5 bathrooms. Nice Kitchen with upgraded countertops and features any chef would love. * Private covered patio perfect for relaxing on summer nights
-
2025-06-03$310,000 Active 263-char remark
Show marketing remark (265 chars)
Just like New! Only 3 years old - 5 bedrooms (1 currently used as a home office, but would be great as a nursery) 3.5 bathrooms. Nice Kitchen with upgraded countertops and features any chef would love. * Private covered patio perfect for relaxing on summer nights
-
2025-06-03$310,000 Active 265-char remark
Show marketing remark (265 chars)
Just like New! Only 3 years old - 5 bedrooms (1 currently used as a home office, but would be great as a nursery) 3.5 bathrooms. Nice Kitchen with upgraded countertops and features any chef would love. * Private covered patio perfect for relaxing on summer nights
-
2014-06-20soldstatus $35,000
-
2013-01-24$39,000
-
2013-01-24$39,000
ⓘ Source: listings_history table (triggers on properties + properties_extension) + one-shot
backfill from property_details.listing_events for pre-trigger history.
Tax reassessment forecast LA · Resets to sale price
- Current annual tax
- $1,931 · $161/mo
- Projected year-2 tax
- $1,931 · $161/mo
- Expected delta
- $0/yr ($0/mo · 0.0%)
ⓘ Screening estimate from a state-policy table — verify with the county assessor before closing.
Climate risk First Street
- Flood 9/10 Extreme FEMA zone AE · 99% chance over 30 yrs
- Wildfire 1/10 Low
- Heat 9/10 Extreme 7 d/yr ≥108°F today · 21 d/yr by 30 yrs out
- Wind 9/10 Extreme 99% chance of damaging wind over 30 yrs
- Air quality 3/10 Moderate 2 unhealthy d/yr today · 3 by 30 yrs out
Nearby sold comps map
Loading sold comps map…
Walkable amenities ~0.75 mi
Loading nearby amenities…
Taxation est. · year 1
- Rental income
- $24,294
- − Mortgage interest
- −$16,245
- − Property taxes
- −$1,931
- − Insurance
- −$6,568
- − Repairs & maintenance
- −$1,944
- − Management
- −$1,944
- − Depreciation
- −$8,436
- Taxable loss
- −$12,773
- Est. tax savings @ 24.0%
- +$3,066
- After-tax cash flow
- $-4,491/yr
For passive investors: Depreciation is non-cash, so a rental often shows a tax loss while cash-flowing — sheltering income. Rental losses are passive: they offset passive income freely, and up to $25,000/yr can offset ordinary (W-2) income if you actively participate and your MAGI is under $100k (phasing out to $0 by $150k); unused losses carry forward. On sale, claimed depreciation is recaptured at up to 25%, and gains may owe capital-gains tax (a 1031 exchange can defer both). Figures are a year-1 estimate at your 24.0% rate — not tax advice; consult a CPA.
Schools (NCES district)
- District
- St. John The Baptist Parish
- NCES district ID
- 2201530
- Math proficiency
- 13% ▼ -42.00%
- Reading proficiency
- 25% ▼ -39.00%
- Median HH income
- $50,280
- Composite
- 17.07/100
- National rank
- #9120
- State rank
- #68 of 98 in LA
Livability — Laplace
- Score
- 70/100
- State rank
- #61
- US rank
- #7898
Category grades
Schools grade is shown separately in the Schools card above.
Census & demographics
- Census place
- Laplace, LA
- County
- Saint John the Baptist Parish · 32,720 people
- Metro
- New Orleans-Metairie, LA
- Population (ZIP)
- 32,720
- Household income
- $68,459
- Rent vs Own
- Severe rent burden
- 750.0
Population outlook (St. John the Baptist County) Hauer SSP2
- Today (2025)
- 40,972 people
- By 2030
- 39,295 · -4.1%
- By 2040
- 35,902 · -12.4%
- By 2050
- 32,988 · -19.5%
- By 2075
- 28,661 · -30.0%
- By 2100
- 26,456 · -35.4%
Race, ethnicity, and origin ACS 2023
- Neighborhood character
- Diverse neighborhood (Simpson 0.62)
- Race & ethnicity
- Black 51% White 34% Hispanic / Latino 9% Two or more races 5% Asian 1%
- Hispanic origin (detail)
- Puerto Rican 1%
- Common ancestry
- Lithuanian 11%
- Foreign-born
- 5% · Canada
- Languages at home
- 91% English-only · Spanish 6% Tagalog/Filipino 1%
Political lean MEDSL · St. John the Baptist
- 2024 margin
- Strong D (+29.1) · D 64.0% · R 34.8% · Other 1.2%
- 2008→2024 swing
- +12.9pp toward D · 2008: 16.2pp · 2024: 29.1pp
- All cycles
- 2024: D+29.1 2020: D+28.2 2016: D+24.5 2012: D+26.3 2008: D+16.2
Not yet ingested
- Civics
- —
Market trends
- HPI YoY
- ▼ -60.04%
- Current HPI
- 239.1429
- Rent YoY
- —
- Metro
- New Orleans-Metairie, LA
- State GDP YoY
- ▲ 3.29%
- F500 in state
- 10
Industry mix (Fortune 500 HQ in LA)
| Industry | F500 HQs | Revenue |
|---|---|---|
| Telecommunications | 2 | $23B |
|
||
| Utilities | 1 | $12B |
|
||
| Wholesale / Distribution | 1 | $5B |
|
||
| Advertising | 1 | $2B |
|
||
Price history
+643.6% since first listed9 events — show timeline
- 2026-05-18 Price Changed $290,000 AcadianaMLS
- 2026-05-18 Price Changed $290,000 GSREIN
- 2025-07-05 Price Changed $299,000 AcadianaMLS
- 2025-07-05 Price Changed $299,000 GSREIN
- 2025-06-03 Listed $310,000 GSREIN
- 2025-06-03 Listed $310,000 AcadianaMLS
- 2014-06-20 Sold (MLS) $35,000 GSREIN
- 2013-01-24 Listed $39,000 AcadianaMLS
- 2013-01-24 Listed $39,000 GSREIN
Property tax history
+15.4%/yrLatest (2025): $1,931 · +0.1% YoY. Source: county tax records.
Cash-flow waterfall
monthlySold comps — $/sqft
last 12 mo · ≤1 miLoading sold comps…