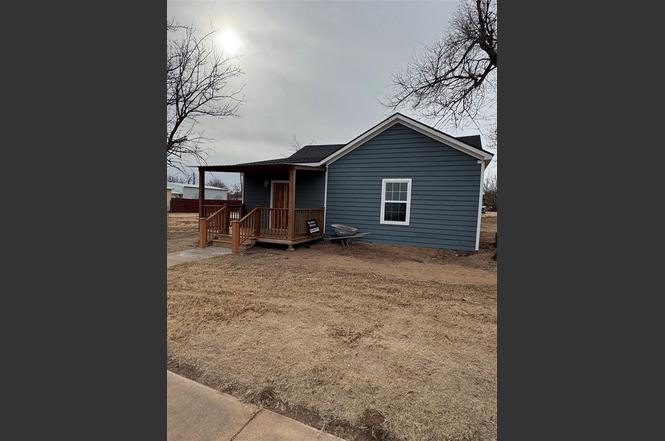
1107 W 3rd St · Quanah, TX
Flood risk 1/10 · Minimal
- FEMA flood zone
- —
- Chance of flooding over 30 yrs
- 0.0%
- Est. flood insurance / yr
- —
Fire risk 5/10 · Moderate
- Est. fire insurance / yr
- $1,222 – $2,270
Heat risk 7/10 · Major
- Hot days now (above 107°F)
- 7 days/yr
- Hot days in 30 yrs
- 19 days/yr
Wind risk 3/10 · Minor
- Chance of severe wind over 30 yrs
- 6.0%
Air-quality risk 1/10 · Minimal
- Unhealthy air days now
- 0 days/yr
- Unhealthy air days in 30 yrs
- 0 days/yr
Risk factors via First Street. Map © Google.
Why this score? — see what drove the D+ grade
The composite is a weighted blend of 9 inputs, each scored 0–100. Each bar is that input's sub-score; the figure is the points it added to the 100-point composite (weight × sub-score).
- Cash flow +19.9/30.0
- DSCR +6.3/10.0
- 1% rule +5.3/10.0
- Appreciation +5.0/10.0
- Livability +3.8/5.0
- Schools +3.4/10.0
- Rent growth +2.5/5.0
- Condition / age +2.5/5.0
- ARV discount +0.0/15.0
$100,000
🖨 Deal sheet (PDF) 📄 Offer letter ✓ Due diligence
Listing remarks
This home has been taken down to the studs and completely rebuilt-essentially a brand-new home that you can be the first to live in! The only original feature is the wood flooring, which was carefully removed, refurbished, and restored to its original beauty. Everything else is new: central heat and ac, walls, texture, paint, ceilings with recessed lighting, new windows, entry way bench, and a stunning custom made front door. This home offers 3 bedrooms, 1 full bath, and a master bath featuring a huge tiled walk-in shower. The kitchen includes a gorgeous butcher block island-bar and all new cabinets, drawers, electric stove top and dishwasher. The exterior has a new roof, foundation and c
Key facts
- Wood flooring
- Entry way bench
- Central heat and ac
Tags
Neighborhood map
What this means for you Summary
Snapshot
- This is a 3-bed/2.0-bath single-family listed at $100k.
Deal economics
- At list price, monthly cash flow is $120 ($1k/yr) — positive.
- The deal already cash-flows at list — no discount required.
- Meets the 1% rule at list price ($1k rent vs $100k).
- Recommended offer: $97k (3.0% below list) — sets the bar for market timing.
Location & tenants
- Location reads 76/100 on livability (#116 in TX, #3,745 nationally) — a middle-class / working-renter tenant base. Strengths: cost of living A+, housing A+, health & safety A+; Watch: amenities F, commute F, employment F.
- Quanah ISD (rural): math 44% / reading 37% proficiency, ranked #432 of 826 in TX (top 52%) — families likely to look elsewhere, expect single-tenant / working-renter base with shorter leases.
- Zoned schools: Reagan El (math 37% / reading 37%, grade F, #1,769 of 4,322 statewide, top 44%, 201 students, 74% FRL); Travis Middle (math 42% / reading 32%, grade F, #756 of 1,662 statewide, top 47%, 103 students, 80% FRL); Quanah H S (math 64% / reading 54%, grade C+, #275 of 1,632 statewide, top 19%, 158 students, 68% FRL) — zoned schools average 74% FRL vs 59% district-wide (15 pts higher); higher-poverty schools than district average — tighter screening recommended.
- Market conditions: 26 active listings in the ZIP.
Forward outlook
- In year one you build about $4k of equity ($691 loan paydown + $3k appreciation (3.0% local appreciation)).
- Hardeman County population projected at -21% by 2050 — secular population decline; favor cash flow + early exit over multi-decade hold.
- At projected returns (3.0% appreciation + 3.0% rent growth), your $28k cash investment doubles in ~5 years — after that, you're playing with house money.
- By year 9, paydown + projected appreciation supports a ~$31k cash-out refi (75% LTV) — recoverable capital for the next deal without selling this one.
Negotiation context
- It's been on market 38 days — a 3% lower offer ($97k) is reasonable based on typical stale-listing flexibility.
Risks & watch-outs
- Watch-outs: built in 1940 — expect roof / HVAC / electrical / plumbing capex.
- Climate carrying-cost: moderate wildfire risk; extreme-heat days projected 7→19/yr by 2055 (HVAC capex compounding) — expect insurance premiums to compound above CPI over the hold.
Questions for the listing agent
- It's been on market 38 days. Have you received any prior offers? Is the seller open to a 3% concession, seller financing, or rate buy-down credit?
- Built in 1940 — when were the roof, HVAC, electrical panel, plumbing, and water heater last replaced?
- Is there a deadline driving the sale (1031 exchange, divorce, estate, relocation)? That informs how much negotiation room exists.
- Schools are D-rated, which usually means shorter tenancies and higher turnover. Who's the typical renter profile here, and what's been the actual vacancy rate?
- The area grade is low — what's the realistic commute time and amenity access for the typical tenant pool here? Any planned neighborhood developments (good or bad) we should know about?
- What's the average days-on-market for RENTAL listings here right now (not sales)? A rising rental-DOM trend means longer vacancies and softer asking-rent achievability than the comps imply.
- What's the recent tenant-quality profile in this submarket — average credit score on applications, eviction rate, late-payment / NSF rate, and stable-employment percentage? A property-management company in the area should have these aggregated.
- How much new for-sale + rental construction is in the pipeline within 1–3 miles? Heavy new supply typically softens prices + rents 12–24 months out; constrained supply supports both.
Investment metrics
- 1% rule
- 1.03% ✓
- Cap rate
- 7.74%
- Cash-on-cash
- 5.15%
- DSCR
- 1.23
- GRM
- 8.1
CMA / ARV
- ARV (on-the-fly)
- $81,176
- Comps found
- 2
Show comp detail 2 sales within ~0.75 mi
| Address | Dist | Beds/Ba | Sqft | Sold | Price | $/sf | Match |
|---|---|---|---|---|---|---|---|
| 510 Cain St | 0.37mi | 2/1.0 (-1) | 1,226 (+10%) | 3mo | $90,000 | $73 | 54 |
| 707 W 4th St | 0.30mi | 2/1.0 (-1) | 1,220 (+10%) | 20mo | $40,000 | $33 | 45 |
Match score weights: distance 35% · size 25% · config 20% · recency 20%. Top-matched comps best support the ARV.
Projected returns pro-forma
3.0% appreciation · 3.0% rent growth · sell at horizon
- IRR
- 12.3%
- Equity multiple
- 1.70×
- Total profit
- $19,722
- Equity at exit
- $44,964
- IRR
- 14.4%
- Equity multiple
- 3.13×
- Total profit
- $59,510
- Equity at exit
- $69,295
Cash invested: $28,000 (down + closing). Projections, not guarantees.
Landlord ↔ Tenant lean methodology
- Overall (STATE)
- 87 Strongly Landlord-Friendly
- State Texas
- 87 Strongly Landlord-Friendly · R+5
- County
- — inherits STATE
- City
- — inherits STATE
ZIP-level market 79252
- Active inventory
- 26
- Price-to-rent
- 8.1×
Monthly cashflow live
- Estimated rent
- $1,027 medium interval (Pro) →
- Mortgage (P&I)
- −$524
- Tax est. 1.5%
- −$125 /mo · $1,500/yr
- Insurance
- −$42
- HOA
- −$0
- Vacancy / Maint / Mgmt
- −$216
- Net cashflow
- $120
Break-even live
Sensitivity live
| Price | -10% $189 | -5% $155 | +0% $120 | +5% $86 | +10% $51 |
|---|---|---|---|---|---|
| Rent | -10% $39 | -5% $80 | +0% $120 | +5% $161 | +10% $201 |
| Rate | -1.0pp $171 | -0.5pp $146 | base $120 | +0.5pp $94 | +1.0pp $68 |
UW: 25.0% down · 7.5% · 30yr · 1.5% tax · 5.0% vac · 8.0% maint · 8.0% mgmt
Financing live
Cash to close
- Down payment
- $25,000
- Closing costs
- $3,000
- Reserves months
- —
- Total cash needed
- —
Loan-product check · same deal, 3 products live
Conventional
25% down · 7.5% · 30yr
- Down + closing
- —
- Monthly P&I
- —
- Monthly cashflow
- —
- DSCR
- —
- Eligible?
- —
Personal DTI + credit; lowest rate.
DSCR
20% down · 8.5% · 30yr
- Down + closing
- —
- Monthly P&I
- —
- Monthly cashflow
- —
- DSCR
- —
- Eligible?
- —
No personal income docs; deal must DSCR.
Hard money
10% down · 12.0% · 12mo
- Down + closing
- —
- Monthly P&I
- —
- Monthly cashflow
- —
- DSCR
- —
- Eligible?
- —
Short-term bridge; refi at stabilization.
Listing history 2 events
-
2026-02-27status Pending
-
2026-01-16$100,000 Active
ⓘ Source: listings_history table (triggers on properties + properties_extension) + one-shot
backfill from property_details.listing_events for pre-trigger history.
Climate risk First Street
- Flood 1/10 Low 0% chance over 30 yrs
- Wildfire 5/10 Major
- Heat 7/10 Severe 7 d/yr ≥107°F today · 19 d/yr by 30 yrs out
- Wind 3/10 Moderate 6% chance of damaging wind over 30 yrs
- Air quality 1/10 Low 0 unhealthy d/yr today · 0 by 30 yrs out
Nearby sold comps map
Loading sold comps map…
Walkable amenities ~0.75 mi
Loading nearby amenities…
Taxation est. · year 1
- Rental income
- $12,324
- − Mortgage interest
- −$5,602
- − Property taxes
- −$1,500
- − Insurance
- −$500
- − Repairs & maintenance
- −$986
- − Management
- −$986
- − Depreciation
- −$2,909
- Taxable loss
- −$158
- Est. tax savings @ 24.0%
- +$38
- After-tax cash flow
- $1,481/yr
For passive investors: Depreciation is non-cash, so a rental often shows a tax loss while cash-flowing — sheltering income. Rental losses are passive: they offset passive income freely, and up to $25,000/yr can offset ordinary (W-2) income if you actively participate and your MAGI is under $100k (phasing out to $0 by $150k); unused losses carry forward. On sale, claimed depreciation is recaptured at up to 25%, and gains may owe capital-gains tax (a 1031 exchange can defer both). Figures are a year-1 estimate at your 24.0% rate — not tax advice; consult a CPA.
Schools (NCES district)
- District
- Quanah ISD
- NCES district ID
- 4836180
- Math proficiency
- 44% ▲ 4.00%
- Reading proficiency
- 37% ▼ -5.00%
- Median HH income
- $36,117
- Composite
- 33.62/100
- National rank
- #5406
- State rank
- #432 of 826 in TX
Livability — Quanah
- Score
- 76/100
- State rank
- #116
- US rank
- #3745
Category grades
Schools grade is shown separately in the Schools card above.
Census & demographics
- Census place
- Quanah, TX
- Population (ZIP)
- 2,642
Population outlook (Hardeman County) Hauer SSP2
- Today (2025)
- 3,541 people
- By 2030
- 3,375 · -4.7%
- By 2040
- 3,066 · -13.4%
- By 2050
- 2,784 · -21.4%
- By 2075
- 2,057 · -41.9%
- By 2100
- 1,406 · -60.3%
Race, ethnicity, and origin ACS 2023
- Neighborhood character
- Predominantly White (66%)
- Race & ethnicity
- White 66% Hispanic / Latino 28% Two or more races 15% Asian 2%
- Hispanic origin (detail)
- Mexican 21% Puerto Rican 2% Cuban 2%
- Common ancestry
- American 1% Lithuanian 1% Italian 1%
- Foreign-born
- 5% · Canada, Vietnam
- Languages at home
- 87% English-only · Spanish 8% Other Indo-European 1% Chinese 1%
Political lean MEDSL · Hardeman
- 2024 margin
- Solid R (+72.7) · D 13.4% · R 86.1%
- 2008→2024 swing
- -21.0pp toward R · 2008: -51.8pp · 2024: -72.7pp
- All cycles
- 2024: R+72.7 2020: R+68.9 2016: R+63.4 2012: R+58.5 2008: R+51.8
Not yet ingested
- Civics
- —
Market trends
- HPI YoY
- —
- Current HPI
- —
- Rent YoY
- —
- Metro
- —
- State GDP YoY
- ▲ 3.95%
- F500 in state
- 110
Industry mix (Fortune 500 HQ in TX)
| Industry | F500 HQs | Revenue |
|---|---|---|
| Energy | 16 | $1,198B |
|
||
| Technology | 5 | $198B |
|
||
| Engineering / Construction | 4 | $72B |
|
||
| Energy Services | 3 | $60B |
|
||
| Utilities | 3 | $41B |
|
||
| Healthcare | 2 | $330B |
|
||
Price history
2 events — show timeline
- 2026-02-27 Pending — NTREIS
- 2026-01-16 Listed $100,000 NTREIS
Property tax history
-2.9%/yrLatest (2025): $164 · +2.9% YoY. Source: county tax records.
Cash-flow waterfall
monthlySold comps — $/sqft
last 12 mo · ≤1 miLoading sold comps…