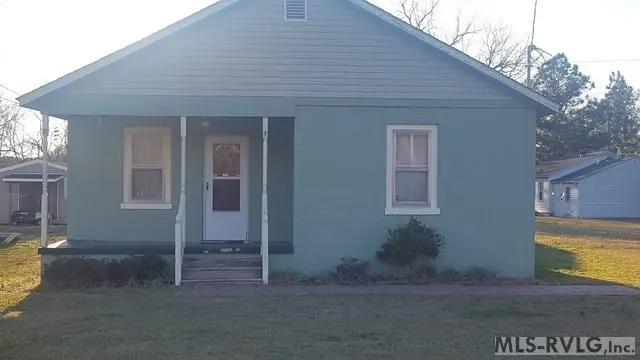
289 Davie-smith St · South Rosemary, NC
Flood risk 1/10 · Minimal
- FEMA flood zone
- X (unshaded)
- Chance of flooding over 30 yrs
- 0.0%
- Est. flood insurance / yr
- $473 – $860
Fire risk 4/10 · Minor
- Est. fire insurance / yr
- $906 – $1,684
Heat risk 7/10 · Major
- Hot days now (above 108°F)
- 7 days/yr
- Hot days in 30 yrs
- 16 days/yr
Wind risk 6/10 · Moderate
- Chance of severe wind over 30 yrs
- 67.0%
Air-quality risk 1/10 · Minimal
- Unhealthy air days now
- 0 days/yr
- Unhealthy air days in 30 yrs
- 0 days/yr
Risk factors via First Street. Map © Google.
Why this score? — see what drove the C+ grade
The composite is a weighted blend of 9 inputs, each scored 0–100. Each bar is that input's sub-score; the figure is the points it added to the 100-point composite (weight × sub-score).
- Cash flow +30.0/30.0
- DSCR +10.0/10.0
- 1% rule +8.1/10.0
- ARV discount +7.5/15.0
- Livability +3.0/5.0
- Rent growth +2.5/5.0
- Condition / age +2.5/5.0
- Schools +1.2/10.0
- Appreciation +0.0/10.0
$75,000
🖨 Deal sheet (PDF) 📄 Offer letter ✓ Due diligence
Listing remarks MLS
Looking for RENTAL PROPERTY? or an AFFORDABLE STARTER HOME in a quiet established neighborhood. Minutes away from shopping, hospital, and Interstate 95. Needs a little TLC - sold as is.
Key facts
- Close to hospital
- Close to restaurants
- Close to i-95
Tags
Property features AI
Finance
- Other: Lot approximately 0.42 acres (18,295.2 sq ft); Zoned residential; Subdivision: .NON-Subdivision
Exterior
- Parking: No garage
- Utilities: Public water; Septic tank sewer
- Home design: Residential property (Residential/Vacation subtype); One level
- Construction: Block construction; Block foundation; Built with composition roofing
- Exterior features: Front porch; Rear porch; Composition roof; Has a view; Road surface: Other
Interior
- Kitchen: No appliances listed
- Bedrooms: Total of 4 rooms (bedroom count not specified)
- Flooring: Wood flooring; Vinyl flooring
- Bathrooms: 1 full bathroom
- Heating & cooling: Forced air heating (natural gas); Window cooling units
- Interior features: Wood and vinyl flooring; No fireplace; No appliances included
- Laundry & utility: No laundry appliances listed
Neighborhood map
What this means for you Summary
Snapshot
- This is a 2-bed/1.0-bath single-family listed at $75k.
Deal economics
- At list price, monthly cash flow is $302 ($4k/yr) — positive.
- The deal already cash-flows at list — no discount required.
- Meets the 1% rule at list price ($986 rent vs $75k).
- Recommended offer: $70k (6.0% below list) — sets the bar for market timing.
Location & tenants
- Location reads 59/100 on livability (#546 in NC) — a working-class tenant base; expect higher turnover. Strengths: cost of living A+, housing A+, crime A-; Watch: amenities F, commute F, employment F.
- Halifax County Schools (rural): math 6% / reading 24% proficiency, ranked #177 of 178 in NC (top 99%) — low school quality limits family demand, transient renter base, plan for 1-2y turnover; 82% free/reduced lunch — lower-income household profile, screen leases tightly.
- Zoned schools: Halifax County Early College High (math 75% / reading 70%, grade B+, #106 of 535 statewide, top 20%, 128 students, 98% FRL) — zoned schools average 98% FRL vs 82% district-wide (16 pts higher); higher-poverty schools than district average — tighter screening recommended.
- Zoned-school proficiency averages 72% at this address vs 15% district-wide (+57 pts) — the actual schools serving this property are materially stronger than the Halifax County Schools average implies; a family-tenant draw the district grade alone would hide.
- Market conditions: 147 active listings in the ZIP; 55 units permitted in Halifax County in 2024 (0 in 5+ unit buildings).
Forward outlook
- Local home prices are declining (-3.0%/yr); year-one equity from $519 of loan paydown is wiped out by about $2k of value loss. Plan a longer hold.
- Halifax County population projected at -27% by 2050 — secular population decline; favor cash flow + early exit over multi-decade hold.
- At projected returns (-3.0% appreciation + 3.0% rent growth), your $21k cash investment doubles in ~7 years — after that, you're playing with house money.
Negotiation context
- It's been on market 71 days — a 6% lower offer ($70k) is reasonable based on typical stale-listing flexibility.
- 2 sale attempts since 9y ago with the ask held roughly flat each time — persistent listings suggest the price (not the market) is what's stuck; bring a comps-based counter.
- Current owner paid $25k; list at $75k implies a 200% gain — meaningful room to come down on a strong offer.
Risks & watch-outs
- Watch-outs: built in 1950 — expect roof / HVAC / electrical / plumbing capex.
- Climate carrying-cost: major wind risk, 67% chance of damaging wind over 30y; extreme-heat days projected 7→16/yr by 2055 (HVAC capex compounding) — expect insurance premiums to compound above CPI over the hold.
Questions for the listing agent
- It's been on market 71 days. Have you received any prior offers? Is the seller open to a 6% concession, seller financing, or rate buy-down credit?
- Built in 1950 — when were the roof, HVAC, electrical panel, plumbing, and water heater last replaced?
- Why hasn't it sold? Are there any deal-killer items the seller is aware of (foundation, flood, title, zoning, code violations)?
- Is there a deadline driving the sale (1031 exchange, divorce, estate, relocation)? That informs how much negotiation room exists.
- Schools are F-rated, which usually means shorter tenancies and higher turnover. Who's the typical renter profile here, and what's been the actual vacancy rate?
- What's the average days-on-market for RENTAL listings here right now (not sales)? A rising rental-DOM trend means longer vacancies and softer asking-rent achievability than the comps imply.
- What's the recent tenant-quality profile in this submarket — average credit score on applications, eviction rate, late-payment / NSF rate, and stable-employment percentage? A property-management company in the area should have these aggregated.
- How much new for-sale + rental construction is in the pipeline within 1–3 miles? Heavy new supply typically softens prices + rents 12–24 months out; constrained supply supports both.
Investment metrics
- 1% rule
- 1.31% ✓
- Cap rate
- 11.13%
- Cash-on-cash
- 17.27%
- DSCR
- 1.77
- GRM
- 6.3
CMA / ARV
No comps found within radius.
Projected returns pro-forma
-3.0% appreciation · 3.0% rent growth · sell at horizon
- IRR
- 8.6%
- Equity multiple
- 1.34×
- Total profit
- $7,086
- Equity at exit
- $11,183
- IRR
- 17.8%
- Equity multiple
- 2.47×
- Total profit
- $30,915
- Equity at exit
- $6,485
Cash invested: $21,000 (down + closing). Projections, not guarantees.
Landlord ↔ Tenant lean methodology
- Overall (STATE)
- 85 Strongly Landlord-Friendly
- State North Carolina
- 85 Strongly Landlord-Friendly · R+3
- County
- — inherits STATE
- City
- — inherits STATE
ZIP-level market 27870
- Home prices YoY
- -21.1%
- Active inventory
- 147
- Price-to-rent
- 6.3×
Monthly cashflow live
- Estimated rent
- $986 medium interval (Pro) →
- Mortgage (P&I)
- −$393
- Tax from tax record
- −$52 /mo · $625/yr
- Insurance
- −$31
- HOA
- −$0
- Vacancy / Maint / Mgmt
- −$207
- Net cashflow
- $302
Break-even live
Sensitivity live
| Price | -10% $345 | -5% $323 | +0% $302 | +5% $281 | +10% $260 |
|---|---|---|---|---|---|
| Rent | -10% $224 | -5% $263 | +0% $302 | +5% $341 | +10% $380 |
| Rate | -1.0pp $340 | -0.5pp $321 | base $302 | +0.5pp $283 | +1.0pp $263 |
UW: 25.0% down · 7.5% · 30yr · 1.5% tax · 5.0% vac · 8.0% maint · 8.0% mgmt
Financing live
Cash to close
- Down payment
- $18,750
- Closing costs
- $2,250
- Reserves months
- —
- Total cash needed
- —
Loan-product check · same deal, 3 products live
Conventional
25% down · 7.5% · 30yr
- Down + closing
- —
- Monthly P&I
- —
- Monthly cashflow
- —
- DSCR
- —
- Eligible?
- —
Personal DTI + credit; lowest rate.
DSCR
20% down · 8.5% · 30yr
- Down + closing
- —
- Monthly P&I
- —
- Monthly cashflow
- —
- DSCR
- —
- Eligible?
- —
No personal income docs; deal must DSCR.
Hard money
10% down · 12.0% · 12mo
- Down + closing
- —
- Monthly P&I
- —
- Monthly cashflow
- —
- DSCR
- —
- Eligible?
- —
Short-term bridge; refi at stabilization.
Listing history 8 events
-
2026-06-07statusdays on market $75,000 Pending 71 DOM
-
2026-06-02days on market $75,000 Active 70 DOM
-
2026-06-01days on market $75,000 Active 69 DOM
-
2026-05-31days on market $75,000 Active 68 DOM
-
2026-05-30days on market $75,000 Active 67 DOM
-
2026-03-24$75,000 Active
-
2017-10-06soldstatus $25,000 187-char remark
Show marketing remark (187 chars)
Looking for RENTAL PROPERTY? or an AFFORDABLE STARTER HOME in a quiet established neighborhood. Minutes away from shopping, hospital, and Interstate 95. Needs a little TLC - sold as is.
-
2017-03-16$30,000 187-char remark
Show marketing remark (187 chars)
Looking for RENTAL PROPERTY? or an AFFORDABLE STARTER HOME in a quiet established neighborhood. Minutes away from shopping, hospital, and Interstate 95. Needs a little TLC - sold as is.
ⓘ Source: listings_history table (triggers on properties + properties_extension) + one-shot
backfill from property_details.listing_events for pre-trigger history.
Tax reassessment forecast NC · Resets to sale price
- Current annual tax
- $625 · $52/mo
- Projected year-2 tax
- $625 · $52/mo
- Expected delta
- $0/yr ($0/mo · 0.0%)
ⓘ Screening estimate from a state-policy table — verify with the county assessor before closing.
Climate risk First Street
- Flood 1/10 Low FEMA zone X (unshaded) · 0% chance over 30 yrs
- Wildfire 4/10 Moderate
- Heat 7/10 Severe 7 d/yr ≥108°F today · 16 d/yr by 30 yrs out
- Wind 6/10 Major 67% chance of damaging wind over 30 yrs
- Air quality 1/10 Low 0 unhealthy d/yr today · 0 by 30 yrs out
Nearby sold comps map
Loading sold comps map…
Walkable amenities ~0.75 mi
Loading nearby amenities…
Taxation est. · year 1
- Rental income
- $11,832
- − Mortgage interest
- −$4,201
- − Property taxes
- −$625
- − Insurance
- −$375
- − Repairs & maintenance
- −$947
- − Management
- −$947
- − Depreciation
- −$2,182
- Taxable income
- $2,555
- Est. tax owed @ 24.0%
- −$613
- After-tax cash flow
- $3,014/yr
For passive investors: Depreciation is non-cash, so a rental often shows a tax loss while cash-flowing — sheltering income. Rental losses are passive: they offset passive income freely, and up to $25,000/yr can offset ordinary (W-2) income if you actively participate and your MAGI is under $100k (phasing out to $0 by $150k); unused losses carry forward. On sale, claimed depreciation is recaptured at up to 25%, and gains may owe capital-gains tax (a 1031 exchange can defer both). Figures are a year-1 estimate at your 24.0% rate — not tax advice; consult a CPA.
Schools (NCES district)
- District
- Halifax County Schools
- NCES district ID
- 3701950
- Math proficiency
- 6% ▼ -11.00%
- Reading proficiency
- 24% ▼ -1.00%
- Median HH income
- $29,104
- Composite
- 11.7/100
- National rank
- #9690
- State rank
- #177 of 178 in NC
Livability — South Rosemary
- Score
- 59/100
- State rank
- #546
- US rank
- #19997
Category grades
Schools grade is shown separately in the Schools card above.
Census & demographics
- Census place
- South Rosemary, NC
- County
- Halifax County · 24,958 people
- Metro
- Roanoke Rapids, NC
- Population (ZIP)
- 24,958
- Household income
- $49,502
- Rent vs Own
- Severe rent burden
- 822.0
Population outlook (Halifax County) Hauer SSP2
- Today (2025)
- 47,976 people
- By 2030
- 45,450 · -5.3%
- By 2040
- 39,980 · -16.7%
- By 2050
- 34,863 · -27.3%
- By 2075
- 25,577 · -46.7%
- By 2100
- 18,365 · -61.7%
Race, ethnicity, and origin ACS 2023
- Neighborhood character
- Diverse neighborhood (Simpson 0.61)
- Race & ethnicity
- White 47% Black 40% Two or more races 7% Hispanic / Latino 5% Asian 1%
- Common ancestry
- Slovak 1% Italian 1% Serbian 1%
- Foreign-born
- 3% · Canada, Vietnam
- Languages at home
- 94% English-only · Spanish 4% Other Asian/Pacific 1%
Political lean MEDSL · Halifax
- 2024 margin
- D (+17.7) · D 58.5% · R 40.9%
- 2008→2024 swing
- -10.6pp toward R · 2008: 28.2pp · 2024: 17.7pp
- All cycles
- 2024: D+17.7 2020: D+21.2 2016: D+26.9 2012: D+32.0 2008: D+28.2
Not yet ingested
- Civics
- —
Market trends
- HPI YoY
- ▼ -47.78%
- Current HPI
- 179.1705
- Rent YoY
- —
- Metro
- Roanoke Rapids, NC
- State GDP YoY
- ▲ 3.28%
- F500 in state
- 26
Industry mix (Fortune 500 HQ in NC)
| Industry | F500 HQs | Revenue |
|---|---|---|
| Financial Services | 2 | $213B |
|
||
| Retail | 2 | $95B |
|
||
| Industrial Conglomerate | 1 | $38B |
|
||
| Metals / Steel | 1 | $35B |
|
||
| Utilities | 1 | $30B |
|
||
| Industrial Machinery | 1 | $19B |
|
||
Price history
+150.0% since first listed3 events — show timeline
- 2026-03-24 Listed $75,000 RVLG
- 2017-10-06 Sold (MLS) $25,000 RVLG
- 2017-03-16 Listed $30,000 RVLG
Property tax history
+3.0%/yrLatest (2025): $625 · +1.8% YoY. Source: county tax records.
Cash-flow waterfall
monthlySold comps — $/sqft
last 12 mo · ≤1 miLoading sold comps…