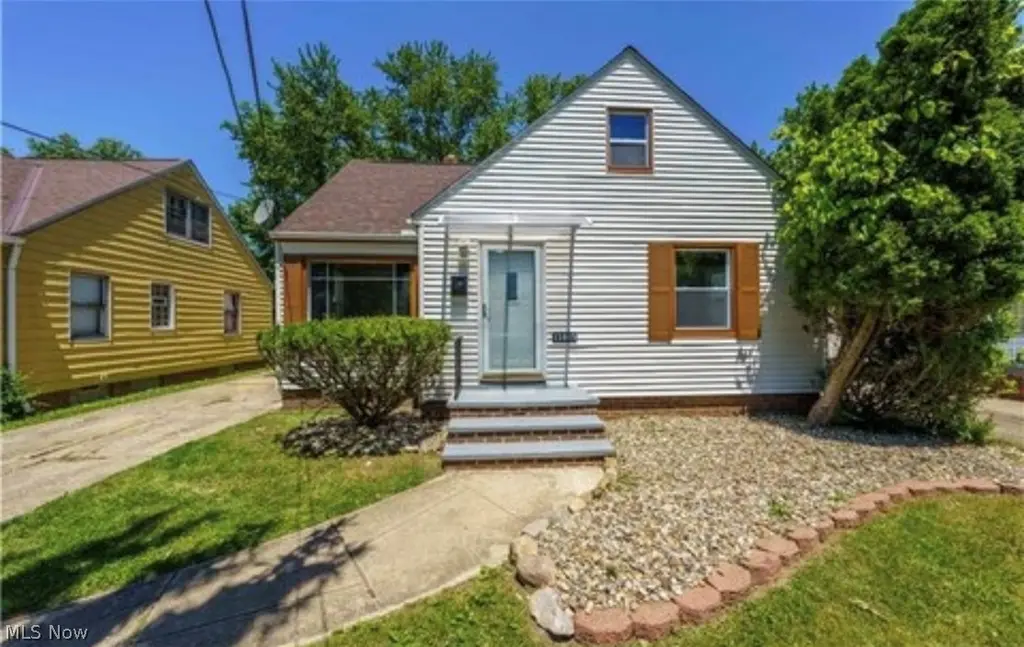
13815 Cranwood Park Blvd · Garfield Heights, OH
Flood risk 1/10 · Minimal
- FEMA flood zone
- X (unshaded)
- Chance of flooding over 30 yrs
- 0.0%
- Est. flood insurance / yr
- $507 – $1,088
Fire risk 1/10 · Minimal
- Est. fire insurance / yr
- $713 – $1,323
Heat risk 2/10 · Minimal
- Hot days now (above 95°F)
- 6 days/yr
- Hot days in 30 yrs
- 15 days/yr
Wind risk 1/10 · Minimal
- Chance of severe wind over 30 yrs
- —
Air-quality risk 3/10 · Minor
- Unhealthy air days now
- 2 days/yr
- Unhealthy air days in 30 yrs
- 3 days/yr
Risk factors via First Street. Map © Google.
Why this score? — see what drove the D grade
The composite is a weighted blend of 9 inputs, each scored 0–100. Each bar is that input's sub-score; the figure is the points it added to the 100-point composite (weight × sub-score).
- Cash flow +17.2/30.0
- 1% rule +6.8/10.0
- DSCR +5.4/10.0
- Rent growth +3.7/5.0
- Livability +3.4/5.0
- Condition / age +2.5/5.0
- Schools +1.3/10.0
- ARV discount +0.0/15.0
- Appreciation +0.0/10.0
$105,000
🖨 Deal sheet 📄 Offer letter ✓ Due diligence
Listing remarks
This 3-bedroom, 1-bath property is packed with potential and ready for your next project. Features include central air and a 2-car garage. Being sold as-is, this home is ideal for rehab and hold or flip. Some updates have already been completed, so this will not be a full renovation. Once improvements/repairs are completed, this property has strong income-producing potential. Add this one to your portfolio today! Short sale; Being sold as-is. Photos reflect the property prior to the seller’s ownership and may not represent current condition. Buyer to conduct their own due diligence regarding condition and potential use.
Key facts
- 0.48 acre lot
- 2 garage spots
- Built 1955
Neighborhood map
What this means for you Summary
Snapshot
- This is a 2-bed/1.0-bath single-family listed at $105k.
Deal economics
- At list price, monthly cash flow is $75 ($905/yr) — positive.
- The deal already cash-flows at list — no discount required.
- Meets the 1% rule at list price ($1k rent vs $105k).
- Recommended offer: $103k (1.5% below list) — sets the bar for market timing.
Location & tenants
- Location reads 67/100 on livability (#593 in OH) — a middle-class / working-renter tenant base. Strengths: cost of living A+, housing A+, health & safety A; Watch: schools C-, crime D-, amenities F.
- Garfield Heights City Schools (suburban): math 8% / reading 22% proficiency, ranked #643 of 656 in OH (top 98%) — low school quality limits family demand, transient renter base, plan for 1-2y turnover; 64% free/reduced lunch — lower-income household profile, screen leases tightly.
- Market conditions: Rents rising fast (+4.8%/yr); 120 active listings in the ZIP; 13 comparable units currently listed for rent nearby; rentals at typical pace (median 18d on market — plan ~3-4 weeks tenant-placement turnaround); 1,441 units permitted in Cuyahoga County in 2024 (700 in 5+ unit buildings).
Forward outlook
- Local home prices are declining (-3.0%/yr); year-one equity from $726 of loan paydown is wiped out by about $3k of value loss. Plan a longer hold.
- Cuyahoga County population projected to shrink 8% by 2050 — rents likely to lag national; underwrite the cash flow, not the appreciation.
Negotiation context
- It's been on market 24 days — a 2% lower offer ($103k) is reasonable based on typical stale-listing flexibility.
- 6 sale attempts since 4y ago; this cycle's ask is 17% above the opening price — seller raised mid-cycle; expect resistance to lowballs.
Risks & watch-outs
- Watch-outs: property tax is 3.6% of price; built in 1955 — expect roof / HVAC / electrical / plumbing capex.
Questions for the listing agent
- Built in 1955 — when were the roof, HVAC, electrical panel, plumbing, and water heater last replaced?
- Property tax is high relative to price — has the assessment been appealed recently, and will the sale trigger a re-assessment?
- Is there a deadline driving the sale (1031 exchange, divorce, estate, relocation)? That informs how much negotiation room exists.
- Crime grade is D in this area — have there been break-ins, vandalism, or insurance claims at this property in the last 3 years? What carrier currently insures it and at what premium?
- The area grade is low — what's the realistic commute time and amenity access for the typical tenant pool here? Any planned neighborhood developments (good or bad) we should know about?
- What's the average days-on-market for RENTAL listings here right now (not sales)? A rising rental-DOM trend means longer vacancies and softer asking-rent achievability than the comps imply.
- What's the recent tenant-quality profile in this submarket — average credit score on applications, eviction rate, late-payment / NSF rate, and stable-employment percentage? A property-management company in the area should have these aggregated.
- How much new for-sale + rental construction is in the pipeline within 1–3 miles? Heavy new supply typically softens prices + rents 12–24 months out; constrained supply supports both.
Investment metrics
- 1% rule
- 1.18% ✓
- Cap rate
- 7.15%
- Cash-on-cash
- 3.08%
- DSCR
- 1.14
- GRM
- 7.0
CMA / ARV
- ARV (on-the-fly)
- $84,036
- Comps found
- 5
Show comp detail 5 sales within ~0.75 mi
| Address | Dist | Beds/Ba | Sqft | Sold | Price | $/sf | Match |
|---|---|---|---|---|---|---|---|
| 4840 E 135th St | 0.36mi | 2/1.0 | 912 (+2%) | 11mo | $115,000 | $126 | 71 |
| 4672 Hillside Ave | 0.08mi | 3/1.0 (+1) | 980 (+10%) | 10mo | $92,000 | $94 | 67 |
| 4709 Hillside Ave | 0.10mi | 3/1.5 (+1) | 980 (+10%) | 7mo | $87,500 | $89 | 66 |
| 4683 Beechgrove Ave | 0.09mi | 3/1.5 (+1) | 980 (+10%) | 20mo | $85,000 | $87 | 56 |
| 4672 Beechgrove Ave | 0.07mi | 3/2.0 (+1) | 980 (+10%) | 24mo | $145,000 | $148 | 52 |
Match score weights: distance 35% · size 25% · config 20% · recency 20%. Top-matched comps best support the ARV.
Projected returns pro-forma
-3.0% appreciation · 4.8% rent growth · sell at horizon
- IRR
- -8.9%
- Equity multiple
- 0.67×
- Total profit
- $-9,794
- Equity at exit
- $15,656
- IRR
- 3.4%
- Equity multiple
- 1.27×
- Total profit
- $7,925
- Equity at exit
- $9,078
Cash invested: $29,400 (down + closing). Projections, not guarantees.
Landlord ↔ Tenant lean methodology
- Overall (STATE)
- 73 Landlord-Friendly
- State Ohio
- 73 Landlord-Friendly · R+6
- County
- — inherits STATE
- City
- — inherits STATE
ZIP-level market 44125
- Rents YoY
- 4.8%
- Active inventory
- 120
- Price-to-rent
- 7.0×
Monthly cashflow live
- Estimated rent
- $1,242 high interval (Pro) →
- Mortgage (P&I)
- −$551
- Tax from tax record
- −$311 /mo · $3,735/yr
- Insurance
- −$44
- HOA
- −$0
- Vacancy / Maint / Mgmt
- −$261
- Net cashflow
- $75
Break-even live
UW: 25.0% down · 7.5% · 30yr · 1.5% tax · 5.0% vac · 8.0% maint · 8.0% mgmt
Financing live
Cash to close
- Down payment
- $26,250
- Closing costs
- $3,150
- Reserves months
- —
- Total cash needed
- —
Loan-product check · same deal, 3 products live
Conventional
25% down · 7.5% · 30yr
- Down + closing
- —
- Monthly P&I
- —
- Monthly cashflow
- —
- DSCR
- —
- Eligible?
- —
Personal DTI + credit; lowest rate.
DSCR
20% down · 8.5% · 30yr
- Down + closing
- —
- Monthly P&I
- —
- Monthly cashflow
- —
- DSCR
- —
- Eligible?
- —
No personal income docs; deal must DSCR.
Hard money
10% down · 12.0% · 12mo
- Down + closing
- —
- Monthly P&I
- —
- Monthly cashflow
- —
- DSCR
- —
- Eligible?
- —
Short-term bridge; refi at stabilization.
Rent comps 13 comps
| Address | Beds | Baths | Sqft | Rent | $/sqft | DOM | Units | Dist |
|---|---|---|---|---|---|---|---|---|
| 4639 E 131st St Garfield Heights, OH | 1.0–2.0 | 1.0 | 545 | $1,190 | $2.18 | 4d | 8 | 0.16mi |
| 5074 Miller Ave Maple Heights, OH | 3.0 | 1.0 | 962 | $1,400 | $1.46 | 44d | 1 | 1.08mi |
| 5200 Miller Ave Maple Heights, OH | 3.0 | 1.0 | 800 | $1,495 | $1.87 | 3d | 1 | 1.18mi |
| 5032 E 110th St Cleveland, OH | 2.0 | 1.0 | 748 | $1,395 | $1.86 | 14d | 1 | 1.33mi |
| 5032 E 110th St Cleveland, OH | 2.0 | 1.0 | 748 | $1,395 | $1.86 | 12d | 1 | 1.33mi |
| 4930 E 108th St Unit Down Garfield Heights, OH | 2.0 | 1.0 | 1067 | $925 | $0.87 | 16d | 1 | 1.34mi |
| 10715 Wadsworth Ave Cleveland, OH | 2.0 | 1.0 | 960 | $800 | $0.83 | 23d | 1 | 1.37mi |
| 10725 Vernon Ave Cleveland, OH | 2.0 | 1.0 | 1092 | $975 | $0.89 | 17d | 1 | 1.38mi |
| 11006 McCracken Rd Cleveland, OH | 2.0 | 1.0 | 887 | $1,350 | $1.52 | 23d | 1 | 1.39mi |
| 5141 Lee Rd Maple Heights, OH | 1.0–2.0 | 1.0 | 775 | $1,350 | $1.74 | 16d | 5 | 1.41mi |
| 10717 Park Heights Ave Unit 3 Garfield Heights, OH | 2.0 | 1.0 | 900 | $750 | $0.83 | 23d | 1 | 1.44mi |
| 10308 Homeworth Ave Unit Down Garfield Heights, OH | 2.0 | 1.0 | 892 | $950 | $1.07 | 23d | 1 | 1.45mi |
| 10010 Parkview Ave Garfield Heights, OH | 3.0 | 1.0 | 877 | $1,500 | $1.71 | 17d | 1 | 1.49mi |
Listing history 18 events
-
2026-06-07statusdays on market $105,000 Pending 24 DOM
-
2026-06-05pricestatusdays on market $105,000 Active 23 DOM
-
2026-04-17status Pending
-
2026-03-26$89,900 Active
-
2024-12-02historical
-
2024-10-25$134,900 Active
-
2024-02-05historical
-
2024-01-03status Active
-
2023-12-19status Pending
-
2023-11-27$139,900 Active
-
2022-08-26soldstatus $131,000 Closed
-
2022-07-19historical Contingent
-
2022-07-15status Active
-
2022-06-29historical Contingent
-
2022-06-24$115,000 Active
-
2021-10-13soldstatus $50,000
-
2021-09-01soldstatus $20,000
-
1971-09-01soldstatus $20,000
ⓘ Source: listings_history table (triggers on properties + properties_extension) + one-shot
backfill from property_details.listing_events for pre-trigger history.
Tax reassessment forecast OH · Partial reset (capped growth)
- Current annual tax
- $3,735 · $311/mo
- Projected year-2 tax
- $3,735 · $311/mo
- Expected delta
- $0/yr ($0/mo · 0.0%)
ⓘ Screening estimate from a state-policy table — verify with the county assessor before closing.
Climate risk First Street
- Flood 1/10 Low FEMA zone X (unshaded) · 0% chance over 30 yrs
- Wildfire 1/10 Low
- Heat 2/10 Low 6 d/yr ≥95°F today · 15 d/yr by 30 yrs out
- Wind 1/10 Low
- Air quality 3/10 Moderate 2 unhealthy d/yr today · 3 by 30 yrs out
Nearby sold comps map
Loading sold comps map…
Walkable amenities ~0.75 mi
Loading nearby amenities…
Taxation est. · year 1
- Rental income
- $14,901
- − Mortgage interest
- −$5,882
- − Property taxes
- −$3,735
- − Insurance
- −$525
- − Repairs & maintenance
- −$1,192
- − Management
- −$1,192
- − Depreciation
- −$3,055
- Taxable loss
- −$679
- Est. tax savings @ 24.0%
- +$163
- After-tax cash flow
- $1,068/yr
For passive investors: Depreciation is non-cash, so a rental often shows a tax loss while cash-flowing — sheltering income. Rental losses are passive: they offset passive income freely, and up to $25,000/yr can offset ordinary (W-2) income if you actively participate and your MAGI is under $100k (phasing out to $0 by $150k); unused losses carry forward. On sale, claimed depreciation is recaptured at up to 25%, and gains may owe capital-gains tax (a 1031 exchange can defer both). Figures are a year-1 estimate at your 24.0% rate — not tax advice; consult a CPA.
Schools (NCES district)
- District
- Garfield Heights City Schools
- NCES district ID
- 3904404
- Math proficiency
- 8% ▼ -19.00%
- Reading proficiency
- 22% ▼ -18.00%
- Median HH income
- $41,334
- Composite
- 12.88/100
- National rank
- #9590
- State rank
- #643 of 656 in OH
Livability — Garfield Heights
- Score
- 67/100
- State rank
- #593
- US rank
- #10152
Category grades
Schools grade is shown separately in the Schools card above.
Census & demographics
- Census place
- Garfield Heights, OH
- County
- Cuyahoga County · 1,090,369 people
- City population
- 29,461
- Metro
- Cleveland-Elyria, OH
- Population (ZIP)
- 29,461
- Household income
- $57,363
- Rent vs Own
- Severe rent burden
- 1738.0
Population outlook (Cuyahoga County) Hauer SSP2
- Today (2025)
- 1,244,621 people
- By 2030
- 1,230,093 · -1.2%
- By 2040
- 1,189,108 · -4.5%
- By 2050
- 1,145,706 · -7.9%
- By 2075
- 1,076,557 · -13.5%
- By 2100
- 978,987 · -21.3%
Race, ethnicity, and origin ACS 2023
- Neighborhood character
- Diverse neighborhood (Simpson 0.61)
- Race & ethnicity
- Black 47% White 41% Two or more races 7% Hispanic / Latino 6%
- Hispanic origin (detail)
- Mexican 2% Puerto Rican 3%
- Common ancestry
- Romanian 11% Slovak 1% Lithuanian 1%
- Foreign-born
- 3% · Canada
- Languages at home
- 94% English-only · Spanish 4% Russian/Polish/Slavic 1%
Political lean MEDSL · Cuyahoga
- 2024 margin
- Solid D (+31.5) · D 65.4% · R 33.9%
- 2008→2024 swing
- -7.4pp toward R · 2008: 38.9pp · 2024: 31.5pp
- All cycles
- 2024: D+31.5 2020: D+34.1 2016: D+35.0 2012: D+38.7 2008: D+38.9
Not yet ingested
- Civics
- —
Market trends
- HPI YoY
- ▼ -116.98%
- Current HPI
- 155.1507
- Rent YoY
- ▲ 4.80%
- Metro
- Cleveland-Elyria, OH
- State GDP YoY
- ▲ 1.98%
- F500 in state
- 48
Industry mix (Fortune 500 HQ in OH)
| Industry | F500 HQs | Revenue |
|---|---|---|
| Insurance | 3 | $145B |
|
||
| Industrial Machinery | 3 | $49B |
|
||
| Financial Services | 3 | $24B |
|
||
| Consumer Goods | 2 | $93B |
|
||
| Aerospace / Defense | 2 | $47B |
|
||
| Utilities | 2 | $33B |
|
||
Price history
+349.5% since first listed16 events — show timeline
- 2026-04-17 Pending — MLSNOW
- 2026-03-26 Listed $89,900 MLSNOW
- 2024-12-02 Listing Removed — MLSNOW
- 2024-10-25 Listed $134,900 MLSNOW
- 2024-02-05 Listing Removed — MLSNOW
- 2024-01-03 Relisted — MLSNOW
- 2023-12-19 Pending — MLSNOW
- 2023-11-27 Listed $139,900 MLSNOW
- 2022-08-26 Sold (MLS) $131,000 MLSNOW
- 2022-07-19 Contingent — MLSNOW
- 2022-07-15 Relisted — MLSNOW
- 2022-06-29 Contingent — MLSNOW
- 2022-06-24 Listed $115,000 MLSNOW
- 2021-10-13 Sold (Public Records) $50,000 Public Records
- 2021-09-01 Sold (Public Records) $20,000 Public Records
- 1971-09-01 Sold (Public Records) $20,000 Public Records
Property tax history
+9.3%/yrLatest (2025): $3,735 · -19.7% YoY. Source: county tax records.
Cash-flow waterfall
monthlySold comps — $/sqft
last 12 mo · ≤1 miLoading sold comps…