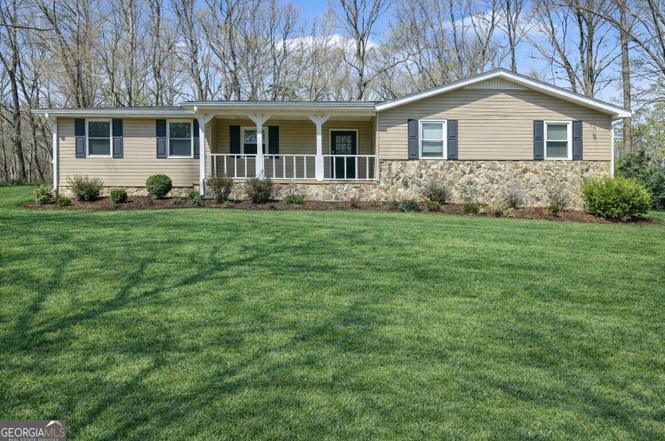
50 Old Lantern Dr · Stockbridge, GA
Flood risk 1/10 · Minimal
- FEMA flood zone
- X (unshaded)
- Chance of flooding over 30 yrs
- 0.0%
- Est. flood insurance / yr
- $507 – $1,088
Fire risk 2/10 · Minimal
- Est. fire insurance / yr
- $963 – $1,789
Heat risk 6/10 · Moderate
- Hot days now (above 106°F)
- 7 days/yr
- Hot days in 30 yrs
- 18 days/yr
Wind risk 6/10 · Moderate
- Chance of severe wind over 30 yrs
- 27.0%
Air-quality risk 4/10 · Minor
- Unhealthy air days now
- 5 days/yr
- Unhealthy air days in 30 yrs
- 7 days/yr
Risk factors via First Street. Map © Google.
Why this score? — see what drove the D grade
The composite is a weighted blend of 9 inputs, each scored 0–100. Each bar is that input's sub-score; the figure is the points it added to the 100-point composite (weight × sub-score).
- Cash flow +14.7/30.0
- ARV discount +7.5/15.0
- DSCR +4.5/10.0
- Livability +3.0/5.0
- 1% rule +2.7/10.0
- Rent growth +2.7/5.0
- Schools +2.6/10.0
- Condition / age +2.5/5.0
- Appreciation +0.0/10.0
$235,000
🖨 Deal sheet 📄 Offer letter ✓ Due diligence
Listing remarks
Awesome Vinyl & Stone Ranch - 3 Bedroom 2 Full Bath - 2 Car Garage - Open Living Room With Stone Fireplace and LVP Flooring - Spacious Eat-In Kitchen - Huge Laundry and Pantry Area - Large Master Suite With Private Master Bath - Roof Only a Few Years Old - Very Well Maintained Home - So Much Potential Throughout - Just Needs A Touch Of Personality and Fresh Paint To Make It Your Own - Perfect For First-Time Homebuyers - Downsizers - Growing Families Or Anyone Looking For A Move-In Ready Home With Room To Customize - Situated On A . 68 Acre Lot With Plenty Of Space To Enjoy - Call Agent Today For Private Showing!!
Key facts
- Open living room
- Vinyl & stone ranch
- Stone fireplace
Tags
Neighborhood map
What this means for you Summary
Snapshot
- This is a 3-bed/2.0-bath single-family listed at $235k.
Deal economics
- At list price, monthly cash flow is $61 ($733/yr) — positive.
- The deal already cash-flows at list — no discount required.
- To meet the 1% rule (rent ≥ 1% of price), the offer needs to be $182k (22.6% below list).
- Recommended offer: $182k (22.6% below list) — sets the bar for 1% rule.
- Cap rate 6.6% vs local median 4.3% in Stockbridge — top-decile yield for the area; either an underpriced asset or a hidden risk that comps aren't pricing in. Stress-test before assuming the spread holds.
Location & tenants
- Location reads 60/100 on livability (#389 in GA) — a middle-class / working-renter tenant base. Strengths: housing A+, cost of living A; Watch: crime D, amenities F, commute F.
- Henry County (rural): math 24% / reading 33% proficiency, ranked #89 of 174 in GA (top 51%) — low school quality limits family demand, transient renter base, plan for 1-2y turnover.
- Zoned schools: Cotton Indian Elementary School (math 10% / reading 18%, grade F, #1,025 of 1,228 statewide, top 84%, 573 students, 67% FRL); Austin Road Middle School (math 15% / reading 35%, grade F, #291 of 470 statewide, top 64%, 542 students, 68% FRL); Stockbridge High School (math 5% / reading 28%, grade F, #284 of 424 statewide, top 67%, 1,543 students, 54% FRL) — zoned schools average 63% FRL vs 43% district-wide (20 pts higher); higher-poverty schools than district average — tighter screening recommended.
- Market conditions: Rents flat; 586 active listings in the ZIP; 6 comparable units currently listed for rent nearby; rentals leasing fast (median 13d on market — plan ~1-2 weeks tenant-placement turnaround); 1,989 units permitted in Henry County in 2024 (92 in 5+ unit buildings).
- This rent runs 31% of the median local income ($71k/yr) — at the standard rent-burdened threshold; future hikes will face affordability resistance.
Forward outlook
- Local home prices are declining (-3.0%/yr); year-one equity from $2k of loan paydown is wiped out by about $7k of value loss. Plan a longer hold.
- Henry County population projected at +29% by 2050 — long-run rental-demand tailwind backs the buy-and-hold thesis.
Negotiation context
- It's been on market 41 days — a 3% lower offer ($228k) is reasonable based on typical stale-listing flexibility.
- Current owner paid $95k; list at $235k implies a 148% gain — meaningful room to come down on a strong offer.
Risks & watch-outs
- Climate carrying-cost: major wind risk, 27% chance of damaging wind over 30y; extreme-heat days projected 7→18/yr by 2055 (HVAC capex compounding) — expect insurance premiums to compound above CPI over the hold.
Questions for the listing agent
- It's been on market 41 days. Have you received any prior offers? Is the seller open to a 23% concession, seller financing, or rate buy-down credit?
- Is there a deadline driving the sale (1031 exchange, divorce, estate, relocation)? That informs how much negotiation room exists.
- Schools are D-rated, which usually means shorter tenancies and higher turnover. Who's the typical renter profile here, and what's been the actual vacancy rate?
- Crime grade is D in this area — have there been break-ins, vandalism, or insurance claims at this property in the last 3 years? What carrier currently insures it and at what premium?
- The area grade is low — what's the realistic commute time and amenity access for the typical tenant pool here? Any planned neighborhood developments (good or bad) we should know about?
- What's the average days-on-market for RENTAL listings here right now (not sales)? A rising rental-DOM trend means longer vacancies and softer asking-rent achievability than the comps imply.
- What's the recent tenant-quality profile in this submarket — average credit score on applications, eviction rate, late-payment / NSF rate, and stable-employment percentage? A property-management company in the area should have these aggregated.
- How much new for-sale + rental construction is in the pipeline within 1–3 miles? Heavy new supply typically softens prices + rents 12–24 months out; constrained supply supports both.
Investment metrics
- 1% rule
- 0.77% ✗
- Cap rate
- 6.60%
- Cash-on-cash
- 1.11%
- DSCR
- 1.05
- GRM
- 10.8
CMA / ARV
- ARV (on-the-fly)
- $235,056
- Comps found
- 10
Show comp detail 10 sales within ~0.75 mi
| Address | Dist | Beds/Ba | Sqft | Sold | Price | $/sf | Match |
|---|---|---|---|---|---|---|---|
| 50 Old Lantern Dr | 0.00mi | 3/2.0 | 1,416 (0%) | 1mo | $235,000 | $166 | 99 |
| 15 Lamp Post Ct | 0.09mi | 3/2.0 | 1,402 (-1%) | 9mo | $207,500 | $148 | 87 |
| 115 Carriage Trce | 0.27mi | 3/2.0 | 1,396 (-1%) | 9mo | $165,000 | $118 | 78 |
| 25 Carriage Ct | 0.17mi | 3/2.0 | 1,344 (-5%) | 11mo | $247,900 | $184 | 74 |
| 69 Trace Ct | 0.42mi | 3/2.0 | 1,339 (-5%) | 11mo | $246,000 | $184 | 62 |
| 190 Sagebrush Rd | 0.45mi | 3/2.0 | 1,408 (-1%) | 22mo | $203,500 | $145 | 60 |
| 210 Carriage Circle Cir | 0.38mi | 3/2.0 | 1,471 (+4%) | 22mo | $265,000 | $180 | 58 |
| 981 E Atlanta Rd | 0.68mi | 3/2.0 | 1,350 (-5%) | 9mo | $227,500 | $169 | 53 |
| 200 Carriage | 0.36mi | 4/2.0 (+1) | 1,512 (+7%) | 23mo | $250,000 | $165 | 48 |
| 1768 E Atlanta Rd | 0.59mi | 3/1.0 | 1,252 (-12%) | 20mo | $115,000 | $92 | 33 |
Match score weights: distance 35% · size 25% · config 20% · recency 20%. Top-matched comps best support the ARV.
Projected returns pro-forma
-3.0% appreciation · 0.87% rent growth · sell at horizon
- IRR
- -16.7%
- Equity multiple
- 0.42×
- Total profit
- $-38,136
- Equity at exit
- $35,039
- IRR
- -12.2%
- Equity multiple
- 0.34×
- Total profit
- $-43,722
- Equity at exit
- $20,319
Cash invested: $65,800 (down + closing). Projections, not guarantees.
Landlord ↔ Tenant lean methodology
- Overall (STATE)
- 90 Strongly Landlord-Friendly
- State Georgia
- 90 Strongly Landlord-Friendly · R+3
- County
- — inherits STATE
- City
- — inherits STATE
ZIP-level market 30281
- Home prices YoY
- -33.6%
- Rents YoY
- 0.9%
- Active inventory
- 586
- Price-to-rent
- 10.8×
Monthly cashflow live
- Estimated rent
- $1,820 high interval (Pro) →
- Mortgage (P&I)
- −$1,232
- Tax from tax record
- −$46 /mo · $555/yr
- Insurance
- −$98
- HOA
- −$0
- Vacancy / Maint / Mgmt
- −$382
- Net cashflow
- $61
Break-even live
UW: 25.0% down · 7.5% · 30yr · 1.5% tax · 5.0% vac · 8.0% maint · 8.0% mgmt
Financing live
Cash to close
- Down payment
- $58,750
- Closing costs
- $7,050
- Reserves months
- —
- Total cash needed
- —
Loan-product check · same deal, 3 products live
Conventional
25% down · 7.5% · 30yr
- Down + closing
- —
- Monthly P&I
- —
- Monthly cashflow
- —
- DSCR
- —
- Eligible?
- —
Personal DTI + credit; lowest rate.
DSCR
20% down · 8.5% · 30yr
- Down + closing
- —
- Monthly P&I
- —
- Monthly cashflow
- —
- DSCR
- —
- Eligible?
- —
No personal income docs; deal must DSCR.
Hard money
10% down · 12.0% · 12mo
- Down + closing
- —
- Monthly P&I
- —
- Monthly cashflow
- —
- DSCR
- —
- Eligible?
- —
Short-term bridge; refi at stabilization.
Rent comps 6 comps
| Address | Beds | Baths | Sqft | Rent | $/sqft | DOM | Units | Dist |
|---|---|---|---|---|---|---|---|---|
| 145 Glenloch Pkwy Stockbridge, GA | 3.0 | 2.0 | 1598 | $1,881 | $1.18 | 15d | 1 | 0.72mi |
| 479 Lakeshore Dr Stockbridge, GA | 3.0 | 2.0 | 1281 | $1,750 | $1.37 | 5d | 1 | 0.75mi |
| 422 Hawthorne Cir Stockbridge, GA | 4.0 | 1.5 | 1488 | $1,756 | $1.18 | 13d | 1 | 0.87mi |
| 335 Edna Dr Stockbridge, GA | 3.0 | 2.0 | 1320 | $1,645 | $1.25 | 13d | 1 | 0.88mi |
| 424 Azalea Dr Stockbridge, GA | 4.0 | 2.0 | 1550 | $1,615 | $1.04 | 44d | 1 | 0.98mi |
| 1515 Flat Rock Rd Stockbridge, GA | 3.0 | 2.0 | 1700 | $1,536 | $0.90 | 5d | 1 | 1.34mi |
Listing history 6 events
-
2026-04-21status Under Contract
-
2026-04-21price $235,000
-
2026-04-15price $229,000
-
2026-03-11$250,000 New
-
1999-07-06soldstatus $94,900
-
1985-08-01soldstatus $64,000
ⓘ Source: listings_history table (triggers on properties + properties_extension) + one-shot
backfill from property_details.listing_events for pre-trigger history.
Tax reassessment forecast GA · Resets to sale price
- Current annual tax
- $555 · $46/mo
- Projected year-2 tax
- $2,162 · $180/mo
- Expected delta
- +$1,607/yr (+$134/mo · 289.7%)
ⓘ Screening estimate from a state-policy table — verify with the county assessor before closing.
Climate risk First Street
- Flood 1/10 Low FEMA zone X (unshaded) · 0% chance over 30 yrs
- Wildfire 2/10 Low
- Heat 6/10 Major 7 d/yr ≥106°F today · 18 d/yr by 30 yrs out
- Wind 6/10 Major 27% chance of damaging wind over 30 yrs
- Air quality 4/10 Moderate 5 unhealthy d/yr today · 7 by 30 yrs out
Nearby sold comps map
Loading sold comps map…
Walkable amenities ~0.75 mi
Loading nearby amenities…
Taxation est. · year 1
- Rental income
- $21,836
- − Mortgage interest
- −$13,164
- − Property taxes
- −$555
- − Insurance
- −$1,175
- − Repairs & maintenance
- −$1,747
- − Management
- −$1,747
- − Depreciation
- −$6,836
- Taxable loss
- −$3,387
- Est. tax savings @ 24.0%
- +$813
- After-tax cash flow
- $1,546/yr
For passive investors: Depreciation is non-cash, so a rental often shows a tax loss while cash-flowing — sheltering income. Rental losses are passive: they offset passive income freely, and up to $25,000/yr can offset ordinary (W-2) income if you actively participate and your MAGI is under $100k (phasing out to $0 by $150k); unused losses carry forward. On sale, claimed depreciation is recaptured at up to 25%, and gains may owe capital-gains tax (a 1031 exchange can defer both). Figures are a year-1 estimate at your 24.0% rate — not tax advice; consult a CPA.
Schools (NCES district)
- District
- Henry County
- NCES district ID
- 1302820
- Math proficiency
- 24% ▼ -9.00%
- Reading proficiency
- 33% ▼ -7.00%
- Median HH income
- $62,594
- Composite
- 26.13/100
- National rank
- #7279
- State rank
- #89 of 174 in GA
Livability — Stockbridge
- Score
- 60/100
- State rank
- #389
- US rank
- #19479
Category grades
Schools grade is shown separately in the Schools card above.
Census & demographics
- County
- Henry County · 316,359 people
- City population
- 106,165
- Metro
- Atlanta-Sandy Springs-Alpharetta, GA
- Population (ZIP)
- 71,603
- Household income
- $71,213
- Rent vs Own
- Severe rent burden
- 2464.0
Population outlook (Henry County) Hauer SSP2
- Today (2025)
- 249,041 people
- By 2030
- 264,369 · +6.2%
- By 2040
- 294,459 · +18.2%
- By 2050
- 322,249 · +29.4%
- By 2075
- 392,310 · +57.5%
- By 2100
- 437,836 · +75.8%
Race, ethnicity, and origin ACS 2023
- Neighborhood character
- Diverse neighborhood (Simpson 0.61)
- Race & ethnicity
- Black 55% White 28% Hispanic / Latino 11% Two or more races 6% Asian 4%
- Hispanic origin (detail)
- Mexican 7%
- Common ancestry
- Hispanic 1% Italian 1% Romanian 1%
- Foreign-born
- 9% · Canada, Vietnam
- Languages at home
- 86% English-only · Spanish 8% Vietnamese 2% French/Haitian/Cajun 1%
Political lean MEDSL · Henry
- 2024 margin
- Strong D (+29.7) · D 64.5% · R 34.9%
- 2008→2024 swing
- +37.1pp toward D · 2008: -7.5pp · 2024: 29.7pp
- All cycles
- 2024: D+29.7 2020: D+20.5 2016: D+4.3 2012: R+3.2 2008: R+7.5
Not yet ingested
- Civics
- —
Market trends
- HPI YoY
- ▼ -104.76%
- Current HPI
- 207.2332
- Rent YoY
- ▲ 0.87%
- Metro
- Atlanta-Sandy Springs-Alpharetta, GA
- State GDP YoY
- ▲ 2.66%
- F500 in state
- 28
Industry mix (Fortune 500 HQ in GA)
| Industry | F500 HQs | Revenue |
|---|---|---|
| Paper / Packaging | 2 | $29B |
|
||
| Retail | 1 | $160B |
|
||
| Transportation / Logistics | 1 | $91B |
|
||
| Airlines | 1 | $62B |
|
||
| Consumer Goods | 1 | $47B |
|
||
| Utilities | 1 | $25B |
|
||
Price history
+267.2% since first listed6 events — show timeline
- 2026-04-21 Pending — GAMLS
- 2026-04-21 Price Changed $235,000 GAMLS
- 2026-04-15 Price Changed $229,000 GAMLS
- 2026-03-11 Listed $250,000 GAMLS
- 1999-07-06 Sold (Public Records) $94,900 Public Records
- 1985-08-01 Sold (Public Records) $64,000 Public Records
Property tax history
-3.1%/yrLatest (2025): $555 · -1.3% YoY. Source: county tax records.
Cash-flow waterfall
monthlySold comps — $/sqft
last 12 mo · ≤1 miLoading sold comps…