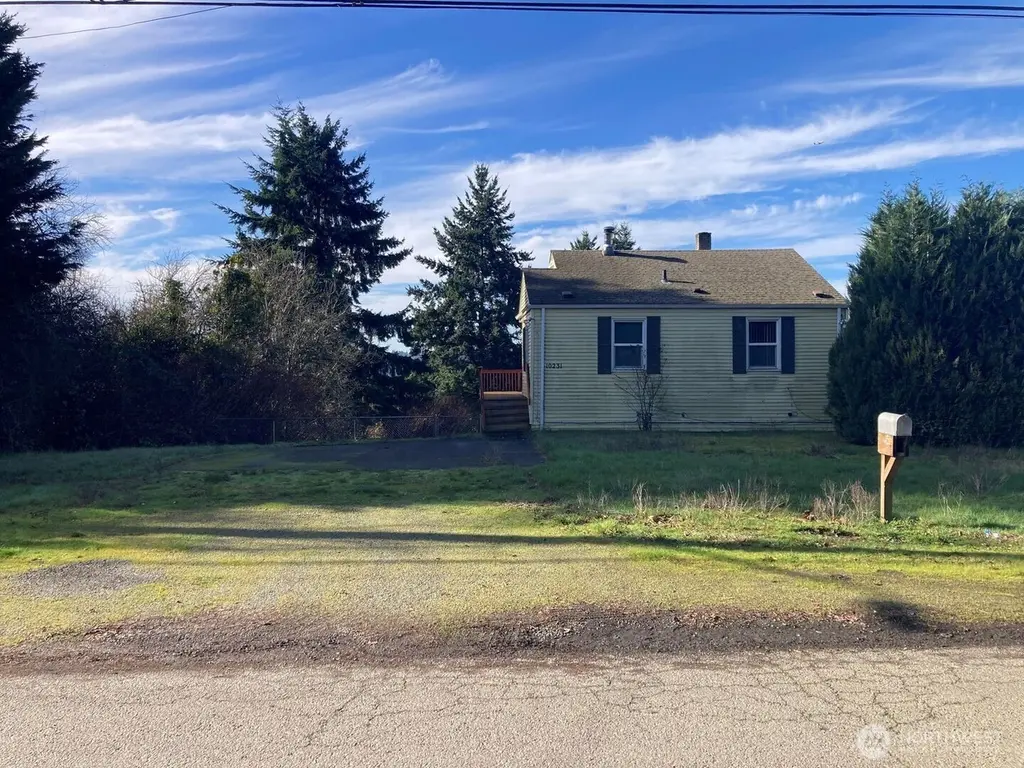
10231 Beacon Ave S · Tukwila, WA
Flood risk 1/10 · Minimal
- FEMA flood zone
- X (unshaded)
- Chance of flooding over 30 yrs
- 0.0%
- Est. flood insurance / yr
- $473 – $860
Fire risk 1/10 · Minimal
- Est. fire insurance / yr
- $604 – $1,122
Heat risk 3/10 · Minor
- Hot days now (above 87°F)
- 7 days/yr
- Hot days in 30 yrs
- 14 days/yr
Wind risk 1/10 · Minimal
- Chance of severe wind over 30 yrs
- —
Air-quality risk 7/10 · Major
- Unhealthy air days now
- 9 days/yr
- Unhealthy air days in 30 yrs
- 12 days/yr
Risk factors via First Street. Map © Google.
Why this score? — see what drove the C- grade
The composite is a weighted blend of 9 inputs, each scored 0–100. Each bar is that input's sub-score; the figure is the points it added to the 100-point composite (weight × sub-score).
- ARV discount +15.0/15.0
- Cash flow +14.2/30.0
- Schools +6.1/10.0
- DSCR +4.3/10.0
- Livability +3.8/5.0
- 1% rule +3.5/10.0
- Rent growth +3.2/5.0
- Condition / age +2.5/5.0
- Appreciation +0.0/10.0
$365,750
🖨 Deal sheet 📄 Offer letter ✓ Due diligence
Listing remarks
This home offers solid potential with good bones and a functional layout on a nice-sized lot in a desirable location. This property presents an excellent investment opportunity with solid potential for the right buyer. The three bedrooms and one and a half bathrooms provide a functional foundation, while the private backyard offers valuable outdoor space that enhances the overall appeal and usability of the property. The secluded rear yard creates an ideal setting for future entertaining, gardening, or simply enjoying outdoor relaxation away from neighboring properties. This private outdoor area adds significant value and versatility to the property, making it an attractive feature for pote
Key facts
- City views
- Rear deck
- Oversized lot
Tags
Neighborhood map
What this means for you Summary
Snapshot
- This is a 3-bed/2.0-bath single-family listed at $366k.
Deal economics
- At list price, monthly cash flow is $60 ($724/yr) — positive.
- The deal already cash-flows at list — no discount required.
- To meet the 1% rule (rent ≥ 1% of price), the offer needs to be $310k (15.3% below list).
- Recommended offer: $310k (15.3% below list) — sets the bar for 1% rule.
- Cap rate 6.5% vs local median 2.0% in Tukwila — top-decile yield for the area; either an underpriced asset or a hidden risk that comps aren't pricing in. Stress-test before assuming the spread holds.
Location & tenants
- Location reads 75/100 on livability (#165 in WA, #3,938 nationally) — a middle-class / working-renter tenant base. Strengths: commute A+, health & safety A+, amenities A; Watch: crime F, cost of living D-.
- Seattle Public Schools (urban): math 64% / reading 72% proficiency, ranked #19 of 291 in WA (top 6%) — acceptable for families but not a draw, mixed tenant base, ~2y average lease.
- Market conditions: Rents rising (+2.8%/yr); 139 active listings in the ZIP; 15 comparable units currently listed for rent nearby; rentals at typical pace (median 15d on market — plan ~3-4 weeks tenant-placement turnaround); solid renter incomes; 10,555 units permitted in King County in 2024 (7,119 in 5+ unit buildings).
- This rent runs 37% of the median local income ($100k/yr) — at the standard rent-burdened threshold; future hikes will face affordability resistance.
Forward outlook
- Local home prices are declining (-3.0%/yr); year-one equity from $3k of loan paydown is wiped out by about $11k of value loss. Plan a longer hold.
- King County population projected at +44% by 2050 — long-run rental-demand tailwind backs the buy-and-hold thesis.
Negotiation context
- It's been on market 85 days — a 6% lower offer ($344k) is reasonable based on typical stale-listing flexibility.
- Current owner paid $56k; list at $366k implies a 554% gain — meaningful room to come down on a strong offer.
Risks & watch-outs
- Watch-outs: built in 1948 — expect roof / HVAC / electrical / plumbing capex.
Questions for the listing agent
- It's been on market 85 days. Have you received any prior offers? Is the seller open to a 15% concession, seller financing, or rate buy-down credit?
- Built in 1948 — when were the roof, HVAC, electrical panel, plumbing, and water heater last replaced?
- Why hasn't it sold? Are there any deal-killer items the seller is aware of (foundation, flood, title, zoning, code violations)?
- Is there a deadline driving the sale (1031 exchange, divorce, estate, relocation)? That informs how much negotiation room exists.
- Schools are B-rated — typically a magnet for longer-tenancy family renters. What's the average tenant stay here, and is there a school-zone premium baked into asking?
- Crime grade is F in this area — have there been break-ins, vandalism, or insurance claims at this property in the last 3 years? What carrier currently insures it and at what premium?
- What's the average days-on-market for RENTAL listings here right now (not sales)? A rising rental-DOM trend means longer vacancies and softer asking-rent achievability than the comps imply.
- What's the recent tenant-quality profile in this submarket — average credit score on applications, eviction rate, late-payment / NSF rate, and stable-employment percentage? A property-management company in the area should have these aggregated.
- How much new for-sale + rental construction is in the pipeline within 1–3 miles? Heavy new supply typically softens prices + rents 12–24 months out; constrained supply supports both.
Investment metrics
- 1% rule
- 0.85% ✗
- Cap rate
- 6.49%
- Cash-on-cash
- 0.71%
- DSCR
- 1.03
- GRM
- 9.8
CMA / ARV
- ARV (median comp)
- $600,072
- List price
- $365,750
- Delta
- -39.05%
- Verdict
- UNDERPRICED
- Comps
- 20 within 1.0 mi
Show comp detail 12 sales within ~0.75 mi
| Address | Dist | Beds/Ba | Sqft | Sold | Price | $/sf | Match |
|---|---|---|---|---|---|---|---|
| 4726 S Victor St | 0.14mi | 3/1.5 | 1,530 (+1%) | 2mo | $710,000 | $464 | 88 |
| 9744 49th Ave S | 0.29mi | 3/2.0 | 1,520 (+1%) | 12mo | $730,000 | $480 | 75 |
| 9809 57th Ave S | 0.52mi | 3/2.0 | 1,480 (-2%) | 9mo | $604,000 | $408 | 65 |
| 11122 Luther Ave S | 0.58mi | 4/1.5 (+1) | 1,500 (-1%) | 3mo | $528,000 | $352 | 62 |
| 5521 S Bangor St | 0.41mi | 3/2.0 | 1,620 (+7%) | 11mo | $655,000 | $404 | 60 |
| 5523 S Leo St | 0.57mi | 3/1.0 | 1,480 (-2%) | 11mo | $370,000 | $250 | 57 |
| 3928 S Pilgrim St | 0.74mi | 3/2.0 | 1,440 (-5%) | 3mo | $665,000 | $462 | 56 |
| 9643 56th Ave S | 0.60mi | 3/1.0 | 1,400 (-7%) | 2mo | $553,000 | $395 | 55 |
| 9615 58th Ave S | 0.71mi | 3/2.0 | 1,397 (-8%) | 4mo | $759,000 | $543 | 51 |
| 5001 S Fletcher St | 0.70mi | 3/3.5 | 1,570 (+4%) | 9mo | $675,000 | $430 | 47 |
| 9829 60th Ave S | 0.66mi | 3/2.0 | 1,380 (-9%) | 10mo | $600,000 | $435 | 46 |
| 9324 52nd Ave S | 0.68mi | 2/1.0 (-1) | 1,420 (-6%) | 4mo | $465,000 | $327 | 46 |
Match score weights: distance 35% · size 25% · config 20% · recency 20%. Top-matched comps best support the ARV.
Projected returns pro-forma
-3.0% appreciation · 2.78% rent growth · sell at horizon
- IRR
- -15.4%
- Equity multiple
- 0.45×
- Total profit
- $-56,147
- Equity at exit
- $54,535
- IRR
- -7.3%
- Equity multiple
- 0.54×
- Total profit
- $-46,897
- Equity at exit
- $31,623
Cash invested: $102,410 (down + closing). Projections, not guarantees.
Landlord ↔ Tenant lean methodology
- Overall (STATE)
- 28 Tenant-Leaning
- State Washington
- 28 Tenant-Leaning · D+8
- County
- — inherits STATE
- City
- — inherits STATE
ZIP-level market 98178
- Rents YoY
- 2.8%
- Active inventory
- 139
- Price-to-rent
- 9.8×
Monthly cashflow live
- Estimated rent
- $3,099 high interval (Pro) →
- Mortgage (P&I)
- −$1,918
- Tax from tax record
- −$317 /mo · $3,806/yr
- Insurance
- −$152
- HOA
- −$0
- Vacancy / Maint / Mgmt
- −$651
- Net cashflow
- $60
Break-even live
UW: 25.0% down · 7.5% · 30yr · 1.5% tax · 5.0% vac · 8.0% maint · 8.0% mgmt
Financing live
Cash to close
- Down payment
- $91,438
- Closing costs
- $10,972
- Reserves months
- —
- Total cash needed
- —
Loan-product check · same deal, 3 products live
Conventional
25% down · 7.5% · 30yr
- Down + closing
- —
- Monthly P&I
- —
- Monthly cashflow
- —
- DSCR
- —
- Eligible?
- —
Personal DTI + credit; lowest rate.
DSCR
20% down · 8.5% · 30yr
- Down + closing
- —
- Monthly P&I
- —
- Monthly cashflow
- —
- DSCR
- —
- Eligible?
- —
No personal income docs; deal must DSCR.
Hard money
10% down · 12.0% · 12mo
- Down + closing
- —
- Monthly P&I
- —
- Monthly cashflow
- —
- DSCR
- —
- Eligible?
- —
Short-term bridge; refi at stabilization.
Rent comps 15 comps
| Address | Beds | Baths | Sqft | Rent | $/sqft | DOM | Units | Dist |
|---|---|---|---|---|---|---|---|---|
| 5514 S Avon St Seattle, WA | 4.0 | 1.5 | 2020 | $4,400 | $2.18 | 44d | 1 | 0.60mi |
| 5526 S Avon St Seattle, WA | 2.0 | 1.0 | 1300 | $2,495 | $1.92 | 43d | 1 | 0.61mi |
| 9400 Rainier Ave S Seattle, WA | 3.0 | 1.0–2.0 | 764 | $2,331 | $3.05 | 19d | 25 | 0.82mi |
| 9128 48th Ave S Seattle, WA | 2.0 | 2.0 | 1180 | $2,700 | $2.29 | 1d | 1 | 0.87mi |
| 9125 50th Ave S Unit A Seattle, WA | 4.0 | 3.5 | 1710 | $3,300 | $1.93 | 2d | 1 | 0.87mi |
| 9750 Rainier Ave S Seattle, WA | 3.0 | 2.0 | 2200 | $6,200 | $2.82 | 1d | 1 | 0.96mi |
| 9500 Rainier Ave S #212 Seattle, WA | 2.0 | 2.0 | 1073 | $2,950 | $2.75 | 1d | 1 | 0.96mi |
| 4230 S Trenton St Seattle, WA | 3.0 | 1.5 | 1350 | $3,100 | $2.30 | 1d | 1 | 1.14mi |
| 8618 Seward Park Ave S Seattle, WA | 3.0 | 1.0 | 1840 | $2,850 | $1.55 | 12d | 1 | 1.22mi |
| 11437 70th Pl S Seattle, WA | 3.0 | 1.0 | 1100 | $2,925 | $2.66 | 43d | 1 | 1.24mi |
| 8621 39th Ave S Seattle, WA | 2.0 | 2.5 | 1640 | $3,650 | $2.23 | 1d | 1 | 1.29mi |
| 12427 56th Pl S Seattle, WA | 3.0 | 1.0 | 1700 | $3,000 | $1.76 | 18d | 1 | 1.30mi |
| 12429 56th Pl S Seattle, WA | 3.0 | 1.0 | 1700 | $3,000 | $1.76 | 15d | 1 | 1.30mi |
| 12426 56th Pl S Seattle, WA | 3.0 | 1.0 | 1700 | $3,000 | $1.76 | 18d | 1 | 1.31mi |
| 11030 Roseberg Ave S Seattle, WA | 3.0 | 2.0 | 1340 | $2,495 | $1.86 | 14d | 1 | 1.47mi |
Listing history 18 events
-
2026-06-19days on market $365,750 Active 85 DOM
-
2026-06-18days on market $365,750 Active 84 DOM
-
2026-06-17days on market $365,750 Active 83 DOM
-
2026-06-16days on market $365,750 Active 82 DOM
-
2026-06-16status $365,750 Active 81 DOM
-
2026-06-08status $365,750 Pending 81 DOM
-
2026-06-08days on market $365,750 Active 81 DOM
-
2026-06-07days on market $365,750 Active 80 DOM
-
2026-06-07days on market $365,750 Active 79 DOM
-
2026-06-04days on market $365,750 Active 77 DOM
-
2026-06-03price $365,750 Active 76 DOM
-
2026-06-03days on market $399,000 Active 76 DOM
-
2026-06-02days on market $399,000 Active 75 DOM
-
2026-06-01days on market $399,000 Active 74 DOM
-
2026-05-31days on market $399,000 Active 73 DOM
-
2026-04-20price $399,000
-
2026-03-19$420,000 Active
-
1983-09-30soldstatus $55,950
ⓘ Source: listings_history table (triggers on properties + properties_extension) + one-shot
backfill from property_details.listing_events for pre-trigger history.
Tax reassessment forecast WA · Resets to sale price
- Current annual tax
- $3,806 · $317/mo
- Projected year-2 tax
- $3,806 · $317/mo
- Expected delta
- $0/yr ($0/mo · 0.0%)
ⓘ Screening estimate from a state-policy table — verify with the county assessor before closing.
Climate risk First Street
- Flood 1/10 Low FEMA zone X (unshaded) · 0% chance over 30 yrs
- Wildfire 1/10 Low
- Heat 3/10 Moderate 7 d/yr ≥87°F today · 14 d/yr by 30 yrs out
- Wind 1/10 Low
- Air quality 7/10 Severe 9 unhealthy d/yr today · 12 by 30 yrs out
Nearby sold comps map
Loading sold comps map…
Walkable amenities ~0.75 mi
Loading nearby amenities…
Taxation est. · year 1
- Rental income
- $37,185
- − Mortgage interest
- −$20,488
- − Property taxes
- −$3,806
- − Insurance
- −$1,829
- − Repairs & maintenance
- −$2,975
- − Management
- −$2,975
- − Depreciation
- −$10,640
- Taxable loss
- −$5,528
- Est. tax savings @ 24.0%
- +$1,327
- After-tax cash flow
- $2,051/yr
For passive investors: Depreciation is non-cash, so a rental often shows a tax loss while cash-flowing — sheltering income. Rental losses are passive: they offset passive income freely, and up to $25,000/yr can offset ordinary (W-2) income if you actively participate and your MAGI is under $100k (phasing out to $0 by $150k); unused losses carry forward. On sale, claimed depreciation is recaptured at up to 25%, and gains may owe capital-gains tax (a 1031 exchange can defer both). Figures are a year-1 estimate at your 24.0% rate — not tax advice; consult a CPA.
Schools (NCES district)
- District
- Seattle Public Schools
- NCES district ID
- 5307710
- Math proficiency
- 64% ▼ -1.00%
- Reading proficiency
- 72% ▬ 0.00%
- Median HH income
- $68,695
- Composite
- 60.76/100
- National rank
- #1649
- State rank
- #19 of 291 in WA
Livability — Tukwila
- Score
- 75/100
- State rank
- #165
- US rank
- #3938
Category grades
Schools grade is shown separately in the Schools card above.
Census & demographics
- Census place
- Tukwila, WA
- County
- King County · 2,251,916 people
- Metro
- Seattle-Tacoma-Bellevue, WA
- Population (ZIP)
- 26,748
- Household income
- $99,505
- Rent vs Own
- Severe rent burden
- 1035.0
Population outlook (King County) Hauer SSP2
- Today (2025)
- 2,576,485 people
- By 2030
- 2,803,316 · +8.8%
- By 2040
- 3,255,921 · +26.4%
- By 2050
- 3,706,444 · +43.9%
- By 2075
- 4,746,063 · +84.2%
- By 2100
- 5,407,730 · +109.9%
Race, ethnicity, and origin ACS 2023
- Neighborhood character
- Highly diverse neighborhood (Simpson 0.76)
- Race & ethnicity
- Asian 32% White 29% Black 22% Two or more races 10% Hispanic / Latino 9% Native American 1%
- Hispanic origin (detail)
- Mexican 6%
- Common ancestry
- Subsaharan African 2% Lithuanian 2% Russian 2%
- Foreign-born
- 31% · Vietnam, China, Canada
- Languages at home
- 64% English-only · Vietnamese 10% Chinese 6% Other Asian/Pacific 4%
Political lean MEDSL · King
- 2024 margin
- Solid D (+51.7) · D 74.2% · R 22.5% · Other 3.4%
- 2008→2024 swing
- +9.6pp toward D · 2008: 42.1pp · 2024: 51.7pp
- All cycles
- 2024: D+51.7 2020: D+52.7 2016: D+50.4 2012: D+39.9 2008: D+42.1
Not yet ingested
- Civics
- —
Market trends
- HPI YoY
- ▼ -854.35%
- Current HPI
- 321.6474
- Rent YoY
- ▲ 2.78%
- Metro
- Seattle-Tacoma-Bellevue, WA
- State GDP YoY
- ▲ 4.65%
- F500 in state
- 22
Industry mix (Fortune 500 HQ in WA)
| Industry | F500 HQs | Revenue |
|---|---|---|
| Retail | 2 | $269B |
|
||
| Technology / Retail | 1 | $638B |
|
||
| Technology | 1 | $245B |
|
||
| Telecommunications | 1 | $38B |
|
||
| Food / Beverage | 1 | $36B |
|
||
| Automotive / Trucks | 1 | $34B |
|
||
Price history
+613.1% since first listed3 events — show timeline
- 2026-04-20 Price Changed $399,000 NWMLS as Distributed by MLS Grid
- 2026-03-19 Listed $420,000 NWMLS as Distributed by MLS Grid
- 1983-09-30 Sold (Public Records) $55,950 Public Records
Property tax history
+8.2%/yrLatest (2025): $3,806 · +685.3% YoY. Source: county tax records.
Cash-flow waterfall
monthlySold comps — $/sqft
last 12 mo · ≤1 miLoading sold comps…