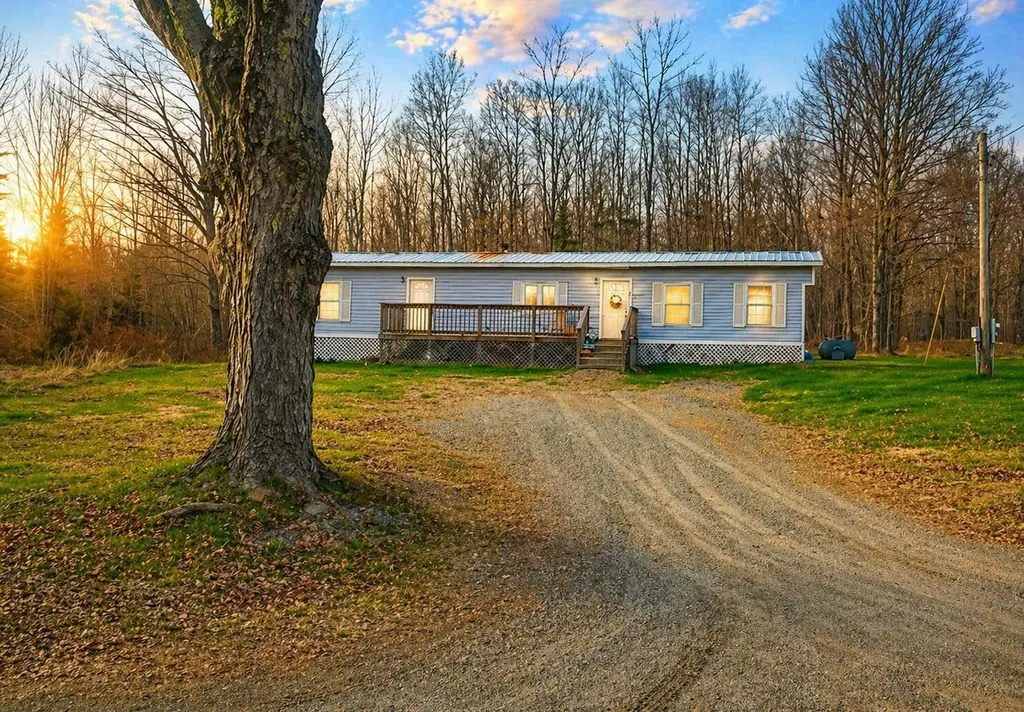
10 Castle Rd · Hartland, ME
Flood risk No data
- FEMA flood zone
- —
- Chance of flooding over 30 yrs
- —
- Est. flood insurance / yr
- —
Fire risk No data
- Est. fire insurance / yr
- —
Heat risk No data
- Hot days now (above threshold)
- —
- Hot days in 30 yrs
- —
Wind risk No data
- Chance of severe wind over 30 yrs
- —
Air-quality risk No data
- Unhealthy air days now
- —
- Unhealthy air days in 30 yrs
- —
Risk factors via First Street. Map © Google.
Why this score? — see what drove the B grade
The composite is a weighted blend of 9 inputs, each scored 0–100. Each bar is that input's sub-score; the figure is the points it added to the 100-point composite (weight × sub-score).
- Cash flow +27.6/30.0
- DSCR +9.7/10.0
- Appreciation +9.0/10.0
- ARV discount +7.5/15.0
- 1% rule +6.7/10.0
- Schools +3.1/10.0
- Livability +3.1/5.0
- Rent growth +2.5/5.0
- Condition / age +2.5/5.0
$85,000
🖨 Deal sheet (PDF) 📄 Offer letter ✓ Due diligence
Listing remarks MLS
OLDER MOBILE HOME HAS BEEN REDONE GOOD SHAPE ON ATV TRAILS NEAR PUBLIC BOAT LAUNCH ON MAINSTREAM WIDE WATERS GREAT FOR CAMP OR YEAR ROUND HOME 1/2 HOUR FROM I95 NEWPORT
Key facts
- Quiet rural setting
- Front porch
- Back deck
Tags
Neighborhood map
What this means for you Summary
Snapshot
- This is a 2-bed/1.0-bath other listed at $85k.
Deal economics
- At list price, monthly cash flow is $254 ($3k/yr) — positive.
- The deal already cash-flows at list — no discount required.
- Meets the 1% rule at list price ($991 rent vs $85k).
- Cap rate 9.9% vs local median 5.9% in Hartland — top-decile yield for the area; either an underpriced asset or a hidden risk that comps aren't pricing in. Stress-test before assuming the spread holds.
Location & tenants
- Location reads 61/100 on livability (#120 in ME) — a middle-class / working-renter tenant base. Strengths: cost of living A+, housing A+, crime B+; Watch: health & safety C-, schools F, amenities F.
- Harmony Public Schools (rural): math 20% / reading 50% proficiency, ranked #152 of 185 in ME (top 82%) — families likely to look elsewhere, expect single-tenant / working-renter base with shorter leases.
- Market conditions: 18 active listings in the ZIP; 129 units permitted in Somerset County in 2024 (0 in 5+ unit buildings).
Forward outlook
- In year one you build about $7k of equity ($588 loan paydown + $7k appreciation (8.0% local appreciation)).
- Somerset County population projected at -25% by 2050 — secular population decline; favor cash flow + early exit over multi-decade hold.
- At projected returns (8.0% appreciation + 3.0% rent growth), your $24k cash investment doubles in ~3 years — after that, you're playing with house money.
- By year 5, paydown + projected appreciation supports a ~$33k cash-out refi (75% LTV) — recoverable capital for the next deal without selling this one.
Negotiation context
- Only 4 days on market — expect competitive offers; lowballing is unlikely to land.
- 2 sale attempts since 2y ago with the ask held roughly flat each time — persistent listings suggest the price (not the market) is what's stuck; bring a comps-based counter.
- Current owner paid $35k; list at $85k implies a 143% gain — meaningful room to come down on a strong offer.
Questions for the listing agent
- Built in 1972 — when were the roof, HVAC, electrical panel, plumbing, and water heater last replaced?
- Is there a deadline driving the sale (1031 exchange, divorce, estate, relocation)? That informs how much negotiation room exists.
- Schools are F-rated, which usually means shorter tenancies and higher turnover. Who's the typical renter profile here, and what's been the actual vacancy rate?
- What's the average days-on-market for RENTAL listings here right now (not sales)? A rising rental-DOM trend means longer vacancies and softer asking-rent achievability than the comps imply.
- What's the recent tenant-quality profile in this submarket — average credit score on applications, eviction rate, late-payment / NSF rate, and stable-employment percentage? A property-management company in the area should have these aggregated.
- How much new for-sale + rental construction is in the pipeline within 1–3 miles? Heavy new supply typically softens prices + rents 12–24 months out; constrained supply supports both.
Investment metrics
- 1% rule
- 1.17% ✓
- Cap rate
- 9.88%
- Cash-on-cash
- 12.83%
- DSCR
- 1.57
- GRM
- 7.1
CMA / ARV
No comps found within radius.
Projected returns pro-forma
8.0% appreciation · 3.0% rent growth · sell at horizon
- IRR
- 30.0%
- Equity multiple
- 3.15×
- Total profit
- $51,185
- Equity at exit
- $64,565
- IRR
- 26.8%
- Equity multiple
- 6.73×
- Total profit
- $136,425
- Equity at exit
- $128,150
Cash invested: $23,800 (down + closing). Projections, not guarantees.
Landlord ↔ Tenant lean methodology
- Overall (STATE)
- 41 Moderately Tenant-Leaning
- State Maine
- 41 Moderately Tenant-Leaning · D+2
- County
- — inherits STATE
- City
- — inherits STATE
ZIP-level market 04942
- Home prices YoY
- 4.6%
- Active inventory
- 18
- Price-to-rent
- 7.1×
Monthly cashflow live
- Estimated rent
- $991 medium interval (Pro) →
- Mortgage (P&I)
- −$446
- Tax from tax record
- −$48 /mo · $571/yr
- Insurance
- −$35
- HOA
- −$0
- Vacancy / Maint / Mgmt
- −$208
- Net cashflow
- $254
Break-even live
Sensitivity live
| Price | -10% $303 | -5% $278 | +0% $254 | +5% $230 | +10% $206 |
|---|---|---|---|---|---|
| Rent | -10% $176 | -5% $215 | +0% $254 | +5% $294 | +10% $333 |
| Rate | -1.0pp $297 | -0.5pp $276 | base $254 | +0.5pp $232 | +1.0pp $210 |
UW: 25.0% down · 7.5% · 30yr · 1.5% tax · 5.0% vac · 8.0% maint · 8.0% mgmt
Financing live
Cash to close
- Down payment
- $21,250
- Closing costs
- $2,550
- Reserves months
- —
- Total cash needed
- —
Loan-product check · same deal, 3 products live
Conventional
25% down · 7.5% · 30yr
- Down + closing
- —
- Monthly P&I
- —
- Monthly cashflow
- —
- DSCR
- —
- Eligible?
- —
Personal DTI + credit; lowest rate.
DSCR
20% down · 8.5% · 30yr
- Down + closing
- —
- Monthly P&I
- —
- Monthly cashflow
- —
- DSCR
- —
- Eligible?
- —
No personal income docs; deal must DSCR.
Hard money
10% down · 12.0% · 12mo
- Down + closing
- —
- Monthly P&I
- —
- Monthly cashflow
- —
- DSCR
- —
- Eligible?
- —
Short-term bridge; refi at stabilization.
Listing history 7 events
-
2026-04-28status Pending
-
2026-04-24$85,000 Active
-
2026-04-16price $71,500
-
2026-04-10price $73,000
-
2024-06-14soldstatus $35,000 Closed 179-char remark
Show marketing remark (179 chars)
OLDER MOBILE HOME HAS BEEN REDONE GOOD SHAPE ON ATV TRAILS NEAR PUBLIC BOAT LAUNCH ON MAINSTREAM WIDE WATERS GREAT FOR CAMP OR YEAR ROUND HOME 1/2 HOUR FROM I95 NEWPORT
-
2024-06-08status Pending 179-char remark
Show marketing remark (179 chars)
OLDER MOBILE HOME HAS BEEN REDONE GOOD SHAPE ON ATV TRAILS NEAR PUBLIC BOAT LAUNCH ON MAINSTREAM WIDE WATERS GREAT FOR CAMP OR YEAR ROUND HOME 1/2 HOUR FROM I95 NEWPORT
-
2024-05-31$60,000 Active 179-char remark
Show marketing remark (179 chars)
OLDER MOBILE HOME HAS BEEN REDONE GOOD SHAPE ON ATV TRAILS NEAR PUBLIC BOAT LAUNCH ON MAINSTREAM WIDE WATERS GREAT FOR CAMP OR YEAR ROUND HOME 1/2 HOUR FROM I95 NEWPORT
ⓘ Source: listings_history table (triggers on properties + properties_extension) + one-shot
backfill from property_details.listing_events for pre-trigger history.
Tax reassessment forecast ME · Partial reset (capped growth)
- Current annual tax
- $571 · $48/mo
- Projected year-2 tax
- $864 · $72/mo
- Expected delta
- +$292/yr (+$24/mo · 51.2%)
ⓘ Screening estimate from a state-policy table — verify with the county assessor before closing.
Nearby sold comps map
Loading sold comps map…
Walkable amenities ~0.75 mi
Loading nearby amenities…
Taxation est. · year 1
- Rental income
- $11,896
- − Mortgage interest
- −$4,761
- − Property taxes
- −$571
- − Insurance
- −$425
- − Repairs & maintenance
- −$952
- − Management
- −$952
- − Depreciation
- −$2,473
- Taxable income
- $1,762
- Est. tax owed @ 24.0%
- −$423
- After-tax cash flow
- $2,630/yr
For passive investors: Depreciation is non-cash, so a rental often shows a tax loss while cash-flowing — sheltering income. Rental losses are passive: they offset passive income freely, and up to $25,000/yr can offset ordinary (W-2) income if you actively participate and your MAGI is under $100k (phasing out to $0 by $150k); unused losses carry forward. On sale, claimed depreciation is recaptured at up to 25%, and gains may owe capital-gains tax (a 1031 exchange can defer both). Figures are a year-1 estimate at your 24.0% rate — not tax advice; consult a CPA.
Schools (NCES district)
- District
- Harmony Public Schools
- NCES district ID
- 2306330
- Math proficiency
- 20% ▼ -20.00%
- Reading proficiency
- 50% ▬ 0.00%
- Median HH income
- $31,217
- Composite
- 31.13/100
- National rank
- #11285
- State rank
- #152 of 185 in ME
Livability — Hartland
- Score
- 61/100
- State rank
- #120
- US rank
- #18210
Category grades
Schools grade is shown separately in the Schools card above.
Census & demographics
- Population (ZIP)
- 1,154
Population outlook (Somerset County) Hauer SSP2
- Today (2025)
- 48,335 people
- By 2030
- 46,268 · -4.3%
- By 2040
- 41,276 · -14.6%
- By 2050
- 36,137 · -25.2%
- By 2075
- 26,408 · -45.4%
- By 2100
- 18,836 · -61.0%
Race, ethnicity, and origin ACS 2023
- Neighborhood character
- Predominantly White (96%)
- Race & ethnicity
- White 96% Two or more races 2%
- Common ancestry
- Slovak 8% Lithuanian 8% Serbian 4%
- Foreign-born
- 3% · Canada, China
- Languages at home
- 98% English-only · French/Haitian/Cajun 1%
Political lean MEDSL · Somerset
- 2024 margin
- Strong R (+27.1) · D 35.6% · R 62.7% · Other 1.7%
- 2008→2024 swing
- -32.8pp toward R · 2008: 5.7pp · 2024: -27.1pp
- All cycles
- 2024: R+27.1 2020: R+23.4 2016: R+22.8 2012: D+1.7 2008: D+5.7
Not yet ingested
- Civics
- —
Market trends
- HPI YoY
- ▲ 8.00%
- Current HPI
- 182.5242
- Rent YoY
- —
- Metro
- —
- State GDP YoY
- —
- F500 in state
- 0
Price history
+41.7% since first listed7 events — show timeline
- 2026-04-28 Pending — MREIS
- 2026-04-24 Listed $85,000 MREIS
- 2026-04-16 Price Changed $71,500 MREIS
- 2026-04-10 Price Changed $73,000 MREIS
- 2024-06-14 Sold (MLS) $35,000 MREIS
- 2024-06-08 Pending — MREIS
- 2024-05-31 Listed $60,000 MREIS
Property tax history
+8.1%/yrLatest (2025): $571 · +27.2% YoY. Source: county tax records.
Cash-flow waterfall
monthlySold comps — $/sqft
last 12 mo · ≤1 miLoading sold comps…