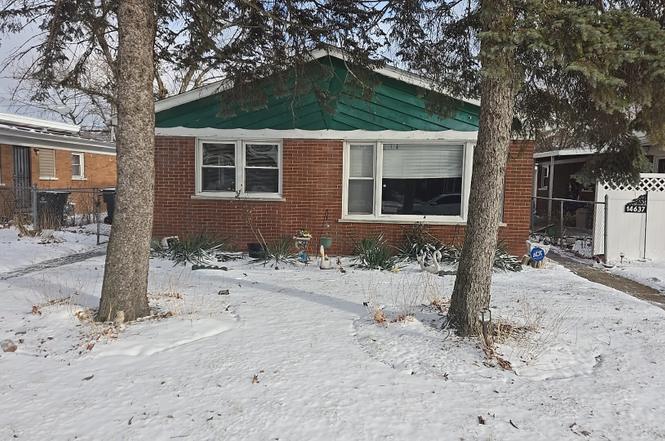
14633 Wabash Ave · Dolton, IL
Flood risk 1/10 · Minimal
- FEMA flood zone
- X (unshaded)
- Chance of flooding over 30 yrs
- 0.0%
- Est. flood insurance / yr
- $473 – $860
Fire risk 1/10 · Minimal
- Est. fire insurance / yr
- $804 – $1,492
Heat risk 3/10 · Minor
- Hot days now (above 101°F)
- 7 days/yr
- Hot days in 30 yrs
- 15 days/yr
Wind risk 2/10 · Minimal
- Chance of severe wind over 30 yrs
- —
Air-quality risk 4/10 · Minor
- Unhealthy air days now
- 4 days/yr
- Unhealthy air days in 30 yrs
- 5 days/yr
Risk factors via First Street. Map © Google.
Why this score? — see what drove the B+ grade
The composite is a weighted blend of 9 inputs, each scored 0–100. Each bar is that input's sub-score; the figure is the points it added to the 100-point composite (weight × sub-score).
- Cash flow +30.0/30.0
- ARV discount +15.0/15.0
- 1% rule +10.0/10.0
- DSCR +10.0/10.0
- Rent growth +4.9/5.0
- Livability +3.7/5.0
- Condition / age +2.5/5.0
- Schools +0.7/10.0
- Appreciation +0.0/10.0
$104,900
🖨 Deal sheet 📄 Offer letter ✓ Due diligence
Listing remarks MLS
THIS WONDERFULLY REHABBED THREE BEDROOM BRICK/ SIDED BI-LEVEL IS READY FOR YOU!! HAS NEWLY REFINISHED HARDWOOD FLOORS, NEW SECURITY DOORS, C/A, NEW HOT WATER TANK, NEW WINDOWS, NEW BERBER IN LL, NEW KITCHEN & BATHS W/GORGEOUS CERAMIC TILE, & MUCH MORE!! YOU MUST SEE THIS BEAUTY!! BUYER'S INFO & CERTIFIED EM REQUIRED. MAY ASSIST W/CC. ALSO, STOVE/FRIDGE.
Key facts
- Built 1958
- Listed 89 days
Neighborhood map
What this means for you Summary
Snapshot
- This is a 3-bed/1.5-bath single-family listed at $105k.
Deal economics
- At list price, monthly cash flow is $711 ($9k/yr) — positive.
- The deal already cash-flows at list — no discount required.
- Meets the 1% rule at list price ($2k rent vs $105k).
- Recommended offer: $99k (6.0% below list) — sets the bar for market timing.
- Cap rate 14.4% vs local median 9.3% in Dolton — top-decile yield for the area; either an underpriced asset or a hidden risk that comps aren't pricing in. Stress-test before assuming the spread holds.
Location & tenants
- Location reads 74/100 on livability (#263 in IL, #4,883 nationally) — a middle-class / working-renter tenant base. Strengths: commute A+, cost of living A+, housing A+; Watch: employment C-, health & safety C-, schools F.
- Thornton Twp Hsd 205 (suburban): math 7% / reading 8% proficiency, ranked #594 of 620 in IL (top 96%) — low school quality limits family demand, transient renter base, plan for 1-2y turnover.
- Market conditions: Rents rising fast (+9.7%/yr); 130 active listings in the ZIP; 16 comparable units currently listed for rent nearby; rentals at typical pace (median 25d on market — plan ~3-4 weeks tenant-placement turnaround); 6,272 units permitted in Cook County in 2024 (4,658 in 5+ unit buildings).
- At $2,184/mo this rent would consume 45% of the median local household income ($58k/yr) (locally 919% of renters already pay >50% of income on rent) — very limited rent-growth headroom before tenants either downsize or default.
Forward outlook
- Local home prices are declining (-3.0%/yr); year-one equity from $725 of loan paydown is wiped out by about $3k of value loss. Plan a longer hold.
- At projected returns (-3.0% appreciation + 8.0% rent growth), your $29k cash investment doubles in ~4 years — after that, you're playing with house money.
Negotiation context
- It's been on market 89 days — a 6% lower offer ($99k) is reasonable based on typical stale-listing flexibility.
- 3 sale attempts since 20y ago with the ask held roughly flat each time — persistent listings suggest the price (not the market) is what's stuck; bring a comps-based counter.
Risks & watch-outs
- Watch-outs: property tax is 4.8% of price; built in 1958 — expect roof / HVAC / electrical / plumbing capex.
Questions for the listing agent
- It's been on market 89 days. Have you received any prior offers? Is the seller open to a 6% concession, seller financing, or rate buy-down credit?
- Built in 1958 — when were the roof, HVAC, electrical panel, plumbing, and water heater last replaced?
- Property tax is high relative to price — has the assessment been appealed recently, and will the sale trigger a re-assessment?
- Why hasn't it sold? Are there any deal-killer items the seller is aware of (foundation, flood, title, zoning, code violations)?
- Is there a deadline driving the sale (1031 exchange, divorce, estate, relocation)? That informs how much negotiation room exists.
- Schools are F-rated, which usually means shorter tenancies and higher turnover. Who's the typical renter profile here, and what's been the actual vacancy rate?
- Crime grade is D in this area — have there been break-ins, vandalism, or insurance claims at this property in the last 3 years? What carrier currently insures it and at what premium?
- What's the average days-on-market for RENTAL listings here right now (not sales)? A rising rental-DOM trend means longer vacancies and softer asking-rent achievability than the comps imply.
- What's the recent tenant-quality profile in this submarket — average credit score on applications, eviction rate, late-payment / NSF rate, and stable-employment percentage? A property-management company in the area should have these aggregated.
- How much new for-sale + rental construction is in the pipeline within 1–3 miles? Heavy new supply typically softens prices + rents 12–24 months out; constrained supply supports both.
Investment metrics
- 1% rule
- 2.08% ✓
- Cap rate
- 14.42%
- Cash-on-cash
- 29.03%
- DSCR
- 2.29
- GRM
- 4.0
CMA / ARV
- ARV (on-the-fly)
- $149,678
- Comps found
- 12
Show comp detail 12 sales within ~0.75 mi
| Address | Dist | Beds/Ba | Sqft | Sold | Price | $/sf | Match |
|---|---|---|---|---|---|---|---|
| 14525 S Michigan Ave | 0.15mi | 3/1.0 | 1,200 (+7%) | 2mo | $190,000 | $158 | 77 |
| 14633 Wabash Ave | 0.00mi | 3/7.0 | 1,150 (+3%) | 1mo | $95,000 | $83 | 74 |
| 15061 Wabash Ave | 0.58mi | 3/1.5 | 1,116 (-0%) | 2mo | $150,000 | $134 | 71 |
| 14234 S Michigan Ave | 0.49mi | 3/1.0 | 1,102 (-1%) | 3mo | $114,000 | $103 | 71 |
| 302 W 145th St | 0.51mi | 3/2.0 | 1,087 (-3%) | 1mo | $250,000 | $230 | 69 |
| 201 E 143rd St | 0.48mi | 4/2.0 (+1) | 1,129 (+1%) | 0mo | $95,000 | $84 | 68 |
| 523 E 149th St | 0.70mi | 3/1.5 | 1,143 (+2%) | 2mo | $80,000 | $70 | 62 |
| 14619 Martin Luther King Jr Dr | 0.69mi | 3/1.0 | 1,153 (+3%) | 2mo | $163,000 | $141 | 58 |
| 14135 S La Salle St | 0.66mi | 3/1.5 | 1,210 (+8%) | 1mo | $60,000 | $50 | 55 |
| 14231 S State St | 0.50mi | 2/1.0 (-1) | 1,000 (-10%) | 0mo | $145,000 | $145 | 52 |
| 506 E 144th St | 0.67mi | 3/1.0 | 1,020 (-9%) | 2mo | $48,500 | $48 | 51 |
| 14825 Perry Ave | 0.74mi | 4/2.0 (+1) | 1,014 (-9%) | 1mo | $200,000 | $197 | 43 |
Match score weights: distance 35% · size 25% · config 20% · recency 20%. Top-matched comps best support the ARV.
Projected returns pro-forma
-3.0% appreciation · 8.0% rent growth · sell at horizon
- IRR
- 30.1%
- Equity multiple
- 2.36×
- Total profit
- $40,019
- Equity at exit
- $15,641
- IRR
- 40.6%
- Equity multiple
- 5.99×
- Total profit
- $146,530
- Equity at exit
- $9,070
Cash invested: $29,372 (down + closing). Projections, not guarantees.
Landlord ↔ Tenant lean methodology
- Overall (STATE)
- 43 Moderately Tenant-Leaning
- State Illinois
- 43 Moderately Tenant-Leaning · D+7
- County
- — inherits STATE
- City
- — inherits STATE
ZIP-level market 60419
- Home prices YoY
- -25.7%
- Rents YoY
- 9.7%
- Active inventory
- 130
- Price-to-rent
- 4.0×
Monthly cashflow live
- Estimated rent
- $2,184 high interval (Pro) →
- Mortgage (P&I)
- −$550
- Tax from tax record
- −$421 /mo · $5,054/yr
- Insurance
- −$44
- HOA
- −$0
- Vacancy / Maint / Mgmt
- −$459
- Net cashflow
- $711
Break-even live
UW: 25.0% down · 7.5% · 30yr · 1.5% tax · 5.0% vac · 8.0% maint · 8.0% mgmt
Financing live
Cash to close
- Down payment
- $26,225
- Closing costs
- $3,147
- Reserves months
- —
- Total cash needed
- —
Loan-product check · same deal, 3 products live
Conventional
25% down · 7.5% · 30yr
- Down + closing
- —
- Monthly P&I
- —
- Monthly cashflow
- —
- DSCR
- —
- Eligible?
- —
Personal DTI + credit; lowest rate.
DSCR
20% down · 8.5% · 30yr
- Down + closing
- —
- Monthly P&I
- —
- Monthly cashflow
- —
- DSCR
- —
- Eligible?
- —
No personal income docs; deal must DSCR.
Hard money
10% down · 12.0% · 12mo
- Down + closing
- —
- Monthly P&I
- —
- Monthly cashflow
- —
- DSCR
- —
- Eligible?
- —
Short-term bridge; refi at stabilization.
Rent comps 16 comps
| Address | Beds | Baths | Sqft | Rent | $/sqft | DOM | Units | Dist |
|---|---|---|---|---|---|---|---|---|
| 14844 Wabash Ave Dolton, IL | 3.0 | 1.5 | 1277 | $2,320 | $1.82 | 25d | 1 | 0.30mi |
| 14124 Manor Ave Dolton, IL | 3.0 | 2.0 | 1440 | $2,390 | $1.66 | 25d | 1 | 0.71mi |
| 14101 S Atlantic Ave Riverdale, IL | 2.0 | 1.0 | 790 | $1,140 | $1.44 | 8d | 1 | 0.76mi |
| 14015 S Stewart Ave Unit 2W Riverdale, IL | 2.0 | 1.0 | 800 | $1,400 | $1.75 | 25d | 1 | 0.94mi |
| 15238 Doctor Martin Luther King Junior Dr Unit 2W Dolton, IL | 2.0 | 1.0 | 800 | $1,500 | $1.88 | 11d | 1 | 1.04mi |
| 14305 Irving Ave Unit 2 Dolton, IL | 3.0 | 1.0 | 1100 | $2,200 | $2.00 | 25d | 1 | 1.04mi |
| 14817 Champlain Ave Dolton, IL | 2.0 | 1.0 | 980 | $2,430 | $2.48 | 22d | 1 | 1.05mi |
| 13810 S La Salle St #1 Riverdale, IL | 3.0 | 1.0 | 800 | $1,550 | $1.94 | 2d | 1 | 1.07mi |
| 13841 Forest Ave Dolton, IL | 3.0 | 1.0 | 930 | $1,895 | $2.04 | 25d | 1 | 1.10mi |
| 14916 Langley Ave Dolton, IL | 3.0 | 1.5 | 1418 | $2,500 | $1.76 | 25d | 1 | 1.12mi |
| 13708 S Wentworth Ave Riverdale, IL | 3.0 | 1.5 | 1500 | $2,200 | $1.47 | 22d | 1 | 1.20mi |
| 14500 Cottage Grove Ave Unit 3 Dolton, IL | 2.0 | 1.0 | 1000 | $1,475 | $1.48 | 25d | 1 | 1.20mi |
| 13604 S Wentworth Ave Riverdale, IL | 3.0 | 1.0 | 1100 | $1,200 | $1.09 | 25d | 1 | 1.32mi |
| 15509 Park Ln South Holland, IL | 4.0 | 1.5 | 1200 | $3,400 | $2.83 | 8d | 1 | 1.42mi |
| 15509 Park Ln South Holland, IL | 4.0 | 1.5 | 1200 | $3,400 | $2.83 | 25d | 1 | 1.42mi |
| 724 W 138th St Unit 3 Riverdale, IL | 2.0 | 1.0 | 800 | $1,250 | $1.56 | 19d | 1 | 1.43mi |
Listing history 10 events
-
2026-04-20status Pending
-
2026-03-10price $104,900
-
2026-01-21$109,900 Active
-
2025-01-28historical
-
2024-08-19Active
-
2007-01-31soldstatus $150,000
-
2007-01-09soldstatus $149,900 367-char remark
Show marketing remark (367 chars)
THIS WONDERFULLY REHABBED THREE BEDROOM BRICK/ SIDED BI-LEVEL IS READY FOR YOU!! HAS NEWLY REFINISHED HARDWOOD FLOORS, NEW SECURITY DOORS, C/A, NEW HOT WATER TANK, NEW WINDOWS, NEW BERBER IN LL, NEW KITCHEN & BATHS W/GORGEOUS CERAMIC TILE, & MUCH MORE!! YOU MUST SEE THIS BEAUTY!! BUYER'S INFO & CERTIFIED EM REQUIRED. MAY ASSIST W/CC. ALSO, STOVE/FRIDGE.
-
2006-12-27historical 367-char remark
Show marketing remark (367 chars)
THIS WONDERFULLY REHABBED THREE BEDROOM BRICK/ SIDED BI-LEVEL IS READY FOR YOU!! HAS NEWLY REFINISHED HARDWOOD FLOORS, NEW SECURITY DOORS, C/A, NEW HOT WATER TANK, NEW WINDOWS, NEW BERBER IN LL, NEW KITCHEN & BATHS W/GORGEOUS CERAMIC TILE, & MUCH MORE!! YOU MUST SEE THIS BEAUTY!! BUYER'S INFO & CERTIFIED EM REQUIRED. MAY ASSIST W/CC. ALSO, STOVE/FRIDGE.
-
2006-10-16$149,900 367-char remark
Show marketing remark (367 chars)
THIS WONDERFULLY REHABBED THREE BEDROOM BRICK/ SIDED BI-LEVEL IS READY FOR YOU!! HAS NEWLY REFINISHED HARDWOOD FLOORS, NEW SECURITY DOORS, C/A, NEW HOT WATER TANK, NEW WINDOWS, NEW BERBER IN LL, NEW KITCHEN & BATHS W/GORGEOUS CERAMIC TILE, & MUCH MORE!! YOU MUST SEE THIS BEAUTY!! BUYER'S INFO & CERTIFIED EM REQUIRED. MAY ASSIST W/CC. ALSO, STOVE/FRIDGE.
-
1989-11-15soldstatus $62,000
ⓘ Source: listings_history table (triggers on properties + properties_extension) + one-shot
backfill from property_details.listing_events for pre-trigger history.
Tax reassessment forecast IL · Partial reset (capped growth)
- Current annual tax
- $5,054 · $421/mo
- Projected year-2 tax
- $5,054 · $421/mo
- Expected delta
- $0/yr ($0/mo · 0.0%)
ⓘ Screening estimate from a state-policy table — verify with the county assessor before closing.
Climate risk First Street
- Flood 1/10 Low FEMA zone X (unshaded) · 0% chance over 30 yrs
- Wildfire 1/10 Low
- Heat 3/10 Moderate 7 d/yr ≥101°F today · 15 d/yr by 30 yrs out
- Wind 2/10 Low
- Air quality 4/10 Moderate 4 unhealthy d/yr today · 5 by 30 yrs out
Nearby sold comps map
Loading sold comps map…
Walkable amenities ~0.75 mi
Loading nearby amenities…
Taxation est. · year 1
- Rental income
- $26,212
- − Mortgage interest
- −$5,876
- − Property taxes
- −$5,054
- − Insurance
- −$524
- − Repairs & maintenance
- −$2,097
- − Management
- −$2,097
- − Depreciation
- −$3,052
- Taxable income
- $7,512
- Est. tax owed @ 24.0%
- −$1,803
- After-tax cash flow
- $6,725/yr
For passive investors: Depreciation is non-cash, so a rental often shows a tax loss while cash-flowing — sheltering income. Rental losses are passive: they offset passive income freely, and up to $25,000/yr can offset ordinary (W-2) income if you actively participate and your MAGI is under $100k (phasing out to $0 by $150k); unused losses carry forward. On sale, claimed depreciation is recaptured at up to 25%, and gains may owe capital-gains tax (a 1031 exchange can defer both). Figures are a year-1 estimate at your 24.0% rate — not tax advice; consult a CPA.
Schools (NCES district)
- District
- Thornton Twp Hsd 205
- NCES district ID
- 1738970
- Math proficiency
- 7% ▬ 0.00%
- Reading proficiency
- 8% ▼ -2.00%
- Median HH income
- $43,392
- Composite
- 6.92/100
- National rank
- #9976
- State rank
- #594 of 620 in IL
Livability — Dolton
- Score
- 74/100
- State rank
- #263
- US rank
- #4883
Category grades
Schools grade is shown separately in the Schools card above.
Census & demographics
- Census place
- Dolton, IL
- County
- Cook County · 4,486,803 people
- City population
- 20,825
- Metro
- Chicago-Naperville-Elgin, IL-IN-WI
- Population (ZIP)
- 20,825
- Household income
- $57,887
- Rent vs Own
- Severe rent burden
- 919.0
Population outlook (Cook County) Hauer SSP2
- Today (2025)
- 5,347,519 people
- By 2030
- 5,357,703 · +0.2%
- By 2040
- 5,324,924 · -0.4%
- By 2050
- 5,230,762 · -2.2%
- By 2075
- 4,785,735 · -10.5%
- By 2100
- 4,188,836 · -21.7%
Race, ethnicity, and origin ACS 2023
- Neighborhood character
- Predominantly Black (91%)
- Race & ethnicity
- Black 91% White 4% Two or more races 3% Hispanic / Latino 1%
- Common ancestry
- Romanian 1% Hispanic 1%
- Foreign-born
- 3% · Canada
- Languages at home
- 95% English-only · French/Haitian/Cajun 2% Spanish 1%
Political lean MEDSL · Cook
- 2024 margin
- Solid D (+42.0) · D 70.4% · R 28.4% · Other 1.2%
- 2008→2024 swing
- -11.4pp toward R · 2008: 53.4pp · 2024: 42.0pp
- All cycles
- 2024: D+42.0 2020: D+50.3 2016: D+53.0 2012: D+49.4 2008: D+53.4
Not yet ingested
- Civics
- —
Market trends
- HPI YoY
- ▼ -66.88%
- Current HPI
- 193.2346
- Rent YoY
- ▲ 9.65%
- Metro
- Chicago-Naperville-Elgin, IL-IN-WI
- State GDP YoY
- ▲ 1.59%
- F500 in state
- 60
Industry mix (Fortune 500 HQ in IL)
| Industry | F500 HQs | Revenue |
|---|---|---|
| Insurance | 4 | $201B |
|
||
| Consumer Goods | 4 | $87B |
|
||
| Industrial Machinery | 3 | $64B |
|
||
| Healthcare | 2 | $55B |
|
||
| Retail / Pharmacy | 1 | $148B |
|
||
| Agriculture / Food | 1 | $86B |
|
||
Price history
+69.2% since first listed10 events — show timeline
- 2026-04-20 Pending — MRED as Distributed by MLS Grid
- 2026-03-10 Price Changed $104,900 MRED as Distributed by MLS Grid
- 2026-01-21 Listed $109,900 MRED as Distributed by MLS Grid
- 2025-01-28 Listing Removed — MRED as Distributed by MLS Grid
- 2024-08-19 Listed — MRED as Distributed by MLS Grid
- 2007-01-31 Sold (Public Records) $150,000 Public Records
- 2007-01-09 Sold (MLS) $149,900 MRED as Distributed by MLS Grid
- 2006-12-27 Listing Removed — MRED as Distributed by MLS Grid
- 2006-10-16 Listed $149,900 MRED as Distributed by MLS Grid
- 1989-11-15 Sold (Public Records) $62,000 Public Records
Property tax history
+2.8%/yrLatest (2023): $5,054 · +290.1% YoY. Source: county tax records.
Cash-flow waterfall
monthlySold comps — $/sqft
last 12 mo · ≤1 miLoading sold comps…