21070 US Rt 52 · Rome (Stout), OH
Flood risk 8/10 · Major
- FEMA flood zone
- X (unshaded)
- Chance of flooding over 30 yrs
- 0.99%
- Est. flood insurance / yr
- $507 – $1,088
Fire risk 2/10 · Minimal
- Est. fire insurance / yr
- $713 – $1,323
Heat risk 4/10 · Minor
- Hot days now (above 102°F)
- 7 days/yr
- Hot days in 30 yrs
- 20 days/yr
Wind risk 2/10 · Minimal
- Chance of severe wind over 30 yrs
- 2.0%
Air-quality risk 2/10 · Minimal
- Unhealthy air days now
- 0 days/yr
- Unhealthy air days in 30 yrs
- 1 days/yr
Risk factors via First Street. Map © Google.
Why this score? — see what drove the D+ grade
The composite is a weighted blend of 9 inputs, each scored 0–100. Each bar is that input's sub-score; the figure is the points it added to the 100-point composite (weight × sub-score).
- Cash flow +13.0/30.0
- ARV discount +7.5/15.0
- Appreciation +6.8/10.0
- DSCR +3.9/10.0
- Schools +3.8/10.0
- 1% rule +2.8/10.0
- Rent growth +2.5/5.0
- Livability +2.5/5.0
- Condition / age +2.5/5.0
$132,900
🖨 Deal sheet (PDF) 📄 Offer letter ✓ Due diligence
Listing remarks
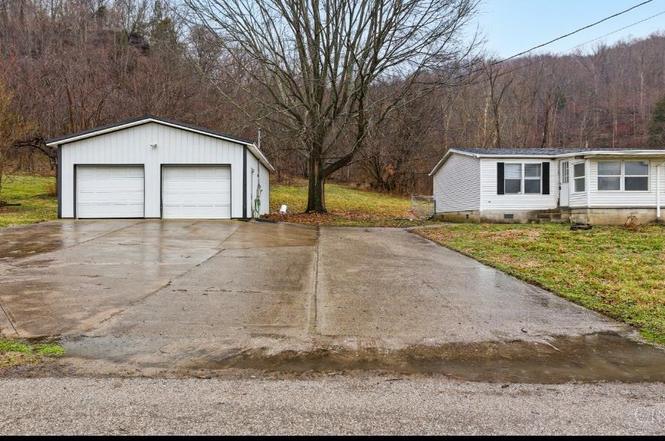
Charming 2 bed, 1 bath manufactured home with an attached enclosed porch that adds additional living and relaxation space. The standout feature is the oversized detached garage with room for 2-4 vehicles, making it ideal for car enthusiasts, storage, or a workshop. A great property offering both functionality and convenience.
Key facts
- 2.63 acre lot
- 2 garage spots
- Built 1994
Tags
Property features AI
Finance
- Other: Residential zoning; Lot is less than 0.5 acre
- HOA & community: No homeowners association
Exterior
- Parking: Detached garage with 2 garage spaces; Driveway parking
- Utilities: Public water; Public sewer; Electric service
- Home design: Manufactured single-family home; Traditional style; One story
- Construction: Vinyl siding; Shingle roof; Other foundation
- Exterior features: Porch; Barn on property; Vinyl windows
Interior
- Kitchen: Vinyl flooring in kitchen; Kitchen approx. 13 x 13; Appliances included: Dishwasher, Oven/Range, Refrigerator
- Bedrooms: Two bedrooms on the main level (Primary: 13 x 10; Second: 13 x 9)
- Flooring: Vinyl flooring in kitchen
- Bathrooms: One full bathroom on the main level
- Heating & cooling: Heat pump; Electric water heater
- Interior features: Five total rooms; Porch
- Laundry & utility: Main-level laundry room (approx. 7 x 7); Washer and Dryer included
Neighborhood map
What this means for you Summary
Snapshot
- This is a 2-bed/1.0-bath single-family listed at $133k.
Deal economics
- At list price, monthly cash flow is $-75 ($-897/yr) — negative.
- To cash-flow at today's rent, offer at most $120k (9.9% below list).
- To meet the 1% rule (rent ≥ 1% of price), the offer needs to be $104k (22.0% below list).
- Recommended offer: $104k (22.0% below list) — sets the bar for 1% rule.
Location & tenants
- Location reads: area grade D — affects rentability + tenant quality, not the cash-flow math above.
- Manchester Local (rural): math 38% / reading 55% proficiency, ranked #497 of 656 in OH (top 76%) — families likely to look elsewhere, expect single-tenant / working-renter base with shorter leases; 67% free/reduced lunch — lower-income household profile, screen leases tightly.
- Market conditions: 3 active listings in the ZIP; 42 units permitted in Adams County in 2024 (0 in 5+ unit buildings).
Forward outlook
- In year one you build about $6k of equity ($919 loan paydown + $5k appreciation (3.6% local appreciation)).
- Adams County population projected at -23% by 2050 — secular population decline; favor cash flow + early exit over multi-decade hold.
- At projected returns (3.6% appreciation + 3.0% rent growth), your $37k cash investment doubles in ~7 years — after that, you're playing with house money.
- By year 6, paydown + projected appreciation supports a ~$30k cash-out refi (75% LTV) — recoverable capital for the next deal without selling this one.
Negotiation context
- It's been on market 105 days — a 9% lower offer ($121k) is reasonable based on typical stale-listing flexibility.
- 3 sale attempts since 6y ago with the ask held roughly flat each time — persistent listings suggest the price (not the market) is what's stuck; bring a comps-based counter.
- Current owner paid $33k; list at $133k implies a 303% gain — meaningful room to come down on a strong offer.
Risks & watch-outs
- Watch-outs: flood insurance adds $66/mo.
- Climate carrying-cost: severe flood risk — expect insurance premiums to compound above CPI over the hold.
Questions for the listing agent
- What do current leases actually rent for vs. the listed asking? Can we see a recent rent roll and the last 12 months of T-12 income?
- It's been on market 105 days. Have you received any prior offers? Is the seller open to a 22% concession, seller financing, or rate buy-down credit?
- What's the actual annual flood-insurance premium (NFIP or private), and is the property in a SFHA with mandatory coverage?
- Why hasn't it sold? Are there any deal-killer items the seller is aware of (foundation, flood, title, zoning, code violations)?
- Is there a deadline driving the sale (1031 exchange, divorce, estate, relocation)? That informs how much negotiation room exists.
- The area grade is low — what's the realistic commute time and amenity access for the typical tenant pool here? Any planned neighborhood developments (good or bad) we should know about?
- What's the average days-on-market for RENTAL listings here right now (not sales)? A rising rental-DOM trend means longer vacancies and softer asking-rent achievability than the comps imply.
- What's the recent tenant-quality profile in this submarket — average credit score on applications, eviction rate, late-payment / NSF rate, and stable-employment percentage? A property-management company in the area should have these aggregated.
- How much new for-sale + rental construction is in the pipeline within 1–3 miles? Heavy new supply typically softens prices + rents 12–24 months out; constrained supply supports both.
Investment metrics
- 1% rule
- 0.78% ✗
- Cap rate
- 6.22%
- Cash-on-cash
- -0.27%
- DSCR
- 0.99
- GRM
- 10.7
CMA / ARV
No comps found within radius.
Projected returns pro-forma
3.58% appreciation · 3.0% rent growth · sell at horizon
- IRR
- 6.9%
- Equity multiple
- 1.41×
- Total profit
- $15,337
- Equity at exit
- $64,109
- IRR
- 9.5%
- Equity multiple
- 2.51×
- Total profit
- $56,352
- Equity at exit
- $102,324
Cash invested: $37,212 (down + closing). Projections, not guarantees.
Landlord ↔ Tenant lean methodology
- Overall (STATE)
- 73 Landlord-Friendly
- State Ohio
- 73 Landlord-Friendly · R+6
- County
- — inherits STATE
- City
- — inherits STATE
ZIP-level market 45684
- Home prices YoY
- 1.9%
- Active inventory
- 3
- Price-to-rent
- 10.7×
Monthly cashflow live
- Estimated rent
- $1,037 medium interval (Pro) →
- Mortgage (P&I)
- −$697
- Tax from tax record
- −$75 /mo · $899/yr
- Insurance
- −$55
- Flood insurance flood zone
- −$66 /mo · $798/yr
- HOA
- −$0
- Vacancy / Maint / Mgmt
- −$218
- Net cashflow
- $-75
Break-even live
Sensitivity live
| Price | -10% $0 | -5% $-37 | +0% $-75 | +5% $-112 | +10% $-150 |
|---|---|---|---|---|---|
| Rent | -10% $-157 | -5% $-116 | +0% $-75 | +5% $-34 | +10% $7 |
| Rate | -1.0pp $-8 | -0.5pp $-41 | base $-75 | +0.5pp $-109 | +1.0pp $-144 |
UW: 25.0% down · 7.5% · 30yr · 1.5% tax · 5.0% vac · 8.0% maint · 8.0% mgmt
Financing live
Cash to close
- Down payment
- $33,225
- Closing costs
- $3,987
- Reserves months
- —
- Total cash needed
- —
Loan-product check · same deal, 3 products live
Conventional
25% down · 7.5% · 30yr
- Down + closing
- —
- Monthly P&I
- —
- Monthly cashflow
- —
- DSCR
- —
- Eligible?
- —
Personal DTI + credit; lowest rate.
DSCR
20% down · 8.5% · 30yr
- Down + closing
- —
- Monthly P&I
- —
- Monthly cashflow
- —
- DSCR
- —
- Eligible?
- —
No personal income docs; deal must DSCR.
Hard money
10% down · 12.0% · 12mo
- Down + closing
- —
- Monthly P&I
- —
- Monthly cashflow
- —
- DSCR
- —
- Eligible?
- —
Short-term bridge; refi at stabilization.
Listing history 22 events
-
2026-06-18days on market $132,900 Active 105 DOM
-
2026-06-17days on market $132,900 Active 104 DOM
-
2026-06-16days on market $132,900 Active 103 DOM
-
2026-06-15days on market $132,900 Active 102 DOM
-
2026-06-14days on market $132,900 Active 100 DOM
-
2026-06-10days on market $132,900 Active 97 DOM
-
2026-06-09days on market $132,900 Active 96 DOM
-
2026-06-08days on market $132,900 Active 95 DOM
-
2026-06-07days on market $132,900 Active 94 DOM
-
2026-06-03days on market $132,900 Active 90 DOM
-
2026-06-02days on market $132,900 Active 89 DOM
-
2026-06-01days on market $132,900 Active 88 DOM
-
2026-05-31days on market $132,900 Active 87 DOM
-
2026-05-31days on market $132,900 Active 86 DOM
-
2026-03-05$132,900 Active
-
2021-01-13historical Contingency Pending
-
2021-01-11historical
-
2020-11-23price $59,900
-
2020-10-06status Active
-
2020-09-27historical Contingency Pending
-
2020-09-14$65,000 Active
-
2003-07-17soldstatus $33,000
ⓘ Source: listings_history table (triggers on properties + properties_extension) + one-shot
backfill from property_details.listing_events for pre-trigger history.
Tax reassessment forecast OH · Partial reset (capped growth)
- Current annual tax
- $899 · $75/mo
- Projected year-2 tax
- $1,486 · $124/mo
- Expected delta
- +$587/yr (+$49/mo · 65.3%)
ⓘ Screening estimate from a state-policy table — verify with the county assessor before closing.
Climate risk First Street
- Flood 8/10 Severe FEMA zone X (unshaded) · 99% chance over 30 yrs
- Wildfire 2/10 Low
- Heat 4/10 Moderate 7 d/yr ≥102°F today · 20 d/yr by 30 yrs out
- Wind 2/10 Low 2% chance of damaging wind over 30 yrs
- Air quality 2/10 Low 0 unhealthy d/yr today · 1 by 30 yrs out
Nearby sold comps map
Loading sold comps map…
Walkable amenities ~0.75 mi
Loading nearby amenities…
Taxation est. · year 1
- Rental income
- $12,439
- − Mortgage interest
- −$7,444
- − Property taxes
- −$899
- − Insurance
- −$1,462
- − Repairs & maintenance
- −$995
- − Management
- −$995
- − Depreciation
- −$3,866
- Taxable loss
- −$3,223
- Est. tax savings @ 24.0%
- +$773
- After-tax cash flow
- $-124/yr
For passive investors: Depreciation is non-cash, so a rental often shows a tax loss while cash-flowing — sheltering income. Rental losses are passive: they offset passive income freely, and up to $25,000/yr can offset ordinary (W-2) income if you actively participate and your MAGI is under $100k (phasing out to $0 by $150k); unused losses carry forward. On sale, claimed depreciation is recaptured at up to 25%, and gains may owe capital-gains tax (a 1031 exchange can defer both). Figures are a year-1 estimate at your 24.0% rate — not tax advice; consult a CPA.
Schools (NCES district)
- District
- Manchester Local
- NCES district ID
- 3900537
- Math proficiency
- 38% ▼ -20.00%
- Reading proficiency
- 55% ▼ -10.00%
- Median HH income
- $33,374
- Composite
- 38.23/100
- National rank
- #4246
- State rank
- #497 of 656 in OH
Livability — Rome (Stout)
No livability data for this city. (Only ~50 U.S. cities are tracked.)
Census & demographics
- Census place
- Rome (Stout), OH
- County
- Adams · 32,832 people
- Population (ZIP)
- 1,577
- Household income
- $52,000
- Rent vs Own
- Severe rent burden
- 1.1
Population outlook (Adams County) Hauer SSP2
- Today (2025)
- 26,467 people
- By 2030
- 25,354 · -4.2%
- By 2040
- 22,951 · -13.3%
- By 2050
- 20,394 · -22.9%
- By 2075
- 14,824 · -44.0%
- By 2100
- 9,909 · -62.6%
Race, ethnicity, and origin ACS 2023
- Neighborhood character
- Predominantly White (100%)
- Race & ethnicity
- White 100%
- Common ancestry
- Iranian 3% Lithuanian 2% Serbian 2%
Political lean MEDSL · Adams
- 2024 margin
- Solid R (+65.7) · D 16.9% · R 82.6%
- 2008→2024 swing
- -41.6pp toward R · 2008: -24.1pp · 2024: -65.7pp
- All cycles
- 2024: R+65.7 2020: R+63.5 2016: R+55.6 2012: R+26.3 2008: R+24.1
Not yet ingested
- Civics
- —
Market trends
- HPI YoY
- ▲ 3.58%
- Current HPI
- 190.4123
- Rent YoY
- —
- Metro
- —
- State GDP YoY
- ▲ 1.98%
- F500 in state
- 48
Industry mix (Fortune 500 HQ in OH)
| Industry | F500 HQs | Revenue |
|---|---|---|
| Insurance | 3 | $145B |
|
||
| Industrial Machinery | 3 | $49B |
|
||
| Financial Services | 3 | $24B |
|
||
| Consumer Goods | 2 | $93B |
|
||
| Aerospace / Defense | 2 | $47B |
|
||
| Utilities | 2 | $33B |
|
||
Price history
+302.7% since first listed8 events — show timeline
- 2026-03-05 Listed $132,900 Cincy MLS
- 2021-01-13 Contingent — Cincy MLS
- 2021-01-11 Listing Removed — Cincy MLS
- 2020-11-23 Price Changed $59,900 Cincy MLS
- 2020-10-06 Relisted — Cincy MLS
- 2020-09-27 Contingent — Cincy MLS
- 2020-09-14 Listed $65,000 Cincy MLS
- 2003-07-17 Sold (Public Records) $33,000 Public Records
Property tax history
+9.4%/yrLatest (2025): $899 · +28.3% YoY. Source: county tax records.
Cash-flow waterfall
monthlySold comps — $/sqft
last 12 mo · ≤1 miLoading sold comps…