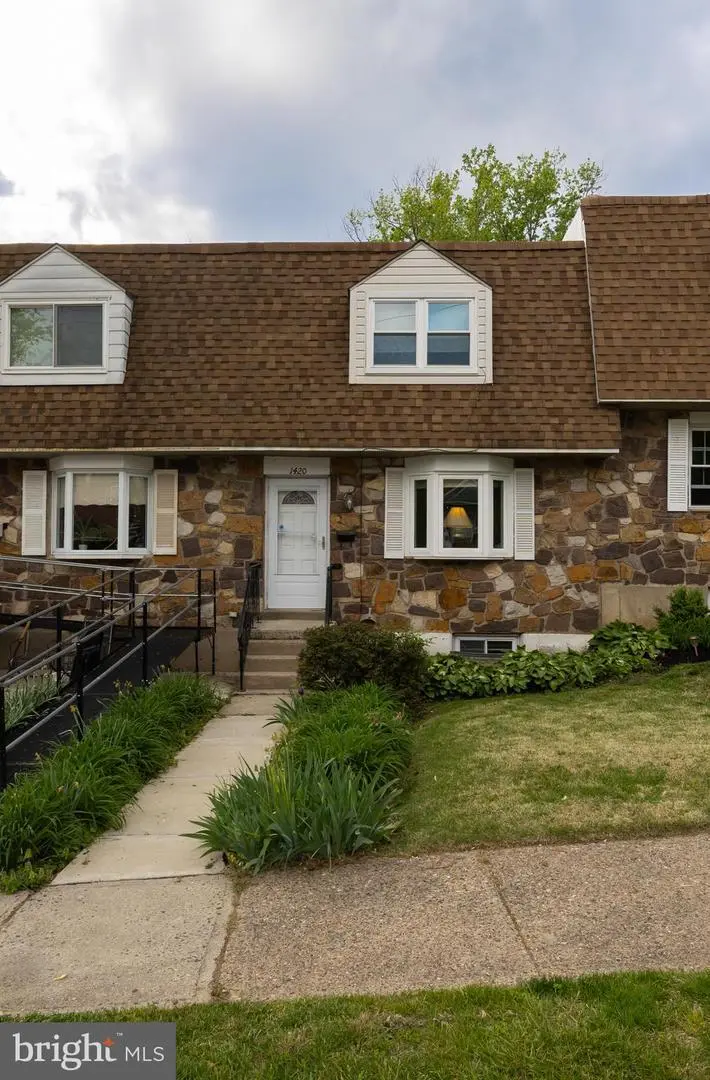
1420 Powell Rd · Upland, PA
Flood risk 4/10 · Minor
- FEMA flood zone
- X (shaded)
- Chance of flooding over 30 yrs
- 0.22%
- Est. flood insurance / yr
- $473 – $860
Fire risk 1/10 · Minimal
- Est. fire insurance / yr
- $511 – $949
Heat risk 7/10 · Major
- Hot days now (above 104°F)
- 7 days/yr
- Hot days in 30 yrs
- 15 days/yr
Wind risk 6/10 · Moderate
- Chance of severe wind over 30 yrs
- 27.0%
Air-quality risk 3/10 · Minor
- Unhealthy air days now
- 2 days/yr
- Unhealthy air days in 30 yrs
- 4 days/yr
Risk factors via First Street. Map © Google.
Why this score? — see what drove the C grade
The composite is a weighted blend of 9 inputs, each scored 0–100. Each bar is that input's sub-score; the figure is the points it added to the 100-point composite (weight × sub-score).
- Cash flow +22.1/30.0
- ARV discount +12.8/15.0
- DSCR +7.1/10.0
- 1% rule +4.8/10.0
- Livability +3.2/5.0
- Rent growth +2.5/5.0
- Condition / age +2.5/5.0
- Schools +0.8/10.0
- Appreciation +0.0/10.0
$200,000
🖨 Deal sheet 📄 Offer letter ✓ Due diligence
Listing remarks
Welcome to this well-cared-for 3 bedroom, 2 bathroom home in the Toby Farms neighborhood! Lovingly maintained by the same family for over 45 years, this home reflects true pride of ownership and offers a solid, move-in ready opportunity for its next owner. Inside, you’ll find a functional layout with comfortable living spaces, along with a finished basement that offers excellent additional living space, built-in shelving, and plenty of storage—perfect for a family room, home office, or hobby area. The home also features a garage for convenient parking and storage. Step outside to a large deck, complete with a retractable awning and beautiful wooded views, creating the perfect se
Key facts
- Large deck
- Newer roof
- Retractable awning
Tags
Property features AI
Exterior
- Parking: Basement garage with inside access and rear entry; One attached garage space plus one additional parking space (driveway); On-street parking available
- Utilities: Public water; Public sewer
- Home design: Interior townhouse/rowhouse; Fee simple ownership
- Construction: Frame construction; Concrete perimeter foundation
- Exterior features: Awning(s); Deck(s) and patio(s)
Interior
- Bedrooms: Three bedrooms on the first upper level
- Bathrooms: Two full bathrooms
- Heating & cooling: Forced air heating (natural gas); Central air conditioning (electric); Natural gas hot water
- Interior features: Fully finished basement with walkout and garage access; Living area source: Assessor
Neighborhood map
What this means for you Summary
Snapshot
- This is a 3-bed/2.0-bath townhouse listed at $200k.
Deal economics
- At list price, monthly cash flow is $323 ($4k/yr) — positive.
- The deal already cash-flows at list — no discount required.
- To meet the 1% rule (rent ≥ 1% of price), the offer needs to be $195k (2.4% below list).
- Recommended offer: $195k (2.4% below list) — sets the bar for 1% rule.
Location & tenants
- Location reads 64/100 on livability (#1,219 in PA) — a middle-class / working-renter tenant base. Strengths: cost of living A+, housing A+, health & safety A; Watch: schools F, crime F, commute F.
- Chester-Upland SD (suburban): math 4% / reading 17% proficiency, ranked #533 of 539 in PA (top 99%) — low school quality limits family demand, transient renter base, plan for 1-2y turnover; 81% free/reduced lunch — lower-income household profile, screen leases tightly.
- Market conditions: 66 active listings in the ZIP; 17 comparable units currently listed for rent nearby; rentals at typical pace (median 21d on market — plan ~3-4 weeks tenant-placement turnaround); solid renter incomes; 299 units permitted in Delaware County in 2024 (5 in 5+ unit buildings).
Forward outlook
- Local home prices are declining (-3.0%/yr); year-one equity from $1k of loan paydown is wiped out by about $6k of value loss. Plan a longer hold.
Negotiation context
- Only 5 days on market — expect competitive offers; lowballing is unlikely to land.
Risks & watch-outs
- Climate carrying-cost: major wind risk, 27% chance of damaging wind over 30y; extreme-heat days projected 7→15/yr by 2055 (HVAC capex compounding) — expect insurance premiums to compound above CPI over the hold.
Questions for the listing agent
- Built in 1967 — when were the roof, HVAC, electrical panel, plumbing, and water heater last replaced?
- Is there a deadline driving the sale (1031 exchange, divorce, estate, relocation)? That informs how much negotiation room exists.
- Schools are F-rated, which usually means shorter tenancies and higher turnover. Who's the typical renter profile here, and what's been the actual vacancy rate?
- Crime grade is F in this area — have there been break-ins, vandalism, or insurance claims at this property in the last 3 years? What carrier currently insures it and at what premium?
- What's the average days-on-market for RENTAL listings here right now (not sales)? A rising rental-DOM trend means longer vacancies and softer asking-rent achievability than the comps imply.
- What's the recent tenant-quality profile in this submarket — average credit score on applications, eviction rate, late-payment / NSF rate, and stable-employment percentage? A property-management company in the area should have these aggregated.
- How much new for-sale + rental construction is in the pipeline within 1–3 miles? Heavy new supply typically softens prices + rents 12–24 months out; constrained supply supports both.
Investment metrics
- 1% rule
- 0.98% ✗
- Cap rate
- 8.23%
- Cash-on-cash
- 6.92%
- DSCR
- 1.31
- GRM
- 8.5
CMA / ARV
- ARV (median comp)
- $226,757
- List price
- $200,000
- Delta
- -11.80%
- Verdict
- UNDERPRICED
- Comps
- 20 within 1.0 mi
Show comp detail 12 sales within ~0.75 mi
| Address | Dist | Beds/Ba | Sqft | Sold | Price | $/sf | Match |
|---|---|---|---|---|---|---|---|
| 1420 Powell Rd | 0.00mi | 3/2.0 | 1,440 (0%) | 1mo | $215,000 | $149 | 100 |
| 1412 Elson Rd | 0.20mi | 3/2.0 | 1,404 (-2%) | 1mo | $285,000 | $203 | 86 |
| 4029 Gideon Rd | 0.06mi | 3/2.0 | 1,520 (+6%) | 2mo | $155,000 | $102 | 86 |
| 3920 Elson Rd | 0.24mi | 3/2.0 | 1,520 (+6%) | 5mo | $280,000 | $184 | 75 |
| 1349 Elson Rd | 0.24mi | 3/2.5 | 1,520 (+6%) | 4mo | $230,000 | $151 | 74 |
| 3901 Elson Rd | 0.20mi | 3/2.0 | 1,560 (+8%) | 6mo | $262,000 | $168 | 72 |
| 1423 Rainer Rd | 0.25mi | 3/2.0 | 1,260 (-12%) | 0mo | $278,000 | $221 | 67 |
| 1216 Harshaw Rd | 0.25mi | 3/1.0 | 1,260 (-12%) | 1mo | $257,500 | $204 | 63 |
| 1403 Rainer Rd | 0.25mi | 3/2.0 | 1,260 (-12%) | 6mo | $184,999 | $147 | 62 |
| 1346 Rainer Rd | 0.26mi | 3/2.0 | 1,224 (-15%) | 3mo | $299,900 | $245 | 61 |
| 1227 Rainer Rd | 0.34mi | 3/2.0 | 1,224 (-15%) | 1mo | $274,000 | $224 | 58 |
| 1300 Rainer Rd | 0.30mi | 3/2.0 | 1,224 (-15%) | 4mo | $295,000 | $241 | 57 |
Match score weights: distance 35% · size 25% · config 20% · recency 20%. Top-matched comps best support the ARV.
Projected returns pro-forma
-3.0% appreciation · 3.0% rent growth · sell at horizon
- IRR
- -5.7%
- Equity multiple
- 0.79×
- Total profit
- $-11,915
- Equity at exit
- $29,821
- IRR
- 3.9%
- Equity multiple
- 1.28×
- Total profit
- $15,816
- Equity at exit
- $17,292
Cash invested: $56,000 (down + closing). Projections, not guarantees.
Landlord ↔ Tenant lean methodology
- Overall (STATE)
- 62 Landlord-Friendly
- State Pennsylvania
- 62 Landlord-Friendly · EVEN
- County
- — inherits STATE
- City
- — inherits STATE
ZIP-level market 19015
- Active inventory
- 66
- Price-to-rent
- 8.5×
Monthly cashflow live
- Estimated rent
- $1,951 high interval (Pro) →
- Mortgage (P&I)
- −$1,049
- Tax from tax record
- −$87 /mo · $1,039/yr
- Insurance
- −$83
- HOA
- −$0
- Vacancy / Maint / Mgmt
- −$410
- Net cashflow
- $323
Break-even live
UW: 25.0% down · 7.5% · 30yr · 1.5% tax · 5.0% vac · 8.0% maint · 8.0% mgmt
Financing live
Cash to close
- Down payment
- $50,000
- Closing costs
- $6,000
- Reserves months
- —
- Total cash needed
- —
Loan-product check · same deal, 3 products live
Conventional
25% down · 7.5% · 30yr
- Down + closing
- —
- Monthly P&I
- —
- Monthly cashflow
- —
- DSCR
- —
- Eligible?
- —
Personal DTI + credit; lowest rate.
DSCR
20% down · 8.5% · 30yr
- Down + closing
- —
- Monthly P&I
- —
- Monthly cashflow
- —
- DSCR
- —
- Eligible?
- —
No personal income docs; deal must DSCR.
Hard money
10% down · 12.0% · 12mo
- Down + closing
- —
- Monthly P&I
- —
- Monthly cashflow
- —
- DSCR
- —
- Eligible?
- —
Short-term bridge; refi at stabilization.
Rent comps 17 comps
| Address | Beds | Baths | Sqft | Rent | $/sqft | DOM | Units | Dist |
|---|---|---|---|---|---|---|---|---|
| 1315 Harshaw Rd Brookhaven, PA | 3.0 | 2.5 | 1260 | $2,395 | $1.90 | 1d | 1 | 0.20mi |
| 1224 Elson Rd Brookhaven, PA | 3.0 | 2.0 | 1200 | $1,900 | $1.58 | 17d | 1 | 0.27mi |
| 280 Bridgewater Rd Brookhaven, PA | 1.0–2.0 | 1.0–2.0 | 775 | $1,695 | $2.19 | 5d | 4 | 0.59mi |
| 280 Bridgewater Rd Brookhaven, PA | 1.0–2.0 | 1.0–1.5 | 775 | $1,800 | $2.32 | 24d | 2 | 0.59mi |
| 2717 Bethel Rd Chester, PA | 3.0 | 1.0 | 1785 | $1,350 | $0.76 | 5d | 1 | 0.77mi |
| 2104 N Williams Cir Chester, PA | 4.0 | 1.5 | 1540 | $1,895 | $1.23 | 43d | 1 | 0.85mi |
| 3312 W 13th St Chester, PA | 2.0 | 1.0 | 936 | $1,499 | $1.60 | 22d | 1 | 1.20mi |
| 206 W Parkway Ave Chester, PA | 2.0 | 1.0 | 1666 | $1,450 | $0.87 | 24d | 1 | 1.26mi |
| 30 W Roland Rd Brookhaven, PA | 3.0 | 1.0 | 1424 | $1,695 | $1.19 | 43d | 1 | 1.26mi |
| 2106 W 4th St Unit 2 Chester, PA | 2.0 | 1.0 | 1736 | $1,100 | $0.63 | 43d | 1 | 1.35mi |
| 45 Neeld Ln Aston, PA | 3.0 | 2.0 | 1303 | $2,900 | $2.23 | 2d | 1 | 1.38mi |
| 2832 W 6th St Unit 306 Chester, PA | 3.0 | 1.0 | 1428 | $1,500 | $1.05 | 4d | 1 | 1.38mi |
| 25 W Parkway Ave Chester, PA | 3.0 | 1.0 | 1324 | $1,600 | $1.21 | 5d | 1 | 1.40mi |
| 330 W 21st St Chester, PA | 3.0 | 1.0 | 1152 | $1,500 | $1.30 | 43d | 1 | 1.43mi |
| 425 Highland Ave Apt A Chester, PA | 2.0 | 1.5 | 990 | $1,000 | $1.01 | 20d | 1 | 1.44mi |
| 425 Highland Ave Apt A Chester, PA | 2.0 | 1.5 | 1829 | $1,000 | $0.55 | 43d | 1 | 1.44mi |
| 51 Park Valley Ln Brookhaven, PA | 2.0 | 1.5 | 990 | $1,795 | $1.81 | 18d | 1 | 1.48mi |
Listing history 2 events
-
2026-05-09status Pending 1133-char remark
-
2026-05-04$200,000 Active 1133-char remark
ⓘ Source: listings_history table (triggers on properties + properties_extension) + one-shot
backfill from property_details.listing_events for pre-trigger history.
Tax reassessment forecast PA · Partial reset (capped growth)
- Current annual tax
- $1,039 · $87/mo
- Projected year-2 tax
- $2,100 · $175/mo
- Expected delta
- +$1,060/yr (+$88/mo · 102.1%)
ⓘ Screening estimate from a state-policy table — verify with the county assessor before closing.
Climate risk First Street
- Flood 4/10 Moderate FEMA zone X (shaded) · 22% chance over 30 yrs
- Wildfire 1/10 Low
- Heat 7/10 Severe 7 d/yr ≥104°F today · 15 d/yr by 30 yrs out
- Wind 6/10 Major 27% chance of damaging wind over 30 yrs
- Air quality 3/10 Moderate 2 unhealthy d/yr today · 4 by 30 yrs out
Nearby sold comps map
Loading sold comps map…
Walkable amenities ~0.75 mi
Loading nearby amenities…
Taxation est. · year 1
- Rental income
- $23,417
- − Mortgage interest
- −$11,203
- − Property taxes
- −$1,039
- − Insurance
- −$1,000
- − Repairs & maintenance
- −$1,873
- − Management
- −$1,873
- − Depreciation
- −$5,818
- Taxable income
- $610
- Est. tax owed @ 24.0%
- −$146
- After-tax cash flow
- $3,728/yr
For passive investors: Depreciation is non-cash, so a rental often shows a tax loss while cash-flowing — sheltering income. Rental losses are passive: they offset passive income freely, and up to $25,000/yr can offset ordinary (W-2) income if you actively participate and your MAGI is under $100k (phasing out to $0 by $150k); unused losses carry forward. On sale, claimed depreciation is recaptured at up to 25%, and gains may owe capital-gains tax (a 1031 exchange can defer both). Figures are a year-1 estimate at your 24.0% rate — not tax advice; consult a CPA.
Schools (NCES district)
- District
- Chester-Upland SD
- NCES district ID
- 4205860
- Math proficiency
- 4% ▼ -3.00%
- Reading proficiency
- 17% ▼ -6.00%
- Median HH income
- $29,790
- Composite
- 8.05/100
- National rank
- #9918
- State rank
- #533 of 539 in PA
Livability — Upland
- Score
- 64/100
- State rank
- #1219
- US rank
- #14480
Category grades
Schools grade is shown separately in the Schools card above.
Census & demographics
- County
- Delaware County · 399,863 people
- Metro
- Philadelphia-Camden-Wilmington, PA-NJ-DE-MD
- Population (ZIP)
- 16,464
- Household income
- $82,450
- Rent vs Own
- Severe rent burden
- 321.0
Population outlook (Delaware County) Hauer SSP2
- Today (2025)
- 577,490 people
- By 2030
- 581,243 · +0.6%
- By 2040
- 584,700 · +1.2%
- By 2050
- 586,581 · +1.6%
- By 2075
- 598,706 · +3.7%
- By 2100
- 590,823 · +2.3%
Race, ethnicity, and origin ACS 2023
- Neighborhood character
- Majority White (65%)
- Race & ethnicity
- White 65% Black 24% Two or more races 6% Hispanic / Latino 4% Asian 2%
- Common ancestry
- Romanian 4% Iranian 2% Lithuanian 2%
- Foreign-born
- 5% · Canada, South Korea
- Languages at home
- 92% English-only · Spanish 2% Other Indo-European 2% Other Asian/Pacific 1%
Political lean MEDSL · Delaware
- 2024 margin
- Strong D (+23.7) · D 61.4% · R 37.6% · Other 1.0%
- 2008→2024 swing
- +2.3pp toward D · 2008: 21.4pp · 2024: 23.7pp
- All cycles
- 2024: D+23.7 2020: D+26.7 2016: D+22.0 2012: D+21.8 2008: D+21.4
Not yet ingested
- Civics
- —
Market trends
- HPI YoY
- ▼ -175.22%
- Current HPI
- 294.2115
- Rent YoY
- —
- Metro
- Philadelphia-Camden-Wilmington, PA-NJ-DE-MD
- State GDP YoY
- ▲ 1.68%
- F500 in state
- 34
Industry mix (Fortune 500 HQ in PA)
| Industry | F500 HQs | Revenue |
|---|---|---|
| Healthcare | 2 | $309B |
|
||
| Insurance | 2 | $27B |
|
||
| Telecommunications / Media | 1 | $124B |
|
||
| Industrial Distribution | 1 | $22B |
|
||
| Financial Services | 1 | $20B |
|
||
| Chemicals / Materials | 1 | $18B |
|
||
Price history
+7.5% since first listed4 events — show timeline
- 2026-06-02 Sold (Public Records) $215,000 Public Records
- 2026-06-01 Sold (MLS) $215,000 BRIGHT MLS
- 2026-05-09 Pending — BRIGHT MLS
- 2026-05-04 Listed $200,000 BRIGHT MLS
Property tax history
-4.0%/yrLatest (2026): $1,039 · -51.3% YoY. Source: county tax records.
Cash-flow waterfall
monthlySold comps — $/sqft
last 12 mo · ≤1 miLoading sold comps…