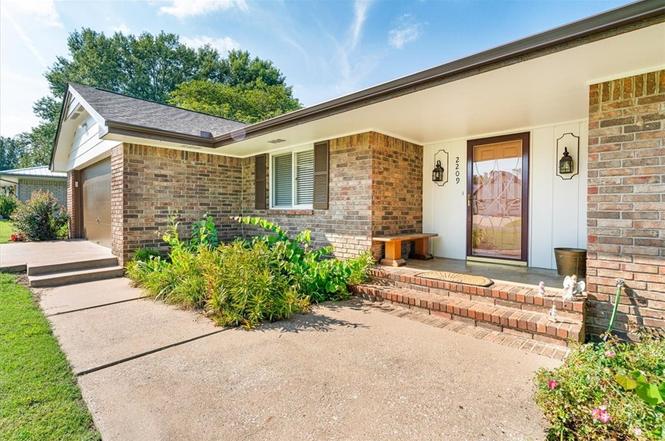
2209 W Granite St · Siloam Springs, AR
Flood risk 1/10 · Minimal
- FEMA flood zone
- X (unshaded)
- Chance of flooding over 30 yrs
- 0.0%
- Est. flood insurance / yr
- $507 – $1,088
Fire risk 7/10 · Major
- Est. fire insurance / yr
- $1,499 – $2,785
Heat risk 6/10 · Moderate
- Hot days now (above 107°F)
- 7 days/yr
- Hot days in 30 yrs
- 21 days/yr
Wind risk 2/10 · Minimal
- Chance of severe wind over 30 yrs
- 2.0%
Air-quality risk 2/10 · Minimal
- Unhealthy air days now
- 1 days/yr
- Unhealthy air days in 30 yrs
- 1 days/yr
Risk factors via First Street. Map © Google.
Why this score? — see what drove the C+ grade
The composite is a weighted blend of 9 inputs, each scored 0–100. Each bar is that input's sub-score; the figure is the points it added to the 100-point composite (weight × sub-score).
- Cash flow +21.8/30.0
- ARV discount +15.0/15.0
- DSCR +7.0/10.0
- 1% rule +4.7/10.0
- Livability +3.7/5.0
- Schools +3.6/10.0
- Rent growth +2.5/5.0
- Condition / age +2.5/5.0
- Appreciation +0.0/10.0
$320,500
🖨 Deal sheet 📄 Offer letter ✓ Due diligence
Listing remarks MLS
Very nice ranch style home in a nice established neighborhood! 3BR/2BA approx 2320 sf. Nice open floor plan, wood burning fireplace with insert, wood floors, office/den, beautiful newly stained deck with above ground pool (w/ newer pump), nice landscaping. ,Great location close to schools!
Key facts
- 0.34 acre lot
- Garage
- Pool
Tags
Property features AI
Finance
- HOA & community: Monthly association fee; Curbs in the community
Exterior
- Parking: Attached garage with garage door opener; Two covered parking spaces
- Utilities: Electricity available; Public water; Sewer available
- Home design: Single-story home; Brick construction; Architectural shingle roof; Slab foundation
- Construction: Built 25 years or older
- Exterior features: Concrete driveway; Covered deck; Outbuilding; Back yard fencing; Above-ground private pool
Interior
- Kitchen: Dishwasher; Plumbed for ice maker; Electric water heater
- Flooring: Tile flooring; Wood flooring
- Bathrooms: Two full bathrooms; One half bathroom
- Heating & cooling: Central heating; Central air conditioning; Pellet stove insert fireplace
- Interior features: Ceiling fans; Attic access; Storage
- Laundry & utility: Washer hookup; Dryer hookup
Neighborhood map
What this means for you Summary
Snapshot
- This is a 3-bed/2.5-bath single-family listed at $320k.
Deal economics
- At list price, monthly cash flow is $497 ($6k/yr) — positive.
- The deal already cash-flows at list — no discount required.
- To meet the 1% rule (rent ≥ 1% of price), the offer needs to be $310k (3.2% below list).
- Recommended offer: $282k (12.0% below list) — sets the bar for market timing.
- Cap rate 8.2% vs local median 3.9% in Siloam Springs — top-decile yield for the area; either an underpriced asset or a hidden risk that comps aren't pricing in. Stress-test before assuming the spread holds.
Location & tenants
- Location reads 74/100 on livability (#17 in AR, #4,621 nationally) — a middle-class / working-renter tenant base. Strengths: cost of living A+, housing A+, health & safety A+; Watch: schools D, crime D, amenities F.
- Siloam Springs School District (town): math 44% / reading 40% proficiency, ranked #53 of 238 in AR (top 22%) — families likely to look elsewhere, expect single-tenant / working-renter base with shorter leases.
- Market conditions: 362 active listings in the ZIP; 6 comparable units currently listed for rent nearby; rentals at typical pace (median 15d on market — plan ~3-4 weeks tenant-placement turnaround); solid renter incomes; 4,359 units permitted in Benton County in 2024 (402 in 5+ unit buildings).
- At $3,102/mo this rent would consume 49% of the median local household income ($76k/yr) (locally 176% of renters already pay >50% of income on rent) — very limited rent-growth headroom before tenants either downsize or default.
Forward outlook
- Local home prices are declining (-3.0%/yr); year-one equity from $2k of loan paydown is wiped out by about $10k of value loss. Plan a longer hold.
- Benton County population projected at +56% by 2050 — long-run rental-demand tailwind backs the buy-and-hold thesis.
Negotiation context
- It's been on market 227 days — a 12% lower offer ($282k) is reasonable based on typical stale-listing flexibility.
- 2 sale attempts since 12y ago; this cycle's ask has dropped $27k (8%) from the opening price — seller is motivated, your offer sets the floor, not the list.
- Current owner paid $150k; list at $320k implies a 114% gain — meaningful room to come down on a strong offer.
Risks & watch-outs
- Climate carrying-cost: major wildfire risk; extreme-heat days projected 7→21/yr by 2055 (HVAC capex compounding) — expect insurance premiums to compound above CPI over the hold.
Questions for the listing agent
- It's been on market 227 days. Have you received any prior offers? Is the seller open to a 12% concession, seller financing, or rate buy-down credit?
- Built in 1976 — when were the roof, HVAC, electrical panel, plumbing, and water heater last replaced?
- Why hasn't it sold? Are there any deal-killer items the seller is aware of (foundation, flood, title, zoning, code violations)?
- Is there a deadline driving the sale (1031 exchange, divorce, estate, relocation)? That informs how much negotiation room exists.
- Schools are D-rated, which usually means shorter tenancies and higher turnover. Who's the typical renter profile here, and what's been the actual vacancy rate?
- Crime grade is D in this area — have there been break-ins, vandalism, or insurance claims at this property in the last 3 years? What carrier currently insures it and at what premium?
- What's the average days-on-market for RENTAL listings here right now (not sales)? A rising rental-DOM trend means longer vacancies and softer asking-rent achievability than the comps imply.
- What's the recent tenant-quality profile in this submarket — average credit score on applications, eviction rate, late-payment / NSF rate, and stable-employment percentage? A property-management company in the area should have these aggregated.
- How much new for-sale + rental construction is in the pipeline within 1–3 miles? Heavy new supply typically softens prices + rents 12–24 months out; constrained supply supports both.
Investment metrics
- 1% rule
- 0.97% ✗
- Cap rate
- 8.15%
- Cash-on-cash
- 6.64%
- DSCR
- 1.30
- GRM
- 8.6
CMA / ARV
- ARV (on-the-fly)
- $394,400
- Comps found
- 7
Show comp detail 7 sales within ~0.75 mi
| Address | Dist | Beds/Ba | Sqft | Sold | Price | $/sf | Match |
|---|---|---|---|---|---|---|---|
| 1005 W Jefferson St | 0.72mi | 3/1.5 | 2,300 (-1%) | 4mo | $373,000 | $162 | 58 |
| 301 S Dogwood St | 0.61mi | 3/2.5 | 2,506 (+8%) | 3mo | $367,000 | $146 | 56 |
| 1910 Jefferson St | 0.19mi | 4/2.5 (+1) | 2,006 (-14%) | 10mo | $285,000 | $142 | 56 |
| 1069 Twin Springs Ct | 0.72mi | 4/2.5 (+1) | 2,450 (+6%) | 1mo | $500,000 | $204 | 51 |
| 537 S Dogwood St | 0.57mi | 4/2.5 (+1) | 2,150 (-7%) | 6mo | $405,000 | $188 | 51 |
| 119 S Dogwood St | 0.64mi | 3/2.5 | 2,187 (-6%) | 12mo | $388,000 | $177 | 51 |
| 212 Western Hills Dr | 0.45mi | 4/3.0 (+1) | 2,504 (+8%) | 19mo | $425,000 | $170 | 43 |
Match score weights: distance 35% · size 25% · config 20% · recency 20%. Top-matched comps best support the ARV.
Projected returns pro-forma
-3.0% appreciation · 3.0% rent growth · sell at horizon
- IRR
- -6.1%
- Equity multiple
- 0.77×
- Total profit
- $-20,404
- Equity at exit
- $47,788
- IRR
- 3.5%
- Equity multiple
- 1.25×
- Total profit
- $22,518
- Equity at exit
- $27,711
Cash invested: $89,740 (down + closing). Projections, not guarantees.
Landlord ↔ Tenant lean methodology
- Overall (STATE)
- 92 Strongly Landlord-Friendly
- State Arkansas
- 92 Strongly Landlord-Friendly · R+14
- County
- — inherits STATE
- City
- — inherits STATE
ZIP-level market 72761
- Home prices YoY
- -13.6%
- Active inventory
- 362
- Price-to-rent
- 8.6×
Monthly cashflow live
- Estimated rent
- $3,102 high interval (Pro) →
- Mortgage (P&I)
- −$1,681
- Tax from tax record
- −$139 /mo · $1,672/yr
- Insurance
- −$134
- HOA
- −$0
- Vacancy / Maint / Mgmt
- −$651
- Net cashflow
- $497
Break-even live
UW: 25.0% down · 7.5% · 30yr · 1.5% tax · 5.0% vac · 8.0% maint · 8.0% mgmt
Financing live
Cash to close
- Down payment
- $80,125
- Closing costs
- $9,615
- Reserves months
- —
- Total cash needed
- —
Loan-product check · same deal, 3 products live
Conventional
25% down · 7.5% · 30yr
- Down + closing
- —
- Monthly P&I
- —
- Monthly cashflow
- —
- DSCR
- —
- Eligible?
- —
Personal DTI + credit; lowest rate.
DSCR
20% down · 8.5% · 30yr
- Down + closing
- —
- Monthly P&I
- —
- Monthly cashflow
- —
- DSCR
- —
- Eligible?
- —
No personal income docs; deal must DSCR.
Hard money
10% down · 12.0% · 12mo
- Down + closing
- —
- Monthly P&I
- —
- Monthly cashflow
- —
- DSCR
- —
- Eligible?
- —
Short-term bridge; refi at stabilization.
Rent comps 6 comps
| Address | Beds | Baths | Sqft | Rent | $/sqft | DOM | Units | Dist |
|---|---|---|---|---|---|---|---|---|
| 2010 W Central St Unit 1520931P Siloam Springs, AR | 4.0 | 2.0 | 1894 | $3,631 | $1.92 | 14d | 1 | 0.32mi |
| 201 N Dogwood St Unit 1241305P Siloam Springs, AR | 3.0 | 2.0 | 1969 | $3,298 | $1.67 | 14d | 1 | 0.68mi |
| 315 W Harvard St Unit 1520942P Siloam Springs, AR | 3.0 | 2.0 | 2045 | $3,266 | $1.60 | 14d | 1 | 1.10mi |
| 408 S Wright St Unit 1520957P Siloam Springs, AR | 4.0 | 3.0 | 2109 | $4,449 | $2.11 | 21d | 1 | 1.19mi |
| 413 S Madison St Unit 1520928P Siloam Springs, AR | 4.0 | 2.0 | 1700 | $3,735 | $2.20 | 14d | 1 | 1.44mi |
| 426 S Washington St Unit 1520937P Siloam Springs, AR | 3.0 | 2.0 | 1582 | $4,358 | $2.75 | 14d | 1 | 1.48mi |
Listing history 9 events
-
2026-04-29status Pending
-
2026-03-08price $320,500
-
2026-01-09price $329,900
-
2025-10-23price $342,500
-
2025-09-13$347,500 Active
-
2014-10-27soldstatus $150,000
-
2014-10-24soldstatus $150,000 290-char remark
Show marketing remark (290 chars)
Very nice ranch style home in a nice established neighborhood! 3BR/2BA approx 2320 sf. Nice open floor plan, wood burning fireplace with insert, wood floors, office/den, beautiful newly stained deck with above ground pool (w/ newer pump), nice landscaping. ,Great location close to schools!
-
2014-08-08$158,400 290-char remark
Show marketing remark (290 chars)
Very nice ranch style home in a nice established neighborhood! 3BR/2BA approx 2320 sf. Nice open floor plan, wood burning fireplace with insert, wood floors, office/den, beautiful newly stained deck with above ground pool (w/ newer pump), nice landscaping. ,Great location close to schools!
-
2005-09-07soldstatus $163,000
ⓘ Source: listings_history table (triggers on properties + properties_extension) + one-shot
backfill from property_details.listing_events for pre-trigger history.
Tax reassessment forecast AR · Resets to sale price
- Current annual tax
- $1,672 · $139/mo
- Projected year-2 tax
- $2,051 · $171/mo
- Expected delta
- +$379/yr (+$32/mo · 22.7%)
ⓘ Screening estimate from a state-policy table — verify with the county assessor before closing.
Climate risk First Street
- Flood 1/10 Low FEMA zone X (unshaded) · 0% chance over 30 yrs
- Wildfire 7/10 Severe
- Heat 6/10 Major 7 d/yr ≥107°F today · 21 d/yr by 30 yrs out
- Wind 2/10 Low 2% chance of damaging wind over 30 yrs
- Air quality 2/10 Low 1 unhealthy d/yr today · 1 by 30 yrs out
Nearby sold comps map
Loading sold comps map…
Walkable amenities ~0.75 mi
Loading nearby amenities…
Taxation est. · year 1
- Rental income
- $37,222
- − Mortgage interest
- −$17,953
- − Property taxes
- −$1,672
- − Insurance
- −$1,602
- − Repairs & maintenance
- −$2,978
- − Management
- −$2,978
- − Depreciation
- −$9,324
- Taxable income
- $716
- Est. tax owed @ 24.0%
- −$172
- After-tax cash flow
- $5,790/yr
For passive investors: Depreciation is non-cash, so a rental often shows a tax loss while cash-flowing — sheltering income. Rental losses are passive: they offset passive income freely, and up to $25,000/yr can offset ordinary (W-2) income if you actively participate and your MAGI is under $100k (phasing out to $0 by $150k); unused losses carry forward. On sale, claimed depreciation is recaptured at up to 25%, and gains may owe capital-gains tax (a 1031 exchange can defer both). Figures are a year-1 estimate at your 24.0% rate — not tax advice; consult a CPA.
Schools (NCES district)
- District
- Siloam Springs School District
- NCES district ID
- 0512450
- Math proficiency
- 44% ▼ -7.00%
- Reading proficiency
- 40% ▼ -2.00%
- Median HH income
- $46,222
- Composite
- 35.81/100
- National rank
- #4828
- State rank
- #53 of 238 in AR
Livability — Siloam Springs
- Score
- 74/100
- State rank
- #17
- US rank
- #4621
Category grades
Schools grade is shown separately in the Schools card above.
Census & demographics
- Census place
- Siloam Springs, AR
- County
- Benton County · 259,241 people
- City population
- 24,745
- Metro
- Fayetteville-Springdale-Rogers, AR
- Population (ZIP)
- 24,745
- Household income
- $76,122
- Rent vs Own
- Severe rent burden
- 176.0
Population outlook (Benton County) Hauer SSP2
- Today (2025)
- 318,683 people
- By 2030
- 353,481 · +10.9%
- By 2040
- 425,280 · +33.4%
- By 2050
- 497,239 · +56.0%
- By 2075
- 662,114 · +107.8%
- By 2100
- 776,431 · +143.6%
Race, ethnicity, and origin ACS 2023
- Neighborhood character
- Diverse neighborhood (Simpson 0.63)
- Race & ethnicity
- White 58% Two or more races 24% Hispanic / Latino 19% Native American 4% Asian 3%
- Hispanic origin (detail)
- Mexican 8% Puerto Rican 2%
- Common ancestry
- Italian 2% Slovak 1% Serbian 1%
- Foreign-born
- 11% · Canada
- Languages at home
- 85% English-only · Spanish 13% Other Indo-European 1%
Political lean MEDSL · Benton
- 2024 margin
- Strong R (+27.0) · D 35.2% · R 62.1% · Other 2.7%
- 2008→2024 swing
- +9.6pp toward D · 2008: -36.5pp · 2024: -27.0pp
- All cycles
- 2024: R+27.0 2020: R+26.4 2016: R+34.9 2012: R+40.4 2008: R+36.5
Not yet ingested
- Civics
- —
Market trends
- HPI YoY
- ▼ -45.93%
- Current HPI
- 291.1062
- Rent YoY
- —
- Metro
- Fayetteville-Springdale-Rogers, AR
- State GDP YoY
- ▲ 3.80%
- F500 in state
- 10
Industry mix (Fortune 500 HQ in AR)
| Industry | F500 HQs | Revenue |
|---|---|---|
| Retail | 1 | $681B |
|
||
| Food / Agriculture | 1 | $53B |
|
||
| Retail / Energy | 1 | $22B |
|
||
| Transportation / Logistics | 1 | $12B |
|
||
| Energy | 1 | $4B |
|
||
Price history
+96.6% since first listed9 events — show timeline
- 2026-04-29 Pending — NWARMLS
- 2026-03-08 Price Changed $320,500 NWARMLS
- 2026-01-09 Price Changed $329,900 NWARMLS
- 2025-10-23 Price Changed $342,500 NWARMLS
- 2025-09-13 Listed $347,500 NWARMLS
- 2014-10-27 Sold (Public Records) $150,000 Public Records
- 2014-10-24 Sold (MLS) $150,000 NWARMLS
- 2014-08-08 Listed $158,400 NWARMLS
- 2005-09-07 Sold (Public Records) $163,000 Public Records
Property tax history
+2.2%/yrLatest (2025): $1,672 · +1.5% YoY. Source: county tax records.
Cash-flow waterfall
monthlySold comps — $/sqft
last 12 mo · ≤1 miLoading sold comps…