 Duplex
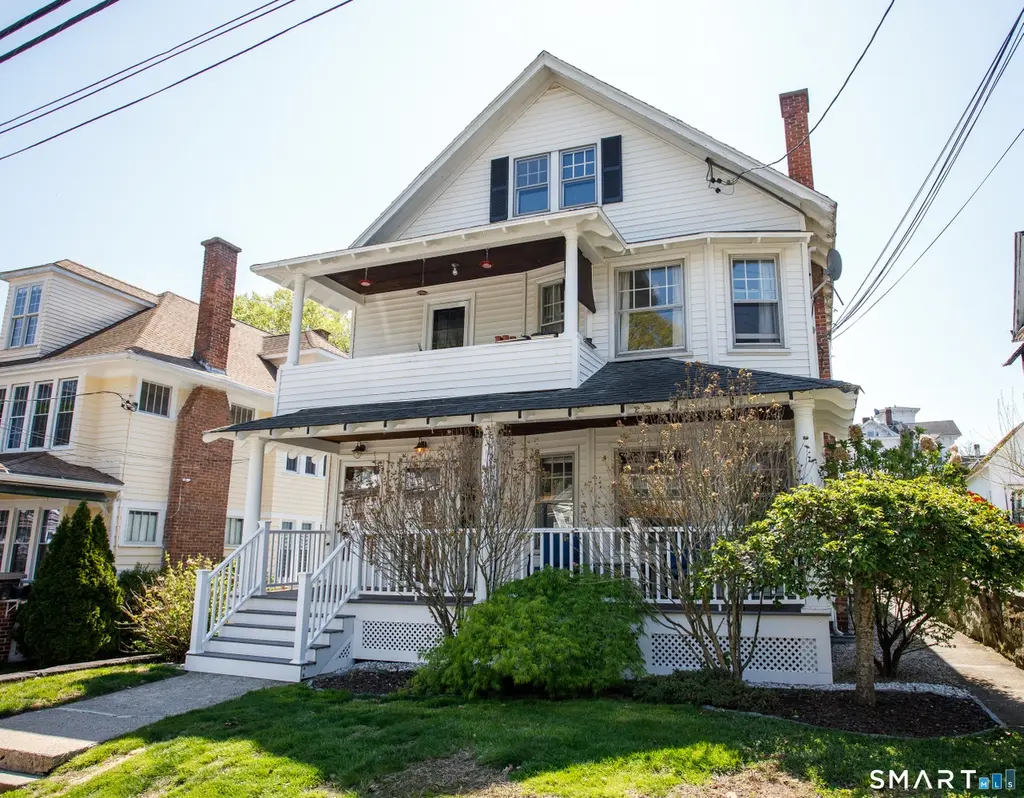
41-43 Otis St · Norwich, CT
Flood risk 5/10 · Moderate
- FEMA flood zone
- X (unshaded)
- Chance of flooding over 30 yrs
- 0.24%
- Est. flood insurance / yr
- $473 – $860
Fire risk 3/10 · Minor
- Est. fire insurance / yr
- $829 – $1,539
Heat risk 5/10 · Moderate
- Hot days now (above 97°F)
- 7 days/yr
- Hot days in 30 yrs
- 17 days/yr
Wind risk 6/10 · Moderate
- Chance of severe wind over 30 yrs
- 63.0%
Air-quality risk 3/10 · Minor
- Unhealthy air days now
- 2 days/yr
- Unhealthy air days in 30 yrs
- 3 days/yr
Risk factors via First Street. Map © Google.
Why this score? — see what drove the C- grade
The composite is a weighted blend of 9 inputs, each scored 0–100. Each bar is that input's sub-score; the figure is the points it added to the 100-point composite (weight × sub-score).
- Cash flow +21.7/30.0
- DSCR +6.9/10.0
- ARV discount +5.8/15.0
- 1% rule +5.7/10.0
- Rent growth +4.2/5.0
- Livability +4.0/5.0
- Condition / age +4.0/5.0
- Schools +2.1/10.0
- Appreciation +0.0/10.0
$379,500
🖨 Deal sheet 📄 Offer letter ✓ Due diligence
Multi-family units
County records classify this as Multi-Family (2-4 Unit). Listing-text estimate: 2 units. confirmed
Listing remarks
Multiple offers best and final by Monday May 10 th at 11 am BEAUTIFULLY MAINTAINED CLASSY 2 FAMILY WITH CHARMING PERIOD CRAFTSMANSHIP COMBINED WITH UPDATED KITCHENS, BATHS AND MECHANICALS MAKES THIS A WONDERFUL OWNER OCCUPIED OR GREAT INVESTMENT HOME. EACH UNIT FEATURES 3 BEDROOMS WITH SPACIOUS FIREPLACED LIVING ROOMS, PRETTY DINING ROOMS WITH BUILT- IN HUTCHES AND CHEERFUL KITCHENS. LIGHT, BRIGHT IMMACULATE UNITS WITH A STYLISH FRONT PORCH, BACK PATIO AREA AND A 4 CAR DETACHED GARAGE. DOWN THE STREET FROM NFA NEAR ST. PATRICK'S CATHEDRAL MAKES THIS CONVENIENT LOCATION A REWARDING OPPORTUNITY!
Key facts
- Updated baths
- Built in hutches
- Stylish front porch
Tags
Property features AI
Exterior
- Parking: Detached garage; 4 garage spaces
- Utilities: Public water connected; Public sewer connected; Natural gas hot water and heating
- Home design: Multi-family property (2-family); Multi-family for sale
- Construction: Frame construction; Concrete foundation; Asphalt shingle roof; Vinyl siding; Built as two-unit building
- Exterior features: Balcony; Porch; Sidewalk; Gutters; Exterior lighting; Level lot
Interior
- Bedrooms: 6 bedrooms
- Bathrooms: 2 full bathrooms
- Heating & cooling: Hot air heating; Natural gas fuel
- Interior features: 12 total rooms; Full unfinished basement with storage, interior access and concrete floor; Attic with floored storage space and walk-up access; One fireplace
- Laundry & utility: Basement laundry hook-ups; 40-gallon natural gas hot water tank
Neighborhood map
What this means for you Summary
Snapshot
- This is a 2 × 3-bed/1.0-bath units multifamily listed at $380k. Condition is rated good.
Deal economics
- At list price, monthly cash flow is $582 ($7k/yr) — positive. Per door: $291/mo.
- The deal already cash-flows at list — no discount required.
- Meets the 1% rule at list price ($4k rent vs $380k).
- Cap rate 8.1% vs local median 4.0% in Norwich — top-decile yield for the area; either an underpriced asset or a hidden risk that comps aren't pricing in. Stress-test before assuming the spread holds.
Location & tenants
- Location reads 81/100 on livability (#18 in CT, #1,391 nationally) — a professional / high-income tenant draw. Strengths: housing A+, health & safety A+, commute A-; Watch: schools D+.
- Norwich School District (urban): math 19% / reading 29% proficiency, ranked #139 of 153 in CT (top 91%) — low school quality limits family demand, transient renter base, plan for 1-2y turnover; 62% free/reduced lunch — lower-income household profile, screen leases tightly.
- Market conditions: Rents rising fast (+6.6%/yr); 241 active listings in the ZIP; 487 units permitted in Southeastern Connecticut Planning Region in 2024 (244 in 5+ unit buildings).
- At $4,056/mo this rent would consume 74% of the median local household income ($66k/yr) (locally 1643% of renters already pay >50% of income on rent) — very limited rent-growth headroom before tenants either downsize or default.
Forward outlook
- Local home prices are declining (-3.0%/yr); year-one equity from $3k of loan paydown is wiped out by about $11k of value loss. Plan a longer hold.
- At projected returns (-3.0% appreciation + 6.6% rent growth), your $106k cash investment doubles in ~10 years — after that, you're playing with house money.
Negotiation context
- Only 6 days on market — expect competitive offers; lowballing is unlikely to land.
Risks & watch-outs
- Watch-outs: built in 1928 — expect roof / HVAC / electrical / plumbing capex.
- Climate carrying-cost: moderate flood risk; major wind risk, 63% chance of damaging wind over 30y; extreme-heat days projected 7→17/yr by 2055 (HVAC capex compounding) — expect insurance premiums to compound above CPI over the hold.
Questions for the listing agent
- Can we see the unit-by-unit rent roll, current vacancy, and any below-market leases? What's the average tenancy length?
- What capital expenditures (roof, boiler, parking lot, exteriors) have been made in the last 5 years, and what's planned in the next 2?
- Built in 1928 — when were the roof, HVAC, electrical panel, plumbing, and water heater last replaced?
- Is there a deadline driving the sale (1031 exchange, divorce, estate, relocation)? That informs how much negotiation room exists.
- Schools are D-rated, which usually means shorter tenancies and higher turnover. Who's the typical renter profile here, and what's been the actual vacancy rate?
- What's the average days-on-market for RENTAL listings here right now (not sales)? A rising rental-DOM trend means longer vacancies and softer asking-rent achievability than the comps imply.
- What's the recent tenant-quality profile in this submarket — average credit score on applications, eviction rate, late-payment / NSF rate, and stable-employment percentage? A property-management company in the area should have these aggregated.
- How much new apartment / multifamily construction is in the pipeline within 1–3 miles? Heavy new supply (>2% of stock underway) typically softens rents 12–24 months out; light construction supports rent growth.
Investment metrics
- 1% rule
- 1.07% ✓
- Cap rate
- 8.13%
- Cash-on-cash
- 6.57%
- DSCR
- 1.29
- GRM
- 7.8
CMA / ARV
- ARV (median comp)
- $365,690
- List price
- $379,500
- Delta
- 3.78%
- Verdict
- FAIR
- Comps
- 20 within 1.0 mi
Show comp detail 12 sales within ~0.75 mi
| Address | Dist | Beds/Ba | Sqft | Sold | Price | $/sf | Match |
|---|---|---|---|---|---|---|---|
| 127 Roath St | 0.33mi | 6/2.5 | 3,116 (-1%) | 6mo | $310,000 | $99 | 76 |
| 18 Division St | 0.27mi | 6/4.0 | 3,040 (-3%) | 1mo | $367,500 | $121 | 74 |
| 117 Broad St | 0.21mi | 6/4.0 | 3,223 (+3%) | 9mo | $615,000 | $191 | 70 |
| 29 Division St | 0.28mi | 7/2.5 (+1) | 3,007 (-4%) | 10mo | $120,000 | $40 | 64 |
| 128 Broadway | 0.25mi | 5/4.0 (-1) | 3,083 (-2%) | 13mo | $385,000 | $125 | 61 |
| 18 Hawthorne St | 0.42mi | 7/3.0 (+1) | 3,138 (-0%) | 14mo | $420,000 | $134 | 60 |
| 49 Freeman Ave | 0.10mi | 7/3.0 (+1) | 3,504 (+12%) | 9mo | $255,000 | $73 | 59 |
| 93 Broad St | 0.21mi | 6/3.5 | 2,834 (-10%) | 11mo | $362,500 | $128 | 59 |
| 136 Washington St | 0.41mi | 6/3.0 | 3,480 (+11%) | 4mo | $432,000 | $124 | 55 |
| 54 Roath St | 0.45mi | 7/3.0 (+1) | 2,788 (-11%) | 3mo | $500,000 | $179 | 49 |
| 51-53 Cliff St | 0.48mi | 7/3.0 (+1) | 3,516 (+12%) | 2mo | $451,000 | $128 | 47 |
| 433 E Main St | 0.69mi | 7/3.0 (+1) | 2,873 (-8%) | 13mo | $275,000 | $96 | 34 |
Match score weights: distance 35% · size 25% · config 20% · recency 20%. Top-matched comps best support the ARV.
Projected returns pro-forma
-3.0% appreciation · 6.62% rent growth · sell at horizon
- IRR
- -2.2%
- Equity multiple
- 0.91×
- Total profit
- $-9,082
- Equity at exit
- $56,585
- IRR
- 11.1%
- Equity multiple
- 2.01×
- Total profit
- $107,725
- Equity at exit
- $32,812
Cash invested: $106,260 (down + closing). Projections, not guarantees.
Landlord ↔ Tenant lean methodology
- Overall (STATE)
- 27 Tenant-Leaning
- State Connecticut
- 27 Tenant-Leaning · D+7
- County
- — inherits STATE
- City
- — inherits STATE
ZIP-level market 06360
- Home prices YoY
- -19.9%
- Rents YoY
- 6.6%
- Active inventory
- 241
- Price-to-rent
- 15.6×
Monthly cashflow live
- Estimated rent
- $4,056 high interval (Pro) →
- Mortgage (P&I)
- −$1,990
- Tax est. 1.5%
- −$474 /mo · $5,692/yr
- Insurance
- −$158
- HOA
- −$0
- Vacancy / Maint / Mgmt
- −$852
- Net cashflow
- $582
Break-even live
2-unit breakdown (identical units grouped — click to expand)
| Units | Beds | Baths | Est. rent |
|---|---|---|---|
| 2× units | 3 | 1 | $4,056 |
| #1 | 3 | 1 | $2,028 |
| #2 | 3 | 1 | $2,028 |
| Total (2 units) | $4,056 | ||
UW: 25.0% down · 7.5% · 30yr · 1.5% tax · 5.0% vac · 8.0% maint · 8.0% mgmt
Financing live
Cash to close
- Down payment
- $94,875
- Closing costs
- $11,385
- Reserves months
- —
- Total cash needed
- —
Loan-product check · same deal, 3 products live
Conventional
25% down · 7.5% · 30yr
- Down + closing
- —
- Monthly P&I
- —
- Monthly cashflow
- —
- DSCR
- —
- Eligible?
- —
Personal DTI + credit; lowest rate.
DSCR
20% down · 8.5% · 30yr
- Down + closing
- —
- Monthly P&I
- —
- Monthly cashflow
- —
- DSCR
- —
- Eligible?
- —
No personal income docs; deal must DSCR.
Hard money
10% down · 12.0% · 12mo
- Down + closing
- —
- Monthly P&I
- —
- Monthly cashflow
- —
- DSCR
- —
- Eligible?
- —
Short-term bridge; refi at stabilization.
Listing history 2 events
-
2026-05-12status Under Contract 601-char remark
-
2026-05-07$379,500 Active 601-char remark
ⓘ Source: listings_history table (triggers on properties + properties_extension) + one-shot
backfill from property_details.listing_events for pre-trigger history.
Climate risk First Street
- Flood 5/10 Major FEMA zone X (unshaded) · 24% chance over 30 yrs
- Wildfire 3/10 Moderate
- Heat 5/10 Major 7 d/yr ≥97°F today · 17 d/yr by 30 yrs out
- Wind 6/10 Major 63% chance of damaging wind over 30 yrs
- Air quality 3/10 Moderate 2 unhealthy d/yr today · 3 by 30 yrs out
Nearby sold comps map
Loading sold comps map…
Walkable amenities ~0.75 mi
Loading nearby amenities…
Taxation est. · year 1
- Rental income
- $48,672
- − Mortgage interest
- −$21,258
- − Property taxes
- −$5,692
- − Insurance
- −$1,898
- − Repairs & maintenance
- −$3,894
- − Management
- −$3,894
- − Depreciation
- −$11,040
- Taxable income
- $997
- Est. tax owed @ 24.0%
- −$239
- After-tax cash flow
- $6,740/yr
For passive investors: Depreciation is non-cash, so a rental often shows a tax loss while cash-flowing — sheltering income. Rental losses are passive: they offset passive income freely, and up to $25,000/yr can offset ordinary (W-2) income if you actively participate and your MAGI is under $100k (phasing out to $0 by $150k); unused losses carry forward. On sale, claimed depreciation is recaptured at up to 25%, and gains may owe capital-gains tax (a 1031 exchange can defer both). Figures are a year-1 estimate at your 24.0% rate — not tax advice; consult a CPA.
Condition & rehab AI · 13 photos
This multi-family home is in good condition with minimal repairs needed. It has a good condition score and is ready for a new owner or investor to move in.
Value-add opportunities
- Both Painting the exterior siding and trim — A fresh coat of paint can enhance the curb appeal and increase the home's value.
- Both Landscaping the front yard — A well-maintained front yard can improve the home's curb appeal and increase its value.
Renovation cost estimate screening
Value-add ROI direction
- Both Painting the exterior siding and trim — A fresh coat of paint can enhance the curb appeal and increase the home's value. ↑
- Both Landscaping the front yard — A well-maintained front yard can improve the home's curb appeal and increase its value. ↑
ⓘ Cost ranges are severity-bucket heuristics (US national rule-of-thumb). Get contractor quotes + a written scope before underwriting a rehab budget.
Schools (NCES district)
- District
- Norwich School District
- NCES district ID
- 0903120
- Math proficiency
- 19% ▼ -8.00%
- Reading proficiency
- 29% ▼ -7.00%
- Median HH income
- $50,813
- Composite
- 21.27/100
- National rank
- #8395
- State rank
- #139 of 153 in CT
Livability — Norwich
- Score
- 81/100
- State rank
- #18
- US rank
- #1391
Category grades
Schools grade is shown separately in the Schools card above.
Census & demographics
- Census place
- Norwich, CT
- County
- New London County · 147,197 people
- City population
- 37,216
- Metro
- Norwich-New London, CT
- Population (ZIP)
- 37,216
- Household income
- $65,539
- Rent vs Own
- Severe rent burden
- 1643.0
Population outlook (Southeastern Connecticut County) Hauer SSP2
- By 2040
- 293,442
Race, ethnicity, and origin ACS 2023
- Neighborhood character
- Diverse neighborhood (Simpson 0.63)
- Race & ethnicity
- White 56% Hispanic / Latino 21% Two or more races 12% Black 10% Asian 7%
- Hispanic origin (detail)
- Mexican 3% Puerto Rican 9% Cuban 1% Dominican 3%
- Common ancestry
- Lithuanian 8% Romanian 5% Hispanic 4%
- Foreign-born
- 15% · Canada, China
- Languages at home
- 77% English-only · Spanish 11% French/Haitian/Cajun 4% Chinese 3%
Political lean MEDSL · Southeastern Connecticut
- 2024 margin
- D (+13.0) · D 55.6% · R 42.6% · Other 1.8%
- All cycles
- 2024: D+13.0
Not yet ingested
- Civics
- —
Market trends
- HPI YoY
- ▼ -65.27%
- Current HPI
- 261.8575
- Rent YoY
- ▲ 6.62%
- Metro
- Norwich-New London, CT
- State GDP YoY
- ▲ 1.06%
- F500 in state
- 38
Industry mix (Fortune 500 HQ in CT)
| Industry | F500 HQs | Revenue |
|---|---|---|
| Industrial Machinery | 4 | $38B |
|
||
| Insurance | 3 | $71B |
|
||
| Financial Services | 2 | $25B |
|
||
| Transportation / Logistics | 2 | $18B |
|
||
| Healthcare | 1 | $247B |
|
||
| Telecommunications | 1 | $55B |
|
||
Price history
2 events — show timeline
- 2026-05-12 Pending — Smart MLS
- 2026-05-07 Listed $379,500 Smart MLS
Cash-flow waterfall
monthlySold comps — $/sqft
last 12 mo · ≤1 miLoading sold comps…