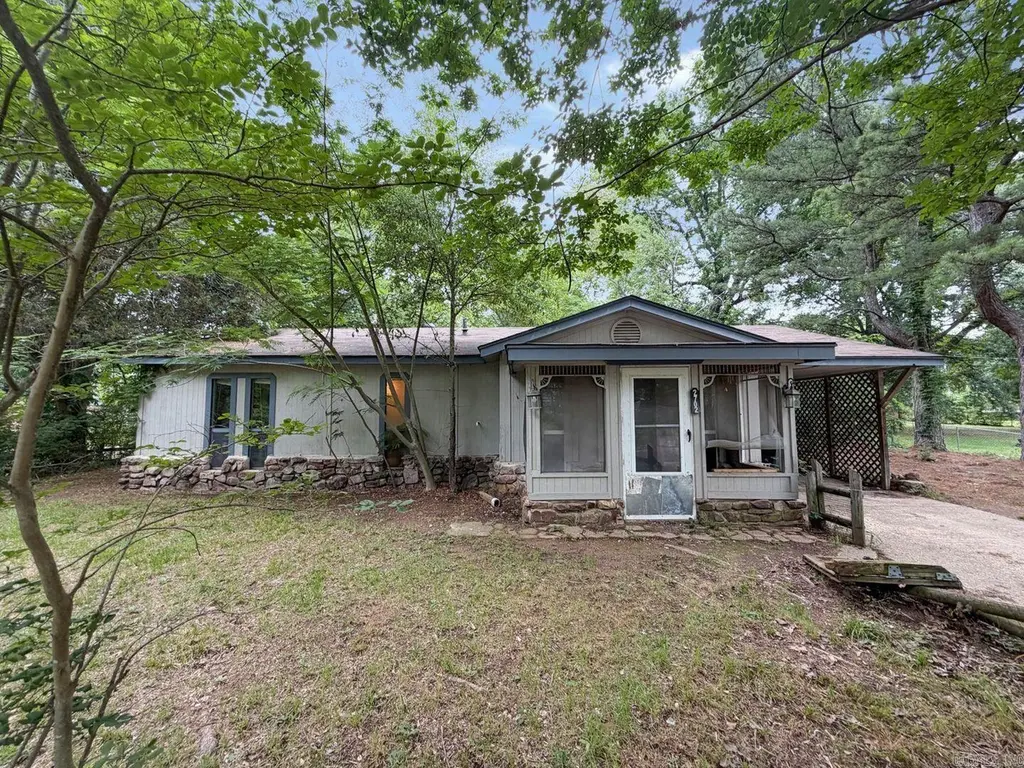
2702 Burchwood Dr · Salem, AR
Flood risk 1/10 · Minimal
- FEMA flood zone
- X (unshaded)
- Chance of flooding over 30 yrs
- 0.0%
- Est. flood insurance / yr
- $507 – $1,088
Fire risk 4/10 · Minor
- Est. fire insurance / yr
- $1,499 – $2,785
Heat risk 6/10 · Moderate
- Hot days now (above 111°F)
- 7 days/yr
- Hot days in 30 yrs
- 19 days/yr
Wind risk 4/10 · Minor
- Chance of severe wind over 30 yrs
- 12.0%
Air-quality risk 2/10 · Minimal
- Unhealthy air days now
- 0 days/yr
- Unhealthy air days in 30 yrs
- 1 days/yr
Risk factors via First Street. Map © Google.
Why this score? — see what drove the B+ grade
The composite is a weighted blend of 9 inputs, each scored 0–100. Each bar is that input's sub-score; the figure is the points it added to the 100-point composite (weight × sub-score).
- Cash flow +30.0/30.0
- ARV discount +15.0/15.0
- 1% rule +10.0/10.0
- DSCR +10.0/10.0
- Schools +4.2/10.0
- Rent growth +3.6/5.0
- Livability +3.2/5.0
- Condition / age +2.5/5.0
- Appreciation +0.0/10.0
$89,900
🖨 Deal sheet (PDF) 📄 Offer letter ✓ Due diligence
Listing remarks MLS
Adorable home with huge fenced back yard within walking distance of Salem Elem. School. Roof replaced 2017. Refrigerator, washer & dryer convey. Home may qualify for Rural Development Loan with Zero Down 100% Financing! This cute home sits on a large corner lot! See agent remarks
Key facts
- Proximity to dining
- Existing layout
- 0.37 acre lot
Tags
Property features AI
Exterior
- Parking: Carport (1 car)
- Utilities: Public sewer; Public water; Electric (co-op); Natural gas
- Home design: Frame construction; Composition roof
- Construction: Frame exterior; Slab foundation; Composition roof
- Exterior features: Patio; Paved road access; Level corner lot
Interior
- Kitchen: Gas range; Dishwasher; Refrigerator stays
- Flooring: Vinyl; Laminate
- Bathrooms: 1 full bathroom
- Heating & cooling: Central heat; Central cooling
- Interior features: Vinyl and laminate flooring; Other room (see remarks)
Neighborhood map
What this means for you Summary
Snapshot
- This is a 3-bed/1.0-bath single-family listed at $90k.
Deal economics
- At list price, monthly cash flow is $653 ($8k/yr) — positive.
- The deal already cash-flows at list — no discount required.
- Meets the 1% rule at list price ($2k rent vs $90k).
- Cap rate 15.0% vs local median 3.2% in Salem — top-decile yield for the area; either an underpriced asset or a hidden risk that comps aren't pricing in. Stress-test before assuming the spread holds.
Location & tenants
- Location reads 65/100 on livability (#148 in AR) — a middle-class / working-renter tenant base. Strengths: cost of living A+; Watch: amenities F, commute F, employment F.
- Bryant School District (suburban): math 49% / reading 48% proficiency, ranked #16 of 238 in AR (top 7%) — families likely to look elsewhere, expect single-tenant / working-renter base with shorter leases.
- Zoned schools: Salem Elementary School (math 56% / reading 41%, grade D, #109 of 454 statewide, top 25%, 479 students, 46% FRL); Bethel Middle School (math 62% / reading 58%, grade B, #11 of 201 statewide, top 5%, 709 students, 43% FRL); Bryant High School (math 32% / reading 50%, grade F, #43 of 292 statewide, top 15%, 2,199 students, 47% FRL).
- Market conditions: Rents rising fast (+4.5%/yr); 237 active listings in the ZIP; 2 comparable units currently listed for rent nearby; solid renter incomes; 446 units permitted in Saline County in 2024 (0 in 5+ unit buildings).
Forward outlook
- Local home prices are declining (-3.0%/yr); year-one equity from $622 of loan paydown is wiped out by about $3k of value loss. Plan a longer hold.
- Saline County population projected at +39% by 2050 — long-run rental-demand tailwind backs the buy-and-hold thesis.
- At projected returns (-3.0% appreciation + 4.5% rent growth), your $25k cash investment doubles in ~4 years — after that, you're playing with house money.
Negotiation context
- Only 10 days on market — expect competitive offers; lowballing is unlikely to land.
- 5 sale attempts since 14y ago with the ask held roughly flat each time — persistent listings suggest the price (not the market) is what's stuck; bring a comps-based counter.
Risks & watch-outs
- Climate carrying-cost: extreme-heat days projected 7→19/yr by 2055 (HVAC capex compounding) — expect insurance premiums to compound above CPI over the hold.
Questions for the listing agent
- Built in 1971 — when were the roof, HVAC, electrical panel, plumbing, and water heater last replaced?
- Is there a deadline driving the sale (1031 exchange, divorce, estate, relocation)? That informs how much negotiation room exists.
- Schools are B-rated — typically a magnet for longer-tenancy family renters. What's the average tenant stay here, and is there a school-zone premium baked into asking?
- What's the average days-on-market for RENTAL listings here right now (not sales)? A rising rental-DOM trend means longer vacancies and softer asking-rent achievability than the comps imply.
- What's the recent tenant-quality profile in this submarket — average credit score on applications, eviction rate, late-payment / NSF rate, and stable-employment percentage? A property-management company in the area should have these aggregated.
- How much new for-sale + rental construction is in the pipeline within 1–3 miles? Heavy new supply typically softens prices + rents 12–24 months out; constrained supply supports both.
Investment metrics
- 1% rule
- 1.70% ✓
- Cap rate
- 15.01%
- Cash-on-cash
- 31.12%
- DSCR
- 2.38
- GRM
- 4.9
CMA / ARV
- ARV (on-the-fly)
- $174,636
- Comps found
- 12
Show comp detail 12 sales within ~0.75 mi
| Address | Dist | Beds/Ba | Sqft | Sold | Price | $/sf | Match |
|---|---|---|---|---|---|---|---|
| 2725 Burchwood Dr | 0.04mi | 3/1.5 | 1,148 (-3%) | 8mo | $150,000 | $131 | 83 |
| 2696 Lakeside Dr Dr | 0.09mi | 4/1.5 (+1) | 1,280 (+8%) | 1mo | $158,000 | $123 | 75 |
| 5883 Edgewood Dr | 0.12mi | 3/1.5 | 1,125 (-5%) | 12mo | $178,000 | $158 | 73 |
| 2601 Lakeside Dr | 0.15mi | 3/2.0 | 1,300 (+9%) | 6mo | $195,000 | $150 | 68 |
| 2702 Indian Hills Rd | 0.17mi | 3/2.0 | 1,280 (+8%) | 9mo | $190,000 | $148 | 68 |
| 6707 Grayson | 0.38mi | 3/2.0 | 1,239 (+4%) | 13mo | $191,500 | $155 | 60 |
| 2875 Lakeland | 0.12mi | 4/1.0 (+1) | 1,325 (+12%) | 13mo | $188,500 | $142 | 60 |
| 2816 Burchwood Dr | 0.11mi | 2/2.0 (-1) | 1,312 (+10%) | 15mo | $175,000 | $133 | 56 |
| 6707 Kimberly Dr | 0.45mi | 3/1.5 | 1,092 (-8%) | 22mo | $160,000 | $147 | 45 |
| 6690 Garvin Dr | 0.58mi | 3/2.0 | 1,248 (+5%) | 21mo | $165,000 | $132 | 43 |
| 6505 Rolla Rd | 0.54mi | 3/2.0 | 1,323 (+11%) | 12mo | $229,000 | $173 | 42 |
| 3625 Scott Salem Rd | 0.63mi | 2/1.0 (-1) | 1,076 (-9%) | 21mo | $149,900 | $139 | 32 |
Match score weights: distance 35% · size 25% · config 20% · recency 20%. Top-matched comps best support the ARV.
Projected returns pro-forma
-3.0% appreciation · 4.53% rent growth · sell at horizon
- IRR
- 27.5%
- Equity multiple
- 2.17×
- Total profit
- $29,374
- Equity at exit
- $13,404
- IRR
- 35.9%
- Equity multiple
- 4.54×
- Total profit
- $89,144
- Equity at exit
- $7,773
Cash invested: $25,172 (down + closing). Projections, not guarantees.
Landlord ↔ Tenant lean methodology
- Overall (STATE)
- 92 Strongly Landlord-Friendly
- State Arkansas
- 92 Strongly Landlord-Friendly · R+14
- County
- — inherits STATE
- City
- — inherits STATE
ZIP-level market 72019
- Home prices YoY
- -12.2%
- Rents YoY
- 4.5%
- Active inventory
- 237
- Price-to-rent
- 4.9×
Monthly cashflow live
- Estimated rent
- $1,528 medium interval (Pro) →
- Mortgage (P&I)
- −$471
- Tax from tax record
- −$45 /mo · $543/yr
- Insurance
- −$37
- HOA
- −$0
- Vacancy / Maint / Mgmt
- −$321
- Net cashflow
- $653
Break-even live
Sensitivity live
| Price | -10% $704 | -5% $678 | +0% $653 | +5% $627 | +10% $602 |
|---|---|---|---|---|---|
| Rent | -10% $532 | -5% $592 | +0% $653 | +5% $713 | +10% $773 |
| Rate | -1.0pp $698 | -0.5pp $676 | base $653 | +0.5pp $629 | +1.0pp $606 |
UW: 25.0% down · 7.5% · 30yr · 1.5% tax · 5.0% vac · 8.0% maint · 8.0% mgmt
Financing live
Cash to close
- Down payment
- $22,475
- Closing costs
- $2,697
- Reserves months
- —
- Total cash needed
- —
Loan-product check · same deal, 3 products live
Conventional
25% down · 7.5% · 30yr
- Down + closing
- —
- Monthly P&I
- —
- Monthly cashflow
- —
- DSCR
- —
- Eligible?
- —
Personal DTI + credit; lowest rate.
DSCR
20% down · 8.5% · 30yr
- Down + closing
- —
- Monthly P&I
- —
- Monthly cashflow
- —
- DSCR
- —
- Eligible?
- —
No personal income docs; deal must DSCR.
Hard money
10% down · 12.0% · 12mo
- Down + closing
- —
- Monthly P&I
- —
- Monthly cashflow
- —
- DSCR
- —
- Eligible?
- —
Short-term bridge; refi at stabilization.
Rent comps 2 comps
| Address | Beds | Baths | Sqft | Rent | $/sqft | DOM | Units | Dist |
|---|---|---|---|---|---|---|---|---|
| 1907 Arkansas 5 Benton, AR | 1.0–2.0 | 1.0–2.0 | 752 | $915 | $1.22 | 15d | 1 | 0.94mi |
| 2600 Longhills Rd E Benton, AR | 1.0–2.0 | 1.0–2.0 | 818 | $1,255 | $1.53 | 15d | 1 | 1.29mi |
Listing history 10 events
-
2026-06-16status $89,900 Under Contract 10 DOM
-
2026-06-13statusdays on market $89,900 Pending (FC, SS, REO) 10 DOM
-
2026-06-10days on market $89,900 Active 9 DOM
-
2026-06-09days on market $89,900 Active 8 DOM
-
2026-06-08statusdays on market $89,900 Active 7 DOM
-
2026-06-07days on market $89,900 New Listing 6 DOM
-
2026-06-05days on market $89,900 New Listing 3 DOM
-
2026-06-03days on market $89,900 New Listing 2 DOM
-
2026-06-01remarks 699-char remark
-
2026-06-01$89,900 New Listing 1 DOM
ⓘ Source: listings_history table (triggers on properties + properties_extension) + one-shot
backfill from property_details.listing_events for pre-trigger history.
Tax reassessment forecast AR · Resets to sale price
- Current annual tax
- $543 · $45/mo
- Projected year-2 tax
- $575 · $48/mo
- Expected delta
- +$32/yr (+$3/mo · 5.9%)
ⓘ Screening estimate from a state-policy table — verify with the county assessor before closing.
Climate risk First Street
- Flood 1/10 Low FEMA zone X (unshaded) · 0% chance over 30 yrs
- Wildfire 4/10 Moderate
- Heat 6/10 Major 7 d/yr ≥111°F today · 19 d/yr by 30 yrs out
- Wind 4/10 Moderate 12% chance of damaging wind over 30 yrs
- Air quality 2/10 Low 0 unhealthy d/yr today · 1 by 30 yrs out
Nearby sold comps map
Loading sold comps map…
Walkable amenities ~0.75 mi
Loading nearby amenities…
Taxation est. · year 1
- Rental income
- $18,333
- − Mortgage interest
- −$5,036
- − Property taxes
- −$543
- − Insurance
- −$450
- − Repairs & maintenance
- −$1,467
- − Management
- −$1,467
- − Depreciation
- −$2,615
- Taxable income
- $6,756
- Est. tax owed @ 24.0%
- −$1,621
- After-tax cash flow
- $6,211/yr
For passive investors: Depreciation is non-cash, so a rental often shows a tax loss while cash-flowing — sheltering income. Rental losses are passive: they offset passive income freely, and up to $25,000/yr can offset ordinary (W-2) income if you actively participate and your MAGI is under $100k (phasing out to $0 by $150k); unused losses carry forward. On sale, claimed depreciation is recaptured at up to 25%, and gains may owe capital-gains tax (a 1031 exchange can defer both). Figures are a year-1 estimate at your 24.0% rate — not tax advice; consult a CPA.
Schools (NCES district)
- District
- Bryant School District
- NCES district ID
- 0503690
- Math proficiency
- 49% ▼ -13.00%
- Reading proficiency
- 48% ▼ -8.00%
- Median HH income
- $57,578
- Composite
- 42.28/100
- National rank
- #3266
- State rank
- #16 of 238 in AR
Livability — Salem
- Score
- 65/100
- State rank
- #148
- US rank
- #12757
Category grades
Schools grade is shown separately in the Schools card above.
Census & demographics
- Census place
- Salem, AR
- County
- Saline County · 77,216 people
- Metro
- Little Rock-North Little Rock-Conway, AR
- Population (ZIP)
- 30,055
- Household income
- $87,869
- Rent vs Own
- Severe rent burden
- 331.0
Population outlook (Saline County) Hauer SSP2
- Today (2025)
- 140,141 people
- By 2030
- 151,233 · +7.9%
- By 2040
- 173,100 · +23.5%
- By 2050
- 194,368 · +38.7%
- By 2075
- 245,295 · +75.0%
- By 2100
- 279,117 · +99.2%
Race, ethnicity, and origin ACS 2023
- Neighborhood character
- Predominantly White (83%)
- Race & ethnicity
- White 83% Hispanic / Latino 8% Two or more races 5% Black 3% Asian 2%
- Hispanic origin (detail)
- Mexican 6%
- Common ancestry
- Italian 3% Slovak 2% Lithuanian 2%
- Foreign-born
- 3% · Canada, China, Vietnam
- Languages at home
- 92% English-only · Spanish 6% Vietnamese 1%
Political lean MEDSL · Saline
- 2024 margin
- Solid R (+40.1) · D 28.8% · R 69.0% · Other 2.2%
- 2008→2024 swing
- +0.8pp no change · 2008: -41.0pp · 2024: -40.1pp
- All cycles
- 2024: R+40.1 2020: R+41.2 2016: R+43.5 2012: R+42.7 2008: R+41.0
Not yet ingested
- Civics
- —
Market trends
- HPI YoY
- ▼ -29.95%
- Current HPI
- 215.1912
- Rent YoY
- ▲ 4.53%
- Metro
- Little Rock-North Little Rock-Conway, AR
- State GDP YoY
- ▲ 3.80%
- F500 in state
- 10
Industry mix (Fortune 500 HQ in AR)
| Industry | F500 HQs | Revenue |
|---|---|---|
| Retail | 1 | $681B |
|
||
| Food / Agriculture | 1 | $53B |
|
||
| Retail / Energy | 1 | $22B |
|
||
| Transportation / Logistics | 1 | $12B |
|
||
| Energy | 1 | $4B |
|
||
Price history
+79.8% since first listed20 events — show timeline
- 2022-06-01 Listed $89,900 CARMLS
- 2019-06-05 Pending — CARMLS
- 2019-06-04 Sold (Public Records) $97,500 Public Records
- 2019-06-03 Sold (MLS) $97,500 CARMLS
- 2019-05-06 Contingent — CARMLS
- 2019-02-16 Relisted — CARMLS
- 2019-02-11 Contingent — CARMLS
- 2019-01-23 Price Changed $100,000 CARMLS
- 2019-01-02 Listed $105,000 CARMLS
- 2019-01-01 Listing Removed — CARMLS
- 2018-10-30 Price Changed $99,900 CARMLS
- 2018-10-09 Price Changed $102,000 CARMLS
- 2018-09-17 Price Changed $104,900 CARMLS
- 2018-09-05 Listed $107,900 CARMLS
- 2012-06-04 Sold (Public Records) $95,000 Public Records
- 2012-05-31 Sold (MLS) $95,000 CARMLS
- 2012-04-25 Listing Removed — CARMLS
- 2012-02-27 Listed $95,000 CARMLS
- 2007-03-30 Sold (Public Records) $93,000 Public Records
- 1995-10-18 Sold (Public Records) $50,000 Public Records
Property tax history
+2.8%/yrLatest (2025): $543 · -9.5% YoY. Source: county tax records.
Cash-flow waterfall
monthlySold comps — $/sqft
last 12 mo · ≤1 miLoading sold comps…