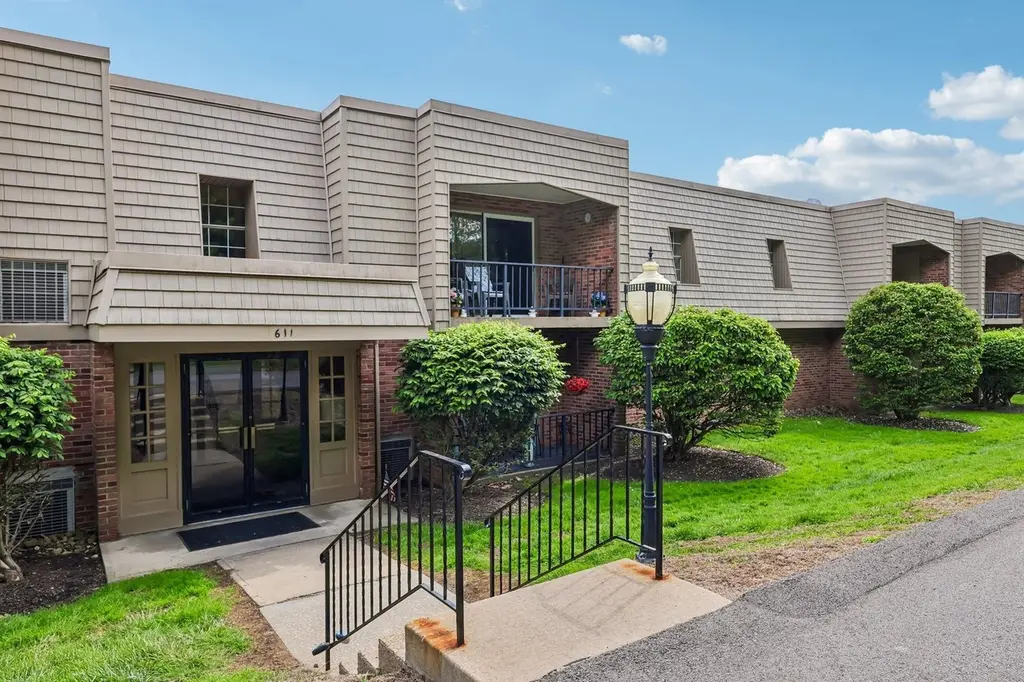
611 Calais Dr #4204 · Franklin Park, PA
Flood risk No data
- FEMA flood zone
- —
- Chance of flooding over 30 yrs
- —
- Est. flood insurance / yr
- —
Fire risk No data
- Est. fire insurance / yr
- —
Heat risk No data
- Hot days now (above threshold)
- —
- Hot days in 30 yrs
- —
Wind risk No data
- Chance of severe wind over 30 yrs
- —
Air-quality risk No data
- Unhealthy air days now
- —
- Unhealthy air days in 30 yrs
- —
Risk factors via First Street. Map © Google.
Why this score? — see what drove the D grade
The composite is a weighted blend of 9 inputs, each scored 0–100. Each bar is that input's sub-score; the figure is the points it added to the 100-point composite (weight × sub-score).
- Cash flow +11.2/30.0
- ARV discount +7.5/15.0
- Schools +6.6/10.0
- 1% rule +6.1/10.0
- DSCR +3.3/10.0
- Livability +3.3/5.0
- Rent growth +3.0/5.0
- Condition / age +2.5/5.0
- Appreciation +0.0/10.0
$137,500
🖨 Deal sheet (PDF) 📄 Offer letter ✓ Due diligence
Listing remarks
Experience easy, maintenance-free living in the highly desirable Calais Village community. This inviting condo offers a bright open floor plan complemented by neutral decor throughout. The sun-filled living and dining areas feature double glass doors that open to a spacious covered balcony—perfect for relaxing or entertaining. The fully equipped kitchen provides both functionality and convenience. The generously sized primary bedroom includes a large double-door closet, while the updated bathroom and additional hall closet offer excellent storage space. Additional conveniences include a security intercom system and garage parking for a truly low-maintenance lifestyle. Enjoy the peacef
Key facts
- Open floor plan
- Covered balcony
- Community pool
Tags
Property features AI
Finance
- HOA & community: Monthly association fee of $337
Exterior
- Parking: 1 parking space
- Utilities: Public water; Public sewer
- Home design: Condominium (unit); Resale property
- Construction: Brick and vinyl siding exterior; Asphalt roof
- Exterior features: Private pool
Interior
- Kitchen: Dishwasher; Microwave; Refrigerator; Stove; Some electric appliances
- Flooring: Carpet
- Bathrooms: 1 full bathroom
- Heating & cooling: Central air conditioning; Forced air heating; Gas heating
- Interior features: Carpet flooring; Resale condition
Neighborhood map
What this means for you Summary
Snapshot
- This is a 1-bed/1.0-bath condo listed at $138k.
Deal economics
- At list price, monthly cash flow is $-54 ($-649/yr) — negative.
- To cash-flow at today's rent, offer at most $128k (6.9% below list).
- Meets the 1% rule at list price ($2k rent vs $138k).
- Recommended offer: $128k (6.9% below list) — sets the bar for cash-flow.
- Cap rate 5.8% vs local median 2.4% in Franklin Park — top-decile yield for the area; either an underpriced asset or a hidden risk that comps aren't pricing in. Stress-test before assuming the spread holds.
Location & tenants
- Location reads 66/100 on livability (#1,070 in PA) — a middle-class / working-renter tenant base. Strengths: crime A+, employment A+, housing A+; Watch: amenities F, commute F, cost of living F.
- North Allegheny SD (suburban): math 64% / reading 82% proficiency, ranked #14 of 539 in PA (top 3%) — strong family-tenant draw, lease renewals of 3-5y typical; only 4% free/reduced lunch — higher-income household profile.
- Zoned schools: Mcknight El Sch (math 61% / reading 74%, grade B+, #192 of 1,518 statewide, top 13%, 798 students, 16% FRL); Ingomar Ms (math 48% / reading 80%, grade B+, #26 of 512 statewide, top 5%, 572 students, 6% FRL); North Allegheny Hs (math 81%, 2,666 students, 8% FRL).
- Market conditions: Rents rising (+2.2%/yr); 107 active listings in the ZIP; 3 comparable units currently listed for rent nearby; rentals leasing fast (median 4d on market — plan ~1-2 weeks tenant-placement turnaround); solid renter incomes; 2,996 units permitted in Allegheny County in 2024 (1,588 in 5+ unit buildings).
- This rent is only 17% of the median local income ($110k/yr) — well below the 30% rent-burden line; pricing power to push rent on renewal without tenant pushback.
Forward outlook
- Local home prices are declining (-3.0%/yr); year-one equity from $951 of loan paydown is wiped out by about $4k of value loss. Plan a longer hold.
Negotiation context
- Only 4 days on market — expect competitive offers; lowballing is unlikely to land.
- Current owner paid $60k; list at $138k implies a 129% gain — meaningful room to come down on a strong offer.
Risks & watch-outs
- Watch-outs: HOA is 22% of rent.
Questions for the listing agent
- What do current leases actually rent for vs. the listed asking? Can we see a recent rent roll and the last 12 months of T-12 income?
- Built in 1975 — when were the roof, HVAC, electrical panel, plumbing, and water heater last replaced?
- What does the HOA fee cover, when was the last increase, and are there any pending special assessments or reserve-fund shortfalls?
- Any open or pending special assessments — roof, HVAC, plumbing, elevator, façade? What's the per-unit balance and payoff schedule, and is the seller paying it off at close or rolling it to the buyer?
- Is there a deadline driving the sale (1031 exchange, divorce, estate, relocation)? That informs how much negotiation room exists.
- Schools are D-rated, which usually means shorter tenancies and higher turnover. Who's the typical renter profile here, and what's been the actual vacancy rate?
- The area grade is low — what's the realistic commute time and amenity access for the typical tenant pool here? Any planned neighborhood developments (good or bad) we should know about?
- What's the average days-on-market for RENTAL listings here right now (not sales)? A rising rental-DOM trend means longer vacancies and softer asking-rent achievability than the comps imply.
- What's the recent tenant-quality profile in this submarket — average credit score on applications, eviction rate, late-payment / NSF rate, and stable-employment percentage? A property-management company in the area should have these aggregated.
- How much new apartment / multifamily construction is in the pipeline within 1–3 miles? Heavy new supply (>2% of stock underway) typically softens rents 12–24 months out; light construction supports rent growth.
Investment metrics
- 1% rule
- 1.11% ✓
- Cap rate
- 5.82%
- Cash-on-cash
- -1.68%
- DSCR
- 0.93
- GRM
- 7.5
CMA / ARV
No comps found within radius.
Projected returns pro-forma
-3.0% appreciation · 2.16% rent growth · sell at horizon
- IRR
- -20.1%
- Equity multiple
- 0.30×
- Total profit
- $-26,790
- Equity at exit
- $20,502
- IRR
- -15.4%
- Equity multiple
- 0.17×
- Total profit
- $-32,059
- Equity at exit
- $11,888
Cash invested: $38,500 (down + closing). Projections, not guarantees.
Landlord ↔ Tenant lean methodology
- Overall (STATE)
- 62 Landlord-Friendly
- State Pennsylvania
- 62 Landlord-Friendly · EVEN
- County
- — inherits STATE
- City
- — inherits STATE
ZIP-level market 15237
- Rents YoY
- 2.2%
- Active inventory
- 107
- Price-to-rent
- 7.5×
Monthly cashflow live
- Estimated rent
- $1,528 medium interval (Pro) →
- Mortgage (P&I)
- −$721
- Tax from tax record
- −$146 /mo · $1,754/yr
- Insurance
- −$57
- HOA
- −$337
- Lot rent
- −$0
- Vacancy / Maint / Mgmt
- −$321
- Net cashflow
- $-54
Break-even live
Sensitivity live
| Price | -10% $24 | -5% $-15 | +0% $-54 | +5% $-93 | +10% $-132 |
|---|---|---|---|---|---|
| Rent | -10% $-175 | -5% $-114 | +0% $-54 | +5% $6 | +10% $67 |
| Rate | -1.0pp $15 | -0.5pp $-19 | base $-54 | +0.5pp $-90 | +1.0pp $-126 |
UW: 25.0% down · 7.5% · 30yr · 1.5% tax · 5.0% vac · 8.0% maint · 8.0% mgmt
Financing live
Cash to close
- Down payment
- $34,375
- Closing costs
- $4,125
- Reserves months
- —
- Total cash needed
- —
Loan-product check · same deal, 3 products live
Conventional
25% down · 7.5% · 30yr
- Down + closing
- —
- Monthly P&I
- —
- Monthly cashflow
- —
- DSCR
- —
- Eligible?
- —
Personal DTI + credit; lowest rate.
DSCR
20% down · 8.5% · 30yr
- Down + closing
- —
- Monthly P&I
- —
- Monthly cashflow
- —
- DSCR
- —
- Eligible?
- —
No personal income docs; deal must DSCR.
Hard money
10% down · 12.0% · 12mo
- Down + closing
- —
- Monthly P&I
- —
- Monthly cashflow
- —
- DSCR
- —
- Eligible?
- —
Short-term bridge; refi at stabilization.
Rent comps 3 comps
| Address | Beds | Baths | Sqft | Rent | $/sqft | DOM | Units | Dist |
|---|---|---|---|---|---|---|---|---|
| 553 Sloop Rd #48 Pittsburgh, PA | 2.0 | 1.5 | 1001 | $1,699 | $1.70 | 46d | 1 | 0.17mi |
| 1050 N 19 Dr Pittsburgh, PA | 1.0–2.0 | 1.0–1.5 | 890 | $1,370 | $1.54 | 4d | 7 | 0.66mi |
| 425 Cumberland Rd Pittsburgh, PA | 2.0 | 1.0 | 875 | $1,350 | $1.54 | 0d | 1 | 1.30mi |
HOA detail condo
- Monthly dues
- $337 · $4,044/yr
- Likely covers
- security
- Assessments
- None detected in remarks — confirm with the listing agent.
Listing history 5 events
-
2026-05-12status Pending
-
2026-05-08$137,500 Active
-
2015-05-27soldstatus $60,000
-
1998-06-04soldstatus $54,900
-
1992-08-14soldstatus $44,000
ⓘ Source: listings_history table (triggers on properties + properties_extension) + one-shot
backfill from property_details.listing_events for pre-trigger history.
Tax reassessment forecast PA · Partial reset (capped growth)
- Current annual tax
- $1,754 · $146/mo
- Projected year-2 tax
- $1,963 · $164/mo
- Expected delta
- +$209/yr (+$17/mo · 11.9%)
ⓘ Screening estimate from a state-policy table — verify with the county assessor before closing.
Nearby sold comps map
Loading sold comps map…
Walkable amenities ~0.75 mi
Loading nearby amenities…
Taxation est. · year 1
- Rental income
- $18,341
- − Mortgage interest
- −$7,702
- − Property taxes
- −$1,754
- − Insurance
- −$688
- − Repairs & maintenance
- −$1,467
- − Management
- −$1,467
- − HOA
- −$4,044
- − Depreciation
- −$4,000
- Taxable loss
- −$2,781
- Est. tax savings @ 24.0%
- +$667
- After-tax cash flow
- $19/yr
For passive investors: Depreciation is non-cash, so a rental often shows a tax loss while cash-flowing — sheltering income. Rental losses are passive: they offset passive income freely, and up to $25,000/yr can offset ordinary (W-2) income if you actively participate and your MAGI is under $100k (phasing out to $0 by $150k); unused losses carry forward. On sale, claimed depreciation is recaptured at up to 25%, and gains may owe capital-gains tax (a 1031 exchange can defer both). Figures are a year-1 estimate at your 24.0% rate — not tax advice; consult a CPA.
Schools (NCES district)
- District
- North Allegheny SD
- NCES district ID
- 4217010
- Math proficiency
- 64% ▼ -7.00%
- Reading proficiency
- 82% ▼ -4.00%
- Median HH income
- $92,518
- Composite
- 65.85/100
- National rank
- #452
- State rank
- #14 of 539 in PA
Livability — Franklin Park
- Score
- 66/100
- State rank
- #1070
- US rank
- #12082
Category grades
Schools grade is shown separately in the Schools card above.
Census & demographics
- County
- Allegheny County · 1,022,028 people
- Metro
- Pittsburgh, PA
- Population (ZIP)
- 43,588
- Household income
- $109,895
- Rent vs Own
- Severe rent burden
- 693.0
Population outlook (Allegheny County) Hauer SSP2
- Today (2025)
- 1,250,282 people
- By 2030
- 1,256,482 · +0.5%
- By 2040
- 1,256,318 · +0.5%
- By 2050
- 1,244,169 · -0.5%
- By 2075
- 1,197,693 · -4.2%
- By 2100
- 1,093,187 · -12.6%
Race, ethnicity, and origin ACS 2023
- Neighborhood character
- Predominantly White (88%)
- Race & ethnicity
- White 88% Asian 6% Two or more races 3% Hispanic / Latino 3% Black 1%
- Common ancestry
- Romanian 8% Italian 2% Slovak 2%
- Foreign-born
- 8% · Canada, China
- Languages at home
- 90% English-only · Other Indo-European 2% Chinese 2% Spanish 2%
Political lean MEDSL · Allegheny
- 2024 margin
- Strong D (+20.3) · D 59.7% · R 39.4%
- 2008→2024 swing
- +4.8pp toward D · 2008: 15.5pp · 2024: 20.3pp
- All cycles
- 2024: D+20.3 2020: D+20.4 2016: D+16.4 2012: D+14.4 2008: D+15.5
Not yet ingested
- Civics
- —
Market trends
- HPI YoY
- ▼ -218.78%
- Current HPI
- 269.5446
- Rent YoY
- ▲ 2.16%
- Metro
- Pittsburgh, PA
- State GDP YoY
- ▲ 1.68%
- F500 in state
- 34
Industry mix (Fortune 500 HQ in PA)
| Industry | F500 HQs | Revenue |
|---|---|---|
| Healthcare | 2 | $309B |
|
||
| Insurance | 2 | $27B |
|
||
| Telecommunications / Media | 1 | $124B |
|
||
| Industrial Distribution | 1 | $22B |
|
||
| Financial Services | 1 | $20B |
|
||
| Chemicals / Materials | 1 | $18B |
|
||
Price history
+212.5% since first listed5 events — show timeline
- 2026-05-12 Pending — West Penn MLS
- 2026-05-08 Listed $137,500 West Penn MLS
- 2015-05-27 Sold (Public Records) $60,000 Public Records
- 1998-06-04 Sold (Public Records) $54,900 Public Records
- 1992-08-14 Sold (Public Records) $44,000 Public Records
Property tax history
+4.3%/yrLatest (2026): $1,754 · +0.0% YoY. Source: county tax records.
Cash-flow waterfall
monthlySold comps — $/sqft
last 12 mo · ≤1 miLoading sold comps…