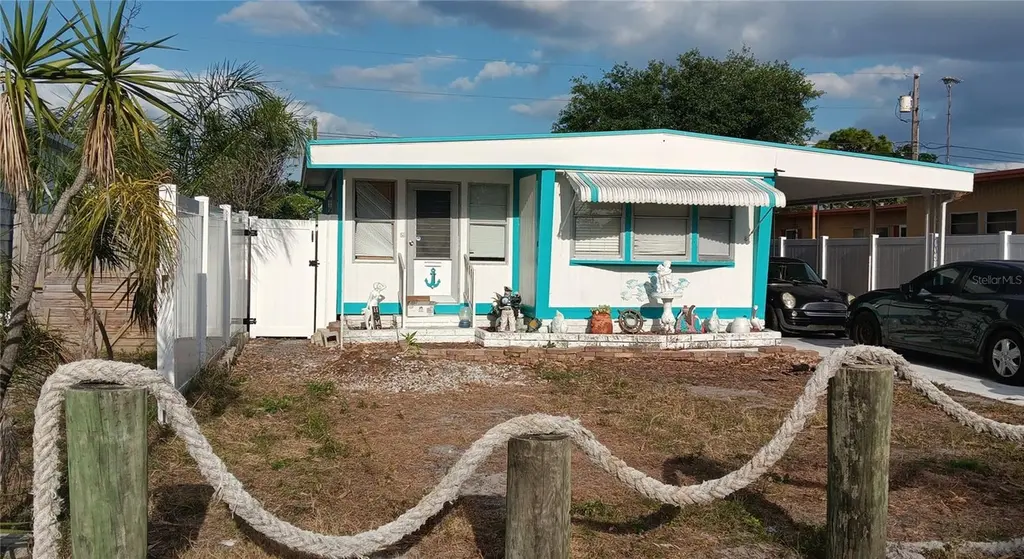
5315 Park St E · West Lealman, FL
Flood risk 7/10 · Major
- FEMA flood zone
- X (shaded)
- Chance of flooding over 30 yrs
- 0.73%
- Est. flood insurance / yr
- $507 – $1,088
Fire risk 1/10 · Minimal
- Est. fire insurance / yr
- $947 – $1,759
Heat risk 10/10 · Severe
- Hot days now (above 107°F)
- 7 days/yr
- Hot days in 30 yrs
- 25 days/yr
Wind risk 10/10 · Severe
- Chance of severe wind over 30 yrs
- 99.0%
Air-quality risk 4/10 · Minor
- Unhealthy air days now
- 4 days/yr
- Unhealthy air days in 30 yrs
- 4 days/yr
Risk factors via First Street. Map © Google.
Why this score? — see what drove the B grade
The composite is a weighted blend of 9 inputs, each scored 0–100. Each bar is that input's sub-score; the figure is the points it added to the 100-point composite (weight × sub-score).
- Cash flow +30.0/30.0
- ARV discount +11.2/15.0
- 1% rule +10.0/10.0
- DSCR +10.0/10.0
- Schools +4.3/10.0
- Livability +4.0/5.0
- Rent growth +2.7/5.0
- Condition / age +2.5/5.0
- Appreciation +0.0/10.0
$89,400
🖨 Deal sheet (PDF) 📄 Offer letter ✓ Due diligence
Listing remarks MLS
QUIET, CLEAN, AFFORDABLE LIVING, JUST MINUTES FROM THE BEACHES! 1 BEDROOM WITH PLENTY OF ROOM - 844 SF - WITH AN ENCLOSED PORCH WHICH CAN BE USED AS EXTRA ROOM. NEAR SHOPPING MALL, VA HOSPITAL. OWNER HAS ADDED MANY NICE TOUCHES. LARGE SHEDWITH WORKSHOP. 2ND SHED IS LAUNDRY ROOM. BACK YARD HAS PLENTY OF PRIVACY. COMPETITIVELY PRICED FOR QUICK SALE. MOTIVATED SELLER. HOME WARRANTY WITH FULL ASKING PRICE.
Key facts
- Land included
- Private setting
- No hoa
Tags
Property features AI
Finance
- Financial info: No lease restrictions reported
- HOA & community: No HOA association indicated
Exterior
- Parking: Has carport (1 space)
- Utilities: Public water; Public sewer; Electricity connected; Water connected; Sewer connected; Cable available
- Home design: Single wide mobile home; One story; Faces west; Residential property
- Construction: Metal frame with metal siding; Metal roof; Pillar/post/pier foundation; Built on a 0.08-acre lot (approximately 41 x 80)
- Exterior features: Awnings; Private mailbox; Asphalt road frontage
Interior
- Kitchen: Range; Refrigerator; Electric water heater
- Bedrooms: 2 bedrooms (one-level home)
- Flooring: Carpet; Laminate
- Bathrooms: 1 full bathroom
- Heating & cooling: Central heating (electric); Central air conditioning
- Interior features: Ceiling fans
- Laundry & utility: Electric dryer hookup
Neighborhood map
What this means for you Summary
Snapshot
- This is a 2-bed/1.0-bath manufactured listed at $89k.
Deal economics
- At list price, monthly cash flow is $597 ($7k/yr) — positive.
- The deal already cash-flows at list — no discount required.
- Meets the 1% rule at list price ($2k rent vs $89k).
- Cap rate 15.2% vs local median 1.8% in West Lealman — top-decile yield for the area; either an underpriced asset or a hidden risk that comps aren't pricing in. Stress-test before assuming the spread holds.
Location & tenants
- Location reads 81/100 on livability (#84 in FL, #1,396 nationally) — a professional / high-income tenant draw. Strengths: commute A+, cost of living A+, housing A+; Watch: employment D+, amenities F.
- Pinellas (suburban): math 51% / reading 51% proficiency, ranked #31 of 73 in FL (top 42%) — acceptable for families but not a draw, mixed tenant base, ~2y average lease.
- Zoned schools: Seventy-Fourth St. Elementary (math 30% / reading 22%, grade F, #2,015 of 2,144 statewide, top 94%, 444 students, 72% FRL); Dixie M. Hollins High School (math 30% / reading 40%, grade F, #379 of 667 statewide, top 58%, 1,822 students, 56% FRL) — zoned schools average 64% FRL vs 48% district-wide (16 pts higher); higher-poverty schools than district average — tighter screening recommended.
- Zoned-school proficiency averages 30% at this address vs 51% district-wide (-20 pts) — the specific schools serving this property underperform the Pinellas average; the district grade overstates school quality for this exact location.
- Market conditions: Rents flat; 309 active listings in the ZIP; 13 comparable units currently listed for rent nearby; rentals at typical pace (median 25d on market — plan ~3-4 weeks tenant-placement turnaround); 2,676 units permitted in Pinellas County in 2024 (1,422 in 5+ unit buildings).
Forward outlook
- Local home prices are declining (-3.0%/yr); year-one equity from $618 of loan paydown is wiped out by about $3k of value loss. Plan a longer hold.
- Pinellas County population projected at +14% by 2050 — modest demand growth; plan on rents tracking national, not racing it.
- At projected returns (-3.0% appreciation + 1.0% rent growth), your $25k cash investment doubles in ~5 years — after that, you're playing with house money.
Negotiation context
- Only 2 days on market — expect competitive offers; lowballing is unlikely to land.
- 2 sale attempts since 20y ago; this cycle's ask is 5% above the opening price — seller raised mid-cycle; expect resistance to lowballs.
- Current owner paid $55k; list at $89k implies a 63% gain — meaningful room to come down on a strong offer.
Risks & watch-outs
- Watch-outs: flood insurance adds $66/mo.
- Climate carrying-cost: major flood risk; severe wind risk, 99% chance of damaging wind over 30y; extreme-heat days projected 7→25/yr by 2055 (HVAC capex compounding) — expect insurance premiums to compound above CPI over the hold.
Questions for the listing agent
- Built in 1971 — when were the roof, HVAC, electrical panel, plumbing, and water heater last replaced?
- What's the actual annual flood-insurance premium (NFIP or private), and is the property in a SFHA with mandatory coverage?
- Is there a deadline driving the sale (1031 exchange, divorce, estate, relocation)? That informs how much negotiation room exists.
- What's the average days-on-market for RENTAL listings here right now (not sales)? A rising rental-DOM trend means longer vacancies and softer asking-rent achievability than the comps imply.
- What's the recent tenant-quality profile in this submarket — average credit score on applications, eviction rate, late-payment / NSF rate, and stable-employment percentage? A property-management company in the area should have these aggregated.
- How much new for-sale + rental construction is in the pipeline within 1–3 miles? Heavy new supply typically softens prices + rents 12–24 months out; constrained supply supports both.
Investment metrics
- 1% rule
- 1.82% ✓
- Cap rate
- 15.20%
- Cash-on-cash
- 31.82%
- DSCR
- 2.42
- GRM
- 4.6
CMA / ARV
- ARV (on-the-fly)
- $97,344
- Comps found
- 3
Show comp detail 3 sales within ~0.75 mi
| Address | Dist | Beds/Ba | Sqft | Sold | Price | $/sf | Match |
|---|---|---|---|---|---|---|---|
| 5320 W Pine St N | 0.07mi | 1/1.0 (-1) | 619 (-1%) | 10mo | $87,000 | $141 | 82 |
| 5245 E Park St N | 0.03mi | 2/1.0 | 672 (+8%) | 17mo | $105,000 | $156 | 71 |
| 5214 Yellow Pine St N | 0.20mi | 2/1.0 | 564 (-10%) | 14mo | $104,300 | $185 | 63 |
Match score weights: distance 35% · size 25% · config 20% · recency 20%. Top-matched comps best support the ARV.
Projected returns pro-forma
-3.0% appreciation · 0.99% rent growth · sell at horizon
- IRR
- 20.5%
- Equity multiple
- 1.81×
- Total profit
- $20,395
- Equity at exit
- $13,330
- IRR
- 27.3%
- Equity multiple
- 3.17×
- Total profit
- $54,313
- Equity at exit
- $7,730
Cash invested: $25,032 (down + closing). Projections, not guarantees.
Landlord ↔ Tenant lean methodology
- Overall (STATE)
- 87 Strongly Landlord-Friendly
- State Florida
- 87 Strongly Landlord-Friendly · R+3
- County
- — inherits STATE
- City
- — inherits STATE
ZIP-level market 33709
- Rents YoY
- 1.0%
- Active inventory
- 309
- Price-to-rent
- 4.6×
Monthly cashflow live
- Estimated rent
- $1,625 high interval (Pro) →
- Mortgage (P&I)
- −$469
- Tax from tax record
- −$114 /mo · $1,365/yr
- Insurance
- −$37
- Flood insurance flood zone
- −$66 /mo · $798/yr
- HOA
- −$0
- Vacancy / Maint / Mgmt
- −$341
- Net cashflow
- $597
Break-even live
Sensitivity live
| Price | -10% $648 | -5% $623 | +0% $597 | +5% $572 | +10% $547 |
|---|---|---|---|---|---|
| Rent | -10% $469 | -5% $533 | +0% $597 | +5% $661 | +10% $726 |
| Rate | -1.0pp $642 | -0.5pp $620 | base $597 | +0.5pp $574 | +1.0pp $550 |
UW: 25.0% down · 7.5% · 30yr · 1.5% tax · 5.0% vac · 8.0% maint · 8.0% mgmt
Financing live
Cash to close
- Down payment
- $22,350
- Closing costs
- $2,682
- Reserves months
- —
- Total cash needed
- —
Loan-product check · same deal, 3 products live
Conventional
25% down · 7.5% · 30yr
- Down + closing
- —
- Monthly P&I
- —
- Monthly cashflow
- —
- DSCR
- —
- Eligible?
- —
Personal DTI + credit; lowest rate.
DSCR
20% down · 8.5% · 30yr
- Down + closing
- —
- Monthly P&I
- —
- Monthly cashflow
- —
- DSCR
- —
- Eligible?
- —
No personal income docs; deal must DSCR.
Hard money
10% down · 12.0% · 12mo
- Down + closing
- —
- Monthly P&I
- —
- Monthly cashflow
- —
- DSCR
- —
- Eligible?
- —
Short-term bridge; refi at stabilization.
Rent comps 13 comps
| Address | Beds | Baths | Sqft | Rent | $/sqft | DOM | Units | Dist |
|---|---|---|---|---|---|---|---|---|
| 5257 81st Ln N #6 Saint Petersburg, FL | 1.0 | 1.0 | 745 | $1,375 | $1.85 | 25d | 1 | 0.27mi |
| 7317 46th Ave N Unit 4 St. Petersburg, FL | 1.0 | 1.0 | 528 | $1,200 | $2.27 | 14d | 1 | 0.65mi |
| 5140 70th St N Unit 3 St. Petersburg, FL | 1.0 | 1.0 | 450 | $1,200 | $2.67 | 25d | 1 | 0.74mi |
| 5411 70th Ln N Saint Petersburg, FL | 2.0 | 1.0 | 600 | $1,800 | $3.00 | 25d | 1 | 0.74mi |
| 4801 71st St N St Petersburg, FL | 2.0 | 1.0 | 726 | $1,900 | $2.62 | 18d | 1 | 0.76mi |
| 4801 71st St N Saint Petersburg, FL | 2.0 | 1.0 | 726 | $1,900 | $2.62 | 5d | 1 | 0.76mi |
| 6801 48th Ave N Unit B St. Petersburg, FL | 1.0 | 1.0 | 650 | $1,525 | $2.35 | 25d | 1 | 0.97mi |
| 8800 Bay Pines Blvd #320 Saint Petersburg, FL | 1.0 | 1.0 | 506 | $2,200 | $4.35 | 4d | 1 | 1.02mi |
| 4701 68th St N Saint Petersburg, FL | 1.0 | 1.0 | 700 | $1,099 | $1.57 | 25d | 1 | 1.02mi |
| 7801 34th Ave N #88 Saint Petersburg, FL | 2.0 | 1.0 | 624 | $1,300 | $2.08 | 2d | 1 | 1.12mi |
| 7801 34th Ave N #88 Saint Petersburg, FL | 2.0 | 1.0 | 624 | $1,400 | $2.24 | 25d | 1 | 1.12mi |
| 6522 54th Ave N Saint Petersburg, FL | 1.0–3.0 | 1.0–2.0 | 892 | $1,600 | $1.79 | 2d | 10 | 1.28mi |
| 6538 42nd Ave N Unit 7 Kenneth City, FL | 2.0 | 1.0 | 648 | $2,000 | $3.09 | 25d | 1 | 1.43mi |
Listing history 7 events
-
2026-05-03status Pending
-
2026-05-03price $89,400
-
2026-05-01$84,900 Active
-
2006-09-15soldstatus $55,000
-
2006-09-13soldstatus $55,000 405-char remark
Show marketing remark (405 chars)
QUIET, CLEAN, AFFORDABLE LIVING, JUST MINUTES FROM THE BEACHES! 1 BEDROOM WITH PLENTY OF ROOM - 844 SF - WITH AN ENCLOSED PORCH WHICH CAN BE USED AS EXTRA ROOM. NEAR SHOPPING MALL, VA HOSPITAL. OWNER HAS ADDED MANY NICE TOUCHES. LARGE SHEDWITH WORKSHOP. 2ND SHED IS LAUNDRY ROOM. BACK YARD HAS PLENTY OF PRIVACY. COMPETITIVELY PRICED FOR QUICK SALE. MOTIVATED SELLER. HOME WARRANTY WITH FULL ASKING PRICE.
-
2006-06-06$65,000 405-char remark
Show marketing remark (405 chars)
QUIET, CLEAN, AFFORDABLE LIVING, JUST MINUTES FROM THE BEACHES! 1 BEDROOM WITH PLENTY OF ROOM - 844 SF - WITH AN ENCLOSED PORCH WHICH CAN BE USED AS EXTRA ROOM. NEAR SHOPPING MALL, VA HOSPITAL. OWNER HAS ADDED MANY NICE TOUCHES. LARGE SHEDWITH WORKSHOP. 2ND SHED IS LAUNDRY ROOM. BACK YARD HAS PLENTY OF PRIVACY. COMPETITIVELY PRICED FOR QUICK SALE. MOTIVATED SELLER. HOME WARRANTY WITH FULL ASKING PRICE.
-
1992-11-02soldstatus $20,000
ⓘ Source: listings_history table (triggers on properties + properties_extension) + one-shot
backfill from property_details.listing_events for pre-trigger history.
Tax reassessment forecast FL · Resets to sale price
- Current annual tax
- $1,365 · $114/mo
- Projected year-2 tax
- $1,365 · $114/mo
- Expected delta
- $0/yr ($0/mo · 0.0%)
ⓘ Screening estimate from a state-policy table — verify with the county assessor before closing.
Climate risk First Street
- Flood 7/10 Severe FEMA zone X (shaded) · 73% chance over 30 yrs
- Wildfire 1/10 Low
- Heat 10/10 Extreme 7 d/yr ≥107°F today · 25 d/yr by 30 yrs out
- Wind 10/10 Extreme 99% chance of damaging wind over 30 yrs
- Air quality 4/10 Moderate 4 unhealthy d/yr today · 4 by 30 yrs out
Nearby sold comps map
Loading sold comps map…
Walkable amenities ~0.75 mi
Loading nearby amenities…
Taxation est. · year 1
- Rental income
- $19,496
- − Mortgage interest
- −$5,008
- − Property taxes
- −$1,365
- − Insurance
- −$1,244
- − Repairs & maintenance
- −$1,560
- − Management
- −$1,560
- − Depreciation
- −$2,601
- Taxable income
- $6,159
- Est. tax owed @ 24.0%
- −$1,478
- After-tax cash flow
- $5,688/yr
For passive investors: Depreciation is non-cash, so a rental often shows a tax loss while cash-flowing — sheltering income. Rental losses are passive: they offset passive income freely, and up to $25,000/yr can offset ordinary (W-2) income if you actively participate and your MAGI is under $100k (phasing out to $0 by $150k); unused losses carry forward. On sale, claimed depreciation is recaptured at up to 25%, and gains may owe capital-gains tax (a 1031 exchange can defer both). Figures are a year-1 estimate at your 24.0% rate — not tax advice; consult a CPA.
Schools (NCES district)
- District
- Pinellas
- NCES district ID
- 1201560
- Math proficiency
- 51% ▼ -5.00%
- Reading proficiency
- 51% ▼ -3.00%
- Median HH income
- $46,270
- Composite
- 43.27/100
- National rank
- #3046
- State rank
- #31 of 73 in FL
Livability — West Lealman
- Score
- 81/100
- State rank
- #84
- US rank
- #1396
Category grades
Schools grade is shown separately in the Schools card above.
Census & demographics
- Census place
- West Lealman, FL
- County
- Pinellas County · 939,478 people
- City population
- 25,371
- Metro
- Tampa-St. Petersburg-Clearwater, FL
- Population (ZIP)
- 25,050
- Household income
- $53,501
- Rent vs Own
- Severe rent burden
- 712.0
Population outlook (Pinellas County) Hauer SSP2
- Today (2025)
- 1,027,532 people
- By 2030
- 1,063,586 · +3.5%
- By 2040
- 1,125,020 · +9.5%
- By 2050
- 1,168,637 · +13.7%
- By 2075
- 1,265,188 · +23.1%
- By 2100
- 1,260,357 · +22.7%
Race, ethnicity, and origin ACS 2023
- Neighborhood character
- Predominantly White (73%)
- Race & ethnicity
- White 73% Hispanic / Latino 11% Two or more races 10% Black 5% Asian 5%
- Hispanic origin (detail)
- Mexican 2% Puerto Rican 3% Cuban 2% Dominican 1%
- Common ancestry
- Lithuanian 3% Romanian 3% Slovak 2%
- Foreign-born
- 14% · Canada, Vietnam, Jamaica
- Languages at home
- 84% English-only · Spanish 9% Other Indo-European 2% Vietnamese 2%
Political lean MEDSL · Pinellas
- 2024 margin
- Lean R (+5.2) · D 46.9% · R 52.1%
- 2008→2024 swing
- -13.5pp toward R · 2008: 8.3pp · 2024: -5.2pp
- All cycles
- 2024: R+5.2 2020: D+0.2 2016: R+1.1 2012: D+5.6 2008: D+8.3
Not yet ingested
- Civics
- —
Market trends
- HPI YoY
- ▼ -416.74%
- Current HPI
- 391.368
- Rent YoY
- ▲ 0.99%
- Metro
- Tampa-St. Petersburg-Clearwater, FL
- State GDP YoY
- ▲ 3.28%
- F500 in state
- 36
Industry mix (Fortune 500 HQ in FL)
| Industry | F500 HQs | Revenue |
|---|---|---|
| Industrial Technology | 2 | $29B |
|
||
| Insurance | 2 | $17B |
|
||
| Retail | 1 | $60B |
|
||
| Technology Distribution | 1 | $58B |
|
||
| Homebuilding | 1 | $35B |
|
||
| Technology Manufacturing | 1 | $35B |
|
||
Price history
+347.0% since first listed7 events — show timeline
- 2026-05-03 Pending — Stellar MLS as Distributed by MLS Grid
- 2026-05-03 Price Changed $89,400 Stellar MLS as Distributed by MLS Grid
- 2026-05-01 Listed $84,900 Stellar MLS as Distributed by MLS Grid
- 2006-09-15 Sold (Public Records) $55,000 Public Records
- 2006-09-13 Sold (MLS) $55,000 Stellar MLS as Distributed by MLS Grid
- 2006-06-06 Listed $65,000 Stellar MLS as Distributed by MLS Grid
- 1992-11-02 Sold (Public Records) $20,000 Public Records
Property tax history
+6.7%/yrLatest (2025): $1,365 · +6.7% YoY. Source: county tax records.
Cash-flow waterfall
monthlySold comps — $/sqft
last 12 mo · ≤1 miLoading sold comps…