 Fourplex
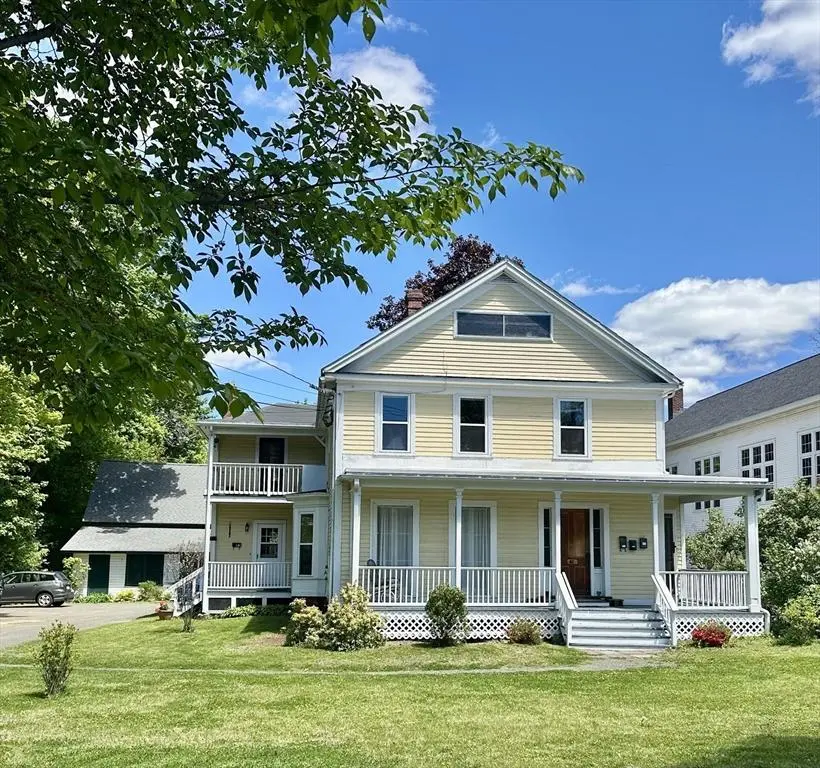
41-43 North Main · Northampton, MA
Flood risk 1/10 · Minimal
- FEMA flood zone
- X
- Chance of flooding over 30 yrs
- 0.0%
- Est. flood insurance / yr
- $507 – $1,088
Fire risk 1/10 · Minimal
- Est. fire insurance / yr
- $915 – $1,699
Heat risk 4/10 · Minor
- Hot days now (above 97°F)
- 7 days/yr
- Hot days in 30 yrs
- 16 days/yr
Wind risk 4/10 · Minor
- Chance of severe wind over 30 yrs
- 18.0%
Air-quality risk 2/10 · Minimal
- Unhealthy air days now
- 1 days/yr
- Unhealthy air days in 30 yrs
- 1 days/yr
Risk factors via First Street. Map © Google.
Why this score? — see what drove the C+ grade
The composite is a weighted blend of 9 inputs, each scored 0–100. Each bar is that input's sub-score; the figure is the points it added to the 100-point composite (weight × sub-score).
- Cash flow +24.8/30.0
- ARV discount +9.3/15.0
- DSCR +8.0/10.0
- 1% rule +6.0/10.0
- Schools +3.9/10.0
- Livability +3.9/5.0
- Rent growth +2.5/5.0
- Condition / age +2.5/5.0
- Appreciation +0.0/10.0
$749,000
🖨 Deal sheet 📄 Offer letter ✓ Due diligence
Multi-family units
County records classify this as Multi-Family (5+ Unit). Listing-text estimate: 4 units. estimate disagrees with records
5+ unit building — per-unit beds/baths from public records are typically unavailable; the breakdown below (if shown) is an estimate from the listing text.
Listing remarks MLS
Excellent location in Florence center for this 4-family unit- 2- 1BR units and 2-2BR units-Good rental history!! Separate outbuilding for plenty of storage had new roof in 2005! ,New Buderus furnace and hot water heater 2005. Some windows replaced. 2012 one unit renovated, flat porch roofs replaced, deck roof, deck and back staircase. Walk to town or bike to Look Park!Some bedrooms don't have closets
Key facts
- Off street parking
- New gutters
- New electrical
Tags
Property features AI
Finance
- Other: Building area total approximately 4,600; Lot size approximately 0.69 acres; Five stories total; Basement: full, interior entry, bulkhead, dirt floor, unfinished; Property address: 41-43 North Main, Northampton MA 01062; Active listing
- HOA & community: Community features include public transportation, shopping, tennis courts, park, walk/jog trails, medical facility, laundromat, bike path, conservation area, highway access, house of worship, private and public schools, T-Station, and sidewalks
Exterior
- Parking: Garage (1 covered space); Open parking (10 spaces); Total 11 parking spaces; Shared driveway; Off-street parking; Common parking
- Utilities: Public water; Public sewer; 100 amp electric service; Individually metered electric; Gas connection for range
- Home design: 4-family property; Five stories; Renovated since original construction; Yellow exterior
- Construction: Frame construction; Stone and brick/mortar foundation; Slate roof; Originally built (year per public records) and renovated since
- Exterior features: Porch; Balcony/Deck; Rain gutters; Garden; Shed(s); Barn/Stable; Level lot; Paved public road frontage; Publicly maintained road
Interior
- Kitchen: Range; Refrigerator
- Flooring: Wood flooring; Vinyl flooring
- Bathrooms: 4 full bathrooms
- Heating & cooling: Central heating; Hot water heating; Oil heating; Has heating; One heating unit; No cooling units
- Interior features: Remodeled interiors; Living room; Dining room; Kitchen; Office/Den; Living room / Dining room combo; Bathroom with tub and shower; Bathroom with shower stall; Internet available (Fiber-Optic); Insulated doors; Box/Bay/Bow windows with screens; 15 total rooms
Neighborhood map
What this means for you Summary
Snapshot
- This is a 4 × 6-bed/4.0-bath units multifamily listed at $749k.
Deal economics
- At list price, monthly cash flow is $2k ($19k/yr) — positive. Per door: $395/mo.
- The deal already cash-flows at list — no discount required.
- Meets the 1% rule at list price ($8k rent vs $749k).
- Recommended offer: $727k (3.0% below list) — sets the bar for market timing.
- Cap rate 8.8% vs local median 2.2% in Northampton — top-decile yield for the area; either an underpriced asset or a hidden risk that comps aren't pricing in. Stress-test before assuming the spread holds.
Location & tenants
- Location reads 78/100 on livability (#49 in MA, #2,534 nationally) — a middle-class / working-renter tenant base. Strengths: commute A+, health & safety A+, employment A; Watch: crime D+, amenities F, cost of living F.
- Northampton (suburban): math 36% / reading 53% proficiency, ranked #175 of 302 in MA (top 58%) — families likely to look elsewhere, expect single-tenant / working-renter base with shorter leases.
- Zoned schools: Leeds (math 37% / reading 62%, grade D, #330 of 938 statewide, top 38%, 298 students, 0% FRL) — zoned schools average 0% FRL vs 29% district-wide (29 pts lower); this property's tenant base skews higher-income than the district average.
- Market conditions: 23 active listings in the ZIP; 349 units permitted in Hampshire County in 2024 (185 in 5+ unit buildings).
Forward outlook
- Local home prices are declining (-3.0%/yr); year-one equity from $5k of loan paydown is wiped out by about $22k of value loss. Plan a longer hold.
- Hampshire County population projected at +5% by 2050 — modest demand growth; plan on rents tracking national, not racing it.
Negotiation context
- It's been on market 36 days — a 3% lower offer ($727k) is reasonable based on typical stale-listing flexibility.
- 2 sale attempts since 13y ago; this cycle's ask has dropped $50k (6%) from the opening price — seller is motivated, your offer sets the floor, not the list.
- Current owner paid $342k; list at $749k implies a 119% gain — meaningful room to come down on a strong offer.
Risks & watch-outs
- Watch-outs: built in 1900 — expect roof / HVAC / electrical / plumbing capex.
Questions for the listing agent
- It's been on market 36 days. Have you received any prior offers? Is the seller open to a 3% concession, seller financing, or rate buy-down credit?
- Can we see the unit-by-unit rent roll, current vacancy, and any below-market leases? What's the average tenancy length?
- What capital expenditures (roof, boiler, parking lot, exteriors) have been made in the last 5 years, and what's planned in the next 2?
- Built in 1900 — when were the roof, HVAC, electrical panel, plumbing, and water heater last replaced?
- Is there a deadline driving the sale (1031 exchange, divorce, estate, relocation)? That informs how much negotiation room exists.
- Crime grade is D in this area — have there been break-ins, vandalism, or insurance claims at this property in the last 3 years? What carrier currently insures it and at what premium?
- What's the average days-on-market for RENTAL listings here right now (not sales)? A rising rental-DOM trend means longer vacancies and softer asking-rent achievability than the comps imply.
- What's the recent tenant-quality profile in this submarket — average credit score on applications, eviction rate, late-payment / NSF rate, and stable-employment percentage? A property-management company in the area should have these aggregated.
- How much new apartment / multifamily construction is in the pipeline within 1–3 miles? Heavy new supply (>2% of stock underway) typically softens rents 12–24 months out; light construction supports rent growth.
Investment metrics
- 1% rule
- 1.10% ✓
- Cap rate
- 8.83%
- Cash-on-cash
- 9.05%
- DSCR
- 1.40
- GRM
- 7.6
CMA / ARV
- ARV (median comp)
- $779,437
- List price
- $749,000
- Delta
- -3.91%
- Verdict
- FAIR
- Comps
- 2 within 1.0 mi
Projected returns pro-forma
-3.0% appreciation · 3.0% rent growth · sell at horizon
- IRR
- -2.6%
- Equity multiple
- 0.90×
- Total profit
- $-20,684
- Equity at exit
- $111,678
- IRR
- 7.1%
- Equity multiple
- 1.53×
- Total profit
- $111,558
- Equity at exit
- $64,760
Cash invested: $209,720 (down + closing). Projections, not guarantees.
Landlord ↔ Tenant lean methodology
- Overall (STATE)
- 20 Strongly Tenant-Friendly
- State Massachusetts
- 20 Strongly Tenant-Friendly · D+15
- County
- — inherits STATE
- City
- — inherits STATE
ZIP-level market 01062
- Active inventory
- 23
- Price-to-rent
- 30.3×
Monthly cashflow live
- Estimated rent
- $8,239 medium interval (Pro) →
- Mortgage (P&I)
- −$3,928
- Tax from tax record
- −$688 /mo · $8,251/yr
- Insurance
- −$312
- HOA
- −$0
- Vacancy / Maint / Mgmt
- −$1,730
- Net cashflow
- $1,581
Break-even live
4-unit breakdown (identical units grouped — click to expand)
| Units | Beds | Baths | Est. rent |
|---|---|---|---|
| 4× units | 6 | 4 | $8,240 |
| #1 | 6 | 4 | $2,060 |
| #2 | 6 | 4 | $2,060 |
| #3 | 6 | 4 | $2,060 |
| #4 | 6 | 4 | $2,060 |
| Total (4 units) | $8,239 | ||
UW: 25.0% down · 7.5% · 30yr · 1.5% tax · 5.0% vac · 8.0% maint · 8.0% mgmt
Financing live
Cash to close
- Down payment
- $187,250
- Closing costs
- $22,470
- Reserves months
- —
- Total cash needed
- —
Loan-product check · same deal, 3 products live
Conventional
25% down · 7.5% · 30yr
- Down + closing
- —
- Monthly P&I
- —
- Monthly cashflow
- —
- DSCR
- —
- Eligible?
- —
Personal DTI + credit; lowest rate.
DSCR
20% down · 8.5% · 30yr
- Down + closing
- —
- Monthly P&I
- —
- Monthly cashflow
- —
- DSCR
- —
- Eligible?
- —
No personal income docs; deal must DSCR.
Hard money
10% down · 12.0% · 12mo
- Down + closing
- —
- Monthly P&I
- —
- Monthly cashflow
- —
- DSCR
- —
- Eligible?
- —
Short-term bridge; refi at stabilization.
Listing history 19 events
-
2026-06-18days on market $749,000 Active 36 DOM
-
2026-06-17days on market $749,000 Active 35 DOM
-
2026-06-16days on market $749,000 Active 34 DOM
-
2026-06-15days on market $749,000 Active 33 DOM
-
2026-06-14statusdays on market $749,000 Active 31 DOM
-
2026-06-13days on market $749,000 Price Changed 30 DOM
-
2026-06-10pricestatusdays on market $749,000 Price Changed 28 DOM
-
2026-06-09days on market $799,000 Active 27 DOM
-
2026-06-08days on market $799,000 Active 26 DOM
-
2026-06-07days on market $799,000 Active 25 DOM
-
2026-06-05days on market $799,000 Active 22 DOM
-
2026-06-03days on market $799,000 Active 21 DOM
-
2026-06-02days on market $799,000 Active 20 DOM
-
2026-06-01days on market $799,000 Active 19 DOM
-
2026-05-31days on market $799,000 Active 18 DOM
-
2026-05-30days on market $799,000 Active 17 DOM
-
2026-05-13$799,000 New 809-char remark
-
2013-06-07soldstatus $342,000 404-char remark
Show marketing remark (404 chars)
Excellent location in Florence center for this 4-family unit- 2- 1BR units and 2-2BR units-Good rental history!! Separate outbuilding for plenty of storage had new roof in 2005! ,New Buderus furnace and hot water heater 2005. Some windows replaced. 2012 one unit renovated, flat porch roofs replaced, deck roof, deck and back staircase. Walk to town or bike to Look Park!Some bedrooms don't have closets
-
2013-04-16$335,000 404-char remark
Show marketing remark (404 chars)
Excellent location in Florence center for this 4-family unit- 2- 1BR units and 2-2BR units-Good rental history!! Separate outbuilding for plenty of storage had new roof in 2005! ,New Buderus furnace and hot water heater 2005. Some windows replaced. 2012 one unit renovated, flat porch roofs replaced, deck roof, deck and back staircase. Walk to town or bike to Look Park!Some bedrooms don't have closets
ⓘ Source: listings_history table (triggers on properties + properties_extension) + one-shot
backfill from property_details.listing_events for pre-trigger history.
Tax reassessment forecast MA · Partial reset (capped growth)
- Current annual tax
- $8,251 · $688/mo
- Projected year-2 tax
- $8,732 · $728/mo
- Expected delta
- +$481/yr (+$40/mo · 5.8%)
ⓘ Screening estimate from a state-policy table — verify with the county assessor before closing.
Climate risk First Street
- Flood 1/10 Low FEMA zone X · 0% chance over 30 yrs
- Wildfire 1/10 Low
- Heat 4/10 Moderate 7 d/yr ≥97°F today · 16 d/yr by 30 yrs out
- Wind 4/10 Moderate 18% chance of damaging wind over 30 yrs
- Air quality 2/10 Low 1 unhealthy d/yr today · 1 by 30 yrs out
Nearby sold comps map
Loading sold comps map…
Walkable amenities ~0.75 mi
Loading nearby amenities…
Taxation est. · year 1
- Rental income
- $98,868
- − Mortgage interest
- −$41,956
- − Property taxes
- −$8,251
- − Insurance
- −$3,745
- − Repairs & maintenance
- −$7,909
- − Management
- −$7,909
- − Depreciation
- −$21,789
- Taxable income
- $7,308
- Est. tax owed @ 24.0%
- −$1,754
- After-tax cash flow
- $17,222/yr
For passive investors: Depreciation is non-cash, so a rental often shows a tax loss while cash-flowing — sheltering income. Rental losses are passive: they offset passive income freely, and up to $25,000/yr can offset ordinary (W-2) income if you actively participate and your MAGI is under $100k (phasing out to $0 by $150k); unused losses carry forward. On sale, claimed depreciation is recaptured at up to 25%, and gains may owe capital-gains tax (a 1031 exchange can defer both). Figures are a year-1 estimate at your 24.0% rate — not tax advice; consult a CPA.
Schools (NCES district)
- District
- Northampton
- NCES district ID
- 2508850
- Math proficiency
- 36% ▼ -13.00%
- Reading proficiency
- 53% ▼ -4.00%
- Median HH income
- $57,335
- Composite
- 38.86/100
- National rank
- #4102
- State rank
- #175 of 302 in MA
Livability — Northampton
- Score
- 78/100
- State rank
- #49
- US rank
- #2534
Category grades
Schools grade is shown separately in the Schools card above.
Census & demographics
- Census place
- Northampton, MA
- City population
- 16,492
- Population (ZIP)
- 9,188
Population outlook (Hampshire County) Hauer SSP2
- Today (2025)
- 166,577 people
- By 2030
- 168,928 · +1.4%
- By 2040
- 171,197 · +2.8%
- By 2050
- 175,542 · +5.4%
- By 2075
- 199,884 · +20.0%
- By 2100
- 211,819 · +27.2%
Race, ethnicity, and origin ACS 2023
- Neighborhood character
- Predominantly White (87%)
- Race & ethnicity
- White 87% Hispanic / Latino 7% Two or more races 6% Black 2%
- Hispanic origin (detail)
- Puerto Rican 4%
- Common ancestry
- Romanian 11% Lithuanian 7% Slovak 5%
- Foreign-born
- 4% · Canada
- Languages at home
- 90% English-only · Spanish 7% French/Haitian/Cajun 2% Russian/Polish/Slavic 1%
Political lean MEDSL · Hampshire
- 2024 margin
- Solid D (+41.9) · D 69.5% · R 27.6% · Other 2.9%
- 2008→2024 swing
- -3.6pp toward R · 2008: 45.6pp · 2024: 41.9pp
- All cycles
- 2024: D+41.9 2020: D+46.8 2016: D+39.5 2012: D+43.8 2008: D+45.6
Not yet ingested
- Civics
- —
Market trends
- HPI YoY
- ▼ -230.75%
- Current HPI
- 275.9868
- Rent YoY
- —
- Metro
- —
- State GDP YoY
- ▲ 2.28%
- F500 in state
- 38
Industry mix (Fortune 500 HQ in MA)
| Industry | F500 HQs | Revenue |
|---|---|---|
| Technology | 3 | $17B |
|
||
| Insurance | 2 | $84B |
|
||
| Retail | 2 | $76B |
|
||
| Life Sciences | 1 | $43B |
|
||
| Energy Technology | 1 | $31B |
|
||
| Aerospace / Defense | 1 | $18B |
|
||
Price history
+123.6% since first listed4 events — show timeline
- 2026-06-09 Price Changed $749,000 MLS PIN
- 2026-05-13 Listed $799,000 MLS PIN
- 2013-06-07 Sold (MLS) $342,000 MLS PIN
- 2013-04-16 Listed $335,000 MLS PIN
Property tax history
+7.6%/yrLatest (2023): $8,251 · +2.5% YoY. Source: county tax records.
Cash-flow waterfall
monthlySold comps — $/sqft
last 12 mo · ≤1 miLoading sold comps…