 Multi-family
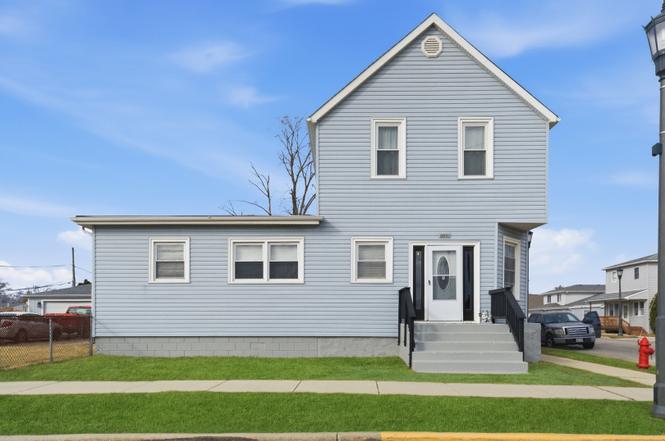
8891 67th St · Hodgkins, IL
Flood risk 1/10 · Minimal
- FEMA flood zone
- X (unshaded)
- Chance of flooding over 30 yrs
- 0.0%
- Est. flood insurance / yr
- $473 – $860
Fire risk 1/10 · Minimal
- Est. fire insurance / yr
- $804 – $1,492
Heat risk 3/10 · Minor
- Hot days now (above 101°F)
- 7 days/yr
- Hot days in 30 yrs
- 15 days/yr
Wind risk 2/10 · Minimal
- Chance of severe wind over 30 yrs
- 0.0%
Air-quality risk 4/10 · Minor
- Unhealthy air days now
- 4 days/yr
- Unhealthy air days in 30 yrs
- 6 days/yr
Risk factors via First Street. Map © Google.
Why this score? — see what drove the D grade
The composite is a weighted blend of 9 inputs, each scored 0–100. Each bar is that input's sub-score; the figure is the points it added to the 100-point composite (weight × sub-score).
- Cash flow +12.1/30.0
- ARV discount +7.5/15.0
- Schools +4.7/10.0
- 1% rule +4.4/10.0
- Rent growth +3.9/5.0
- DSCR +3.6/10.0
- Livability +3.3/5.0
- Condition / age +2.5/5.0
- Appreciation +0.0/10.0
$347,900
🖨 Deal sheet 📄 Offer letter ✓ Due diligence
Multi-family units
County records classify this as Multi-Family (2-4 Unit). Listing-text estimate: 1 unit. estimate disagrees with records
Listing remarks
THIS WONT LAST! BEAUTIFUL 4 BEDROOM 2 BATH HOME! NEW ELECTRIC , NEW PLUMBING, NEW STAINLESS STEEL APPLIANCES, NEW MASTER SUITE W NEW BATH, SITTING ROOM , WALK IN CLOSET, PRIVATE WATER CLOSET, NEW VANITY, NEW WINDOWS ON SECOND FLOOR MASTER, HUGE LIVING AND DINING ROOMS, NEW CARPET THROUGHOUT, NEW QUARTZ TOPS THE LIST GOES ON AND ON. .. .
Key facts
- New master suite
- New plumbing
- New electric
Tags
Neighborhood map
What this means for you Summary
Snapshot
- This is a 6-bed/3.0-bath multifamily listed at $348k.
Deal economics
- At list price, monthly cash flow is $-78 ($-931/yr) — negative.
- To cash-flow at today's rent, offer at most $334k (3.9% below list).
- To meet the 1% rule (rent ≥ 1% of price), the offer needs to be $327k (6.1% below list).
- Recommended offer: $327k (6.1% below list) — sets the bar for 1% rule.
Location & tenants
- Location reads 66/100 on livability (#573 in IL) — a middle-class / working-renter tenant base. Strengths: cost of living A+, housing A+; Watch: employment C-, schools F, crime D-.
- Lyons Twp Hsd 204 (suburban): math 49% / reading 53% proficiency, ranked #43 of 620 in IL (top 7%) — acceptable for families but not a draw, mixed tenant base, ~2y average lease.
- Market conditions: Rents rising fast (+5.8%/yr); 88 active listings in the ZIP; high-income renter base; 6,272 units permitted in Cook County in 2024 (4,658 in 5+ unit buildings).
- This rent runs 34% of the median local income ($117k/yr) — at the standard rent-burdened threshold; future hikes will face affordability resistance.
Forward outlook
- Local home prices are declining (-3.0%/yr); year-one equity from $2k of loan paydown is wiped out by about $10k of value loss. Plan a longer hold.
Negotiation context
- Only 7 days on market — expect competitive offers; lowballing is unlikely to land.
- Current owner paid $126k; list at $348k implies a 177% gain — meaningful room to come down on a strong offer.
Risks & watch-outs
- Watch-outs: built in 1881 — expect roof / HVAC / electrical / plumbing capex.
Questions for the listing agent
- What do current leases actually rent for vs. the listed asking? Can we see a recent rent roll and the last 12 months of T-12 income?
- Built in 1881 — when were the roof, HVAC, electrical panel, plumbing, and water heater last replaced?
- Is there a deadline driving the sale (1031 exchange, divorce, estate, relocation)? That informs how much negotiation room exists.
- Schools are F-rated, which usually means shorter tenancies and higher turnover. Who's the typical renter profile here, and what's been the actual vacancy rate?
- Crime grade is D in this area — have there been break-ins, vandalism, or insurance claims at this property in the last 3 years? What carrier currently insures it and at what premium?
- The area grade is low — what's the realistic commute time and amenity access for the typical tenant pool here? Any planned neighborhood developments (good or bad) we should know about?
- What's the average days-on-market for RENTAL listings here right now (not sales)? A rising rental-DOM trend means longer vacancies and softer asking-rent achievability than the comps imply.
- What's the recent tenant-quality profile in this submarket — average credit score on applications, eviction rate, late-payment / NSF rate, and stable-employment percentage? A property-management company in the area should have these aggregated.
- How much new apartment / multifamily construction is in the pipeline within 1–3 miles? Heavy new supply (>2% of stock underway) typically softens rents 12–24 months out; light construction supports rent growth.
Investment metrics
- 1% rule
- 0.94% ✗
- Cap rate
- 6.03%
- Cash-on-cash
- -0.96%
- DSCR
- 0.96
- GRM
- 8.9
CMA / ARV
No comps found within radius.
Projected returns pro-forma
-3.0% appreciation · 5.77% rent growth · sell at horizon
- IRR
- -14.4%
- Equity multiple
- 0.47×
- Total profit
- $-51,757
- Equity at exit
- $51,873
- IRR
- -1.3%
- Equity multiple
- 0.90×
- Total profit
- $-9,970
- Equity at exit
- $30,080
Cash invested: $97,412 (down + closing). Projections, not guarantees.
Landlord ↔ Tenant lean methodology
- Overall (STATE)
- 43 Moderately Tenant-Leaning
- State Illinois
- 43 Moderately Tenant-Leaning · D+7
- County
- — inherits STATE
- City
- — inherits STATE
ZIP-level market 60525
- Rents YoY
- 5.8%
- Active inventory
- 88
- Price-to-rent
- 8.9×
Monthly cashflow live
- Estimated rent
- $3,266 medium interval (Pro) →
- Mortgage (P&I)
- −$1,824
- Tax from tax record
- −$688 /mo · $8,259/yr
- Insurance
- −$145
- HOA
- −$0
- Vacancy / Maint / Mgmt
- −$686
- Net cashflow
- $-78
Break-even live
UW: 25.0% down · 7.5% · 30yr · 1.5% tax · 5.0% vac · 8.0% maint · 8.0% mgmt
Financing live
Cash to close
- Down payment
- $86,975
- Closing costs
- $10,437
- Reserves months
- —
- Total cash needed
- —
Loan-product check · same deal, 3 products live
Conventional
25% down · 7.5% · 30yr
- Down + closing
- —
- Monthly P&I
- —
- Monthly cashflow
- —
- DSCR
- —
- Eligible?
- —
Personal DTI + credit; lowest rate.
DSCR
20% down · 8.5% · 30yr
- Down + closing
- —
- Monthly P&I
- —
- Monthly cashflow
- —
- DSCR
- —
- Eligible?
- —
No personal income docs; deal must DSCR.
Hard money
10% down · 12.0% · 12mo
- Down + closing
- —
- Monthly P&I
- —
- Monthly cashflow
- —
- DSCR
- —
- Eligible?
- —
Short-term bridge; refi at stabilization.
Listing history 5 events
-
2026-03-11status Pending
-
2026-03-03historical
-
1997-07-28soldstatus $125,500
-
1996-04-29soldstatus $94,500
-
1986-12-22soldstatus $117,500
ⓘ Source: listings_history table (triggers on properties + properties_extension) + one-shot
backfill from property_details.listing_events for pre-trigger history.
Tax reassessment forecast IL · Partial reset (capped growth)
- Current annual tax
- $8,259 · $688/mo
- Projected year-2 tax
- $8,259 · $688/mo
- Expected delta
- $0/yr ($0/mo · 0.0%)
ⓘ Screening estimate from a state-policy table — verify with the county assessor before closing.
Climate risk First Street
- Flood 1/10 Low FEMA zone X (unshaded) · 0% chance over 30 yrs
- Wildfire 1/10 Low
- Heat 3/10 Moderate 7 d/yr ≥101°F today · 15 d/yr by 30 yrs out
- Wind 2/10 Low 0% chance of damaging wind over 30 yrs
- Air quality 4/10 Moderate 4 unhealthy d/yr today · 6 by 30 yrs out
Nearby sold comps map
Loading sold comps map…
Walkable amenities ~0.75 mi
Loading nearby amenities…
Taxation est. · year 1
- Rental income
- $39,190
- − Mortgage interest
- −$19,488
- − Property taxes
- −$8,259
- − Insurance
- −$1,740
- − Repairs & maintenance
- −$3,135
- − Management
- −$3,135
- − Depreciation
- −$10,121
- Taxable loss
- −$6,687
- Est. tax savings @ 24.0%
- +$1,605
- After-tax cash flow
- $674/yr
For passive investors: Depreciation is non-cash, so a rental often shows a tax loss while cash-flowing — sheltering income. Rental losses are passive: they offset passive income freely, and up to $25,000/yr can offset ordinary (W-2) income if you actively participate and your MAGI is under $100k (phasing out to $0 by $150k); unused losses carry forward. On sale, claimed depreciation is recaptured at up to 25%, and gains may owe capital-gains tax (a 1031 exchange can defer both). Figures are a year-1 estimate at your 24.0% rate — not tax advice; consult a CPA.
Schools (NCES district)
- District
- Lyons Twp Hsd 204
- NCES district ID
- 1723880
- Math proficiency
- 49% ▼ -15.00%
- Reading proficiency
- 53% ▼ -6.00%
- Median HH income
- $82,628
- Composite
- 46.72/100
- National rank
- #2394
- State rank
- #43 of 620 in IL
Livability — Hodgkins
- Score
- 66/100
- State rank
- #573
- US rank
- #12028
Category grades
Schools grade is shown separately in the Schools card above.
Census & demographics
- Census place
- Hodgkins, IL
- County
- Cook County · 4,486,803 people
- Metro
- Chicago-Naperville-Elgin, IL-IN-WI
- Population (ZIP)
- 31,324
- Household income
- $116,918
- Rent vs Own
- Severe rent burden
- 424.0
Population outlook (Cook County) Hauer SSP2
- Today (2025)
- 5,347,519 people
- By 2030
- 5,357,703 · +0.2%
- By 2040
- 5,324,924 · -0.4%
- By 2050
- 5,230,762 · -2.2%
- By 2075
- 4,785,735 · -10.5%
- By 2100
- 4,188,836 · -21.7%
Race, ethnicity, and origin ACS 2023
- Neighborhood character
- Predominantly White (75%)
- Race & ethnicity
- White 75% Hispanic / Latino 16% Two or more races 9% Black 4% Asian 2%
- Hispanic origin (detail)
- Mexican 14%
- Common ancestry
- Romanian 13% Slovak 2% Portuguese 1%
- Foreign-born
- 10% · Canada, China
- Languages at home
- 82% English-only · Spanish 11% Russian/Polish/Slavic 5% Other Indo-European 1%
Political lean MEDSL · Cook
- 2024 margin
- Solid D (+42.0) · D 70.4% · R 28.4% · Other 1.2%
- 2008→2024 swing
- -11.4pp toward R · 2008: 53.4pp · 2024: 42.0pp
- All cycles
- 2024: D+42.0 2020: D+50.3 2016: D+53.0 2012: D+49.4 2008: D+53.4
Not yet ingested
- Civics
- —
Market trends
- HPI YoY
- ▼ -339.57%
- Current HPI
- 201.4064
- Rent YoY
- ▲ 5.77%
- Metro
- Chicago-Naperville-Elgin, IL-IN-WI
- State GDP YoY
- ▲ 1.59%
- F500 in state
- 60
Industry mix (Fortune 500 HQ in IL)
| Industry | F500 HQs | Revenue |
|---|---|---|
| Insurance | 4 | $201B |
|
||
| Consumer Goods | 4 | $87B |
|
||
| Industrial Machinery | 3 | $64B |
|
||
| Healthcare | 2 | $55B |
|
||
| Retail / Pharmacy | 1 | $148B |
|
||
| Agriculture / Food | 1 | $86B |
|
||
Price history
+6.8% since first listed5 events — show timeline
- 2026-03-11 Pending — MRED as Distributed by MLS Grid
- 2026-03-03 Listing Removed — MRED as Distributed by MLS Grid
- 1997-07-28 Sold (Public Records) $125,500 Public Records
- 1996-04-29 Sold (Public Records) $94,500 Public Records
- 1986-12-22 Sold (Public Records) $117,500 Public Records
Property tax history
+6.1%/yrLatest (2023): $8,259 · +0.4% YoY. Source: county tax records.
Cash-flow waterfall
monthlySold comps — $/sqft
last 12 mo · ≤1 miLoading sold comps…