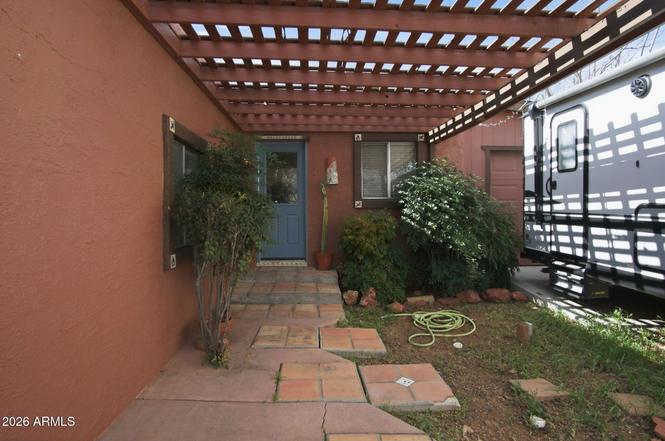
9840 S 8th St · Mayer, AZ
Flood risk 1/10 · Minimal
- FEMA flood zone
- X (unshaded)
- Chance of flooding over 30 yrs
- 0.0%
- Est. flood insurance / yr
- $507 – $1,088
Fire risk 8/10 · Major
- Est. fire insurance / yr
- $610 – $1,132
Heat risk 5/10 · Moderate
- Hot days now (above 97°F)
- 7 days/yr
- Hot days in 30 yrs
- 18 days/yr
Wind risk 1/10 · Minimal
- Chance of severe wind over 30 yrs
- —
Air-quality risk 1/10 · Minimal
- Unhealthy air days now
- 0 days/yr
- Unhealthy air days in 30 yrs
- 0 days/yr
Risk factors via First Street. Map © Google.
Why this score? — see what drove the C+ grade
The composite is a weighted blend of 9 inputs, each scored 0–100. Each bar is that input's sub-score; the figure is the points it added to the 100-point composite (weight × sub-score).
- Cash flow +18.2/30.0
- ARV discount +14.6/15.0
- Appreciation +10.0/10.0
- DSCR +5.7/10.0
- 1% rule +3.6/10.0
- Livability +3.1/5.0
- Rent growth +2.5/5.0
- Condition / age +2.5/5.0
- Schools +2.0/10.0
$225,000
🖨 Deal sheet (PDF) 📄 Offer letter ✓ Due diligence
Key facts
- 5,102 sq ft lot
- 2 garage spots
- Built 1981
Neighborhood map
What this means for you Summary
Snapshot
- This is a 3-bed/2.0-bath single-family listed at $225k.
Deal economics
- At list price, monthly cash flow is $203 ($2k/yr) — positive.
- The deal already cash-flows at list — no discount required.
- To meet the 1% rule (rent ≥ 1% of price), the offer needs to be $193k (14.1% below list).
- Recommended offer: $193k (14.1% below list) — sets the bar for 1% rule.
Location & tenants
- Location reads 62/100 on livability (#147 in AZ) — a middle-class / working-renter tenant base. Strengths: cost of living A+, housing A, crime A-; Watch: amenities F, commute F, employment F.
- Mayer Unified School District (4473) (rural): math 23% / reading 26% proficiency, ranked #165 of 249 in AZ (top 66%) — low school quality limits family demand, transient renter base, plan for 1-2y turnover; 80% free/reduced lunch — lower-income household profile, screen leases tightly.
- Zoned schools: Mayer Elementary School (math 26% / reading 32%, grade F, #570 of 1,109 statewide, top 52%, 373 students, 93% FRL); Mayer High School (math 5% / reading 5%, grade F, #364 of 381 statewide, top 100%, 200 students, 66% FRL) — zoned schools at 79% FRL track the district average.
- Market conditions: 242 active listings in the ZIP; 2,062 units permitted in Yavapai County in 2024 (98 in 5+ unit buildings).
Forward outlook
- In year one you build about $24k of equity ($2k loan paydown + $22k appreciation (10.0% local appreciation)).
- Yavapai County population projected at +10% by 2050 — modest demand growth; plan on rents tracking national, not racing it.
- At projected returns (10.0% appreciation + 3.0% rent growth), your $63k cash investment doubles in ~3 years — after that, you're playing with house money.
- By year 2, paydown + projected appreciation supports a ~$39k cash-out refi (75% LTV) — recoverable capital for the next deal without selling this one.
Negotiation context
- It's been on market 46 days — a 3% lower offer ($218k) is reasonable based on typical stale-listing flexibility.
- 5 sale attempts since 2y ago with the ask held roughly flat each time — persistent listings suggest the price (not the market) is what's stuck; bring a comps-based counter.
Risks & watch-outs
- Climate carrying-cost: severe wildfire risk; extreme-heat days projected 7→18/yr by 2055 (HVAC capex compounding) — expect insurance premiums to compound above CPI over the hold.
Questions for the listing agent
- It's been on market 46 days. Have you received any prior offers? Is the seller open to a 14% concession, seller financing, or rate buy-down credit?
- Is there a deadline driving the sale (1031 exchange, divorce, estate, relocation)? That informs how much negotiation room exists.
- Schools are F-rated, which usually means shorter tenancies and higher turnover. Who's the typical renter profile here, and what's been the actual vacancy rate?
- What's the average days-on-market for RENTAL listings here right now (not sales)? A rising rental-DOM trend means longer vacancies and softer asking-rent achievability than the comps imply.
- What's the recent tenant-quality profile in this submarket — average credit score on applications, eviction rate, late-payment / NSF rate, and stable-employment percentage? A property-management company in the area should have these aggregated.
- How much new for-sale + rental construction is in the pipeline within 1–3 miles? Heavy new supply typically softens prices + rents 12–24 months out; constrained supply supports both.
Investment metrics
- 1% rule
- 0.86% ✗
- Cap rate
- 7.38%
- Cash-on-cash
- 3.87%
- DSCR
- 1.17
- GRM
- 9.7
CMA / ARV
- ARV (on-the-fly)
- $266,800
- Comps found
- 4
Show comp detail 4 sales within ~0.75 mi
| Address | Dist | Beds/Ba | Sqft | Sold | Price | $/sf | Match |
|---|---|---|---|---|---|---|---|
| 9840 S 8th St | 0.00mi | 3/2.0 | 1,150 (0%) | 1mo | $225,000 | $196 | 99 |
| 12723 E Fair Mist Ave | 0.37mi | 3/1.0 | 1,152 (+0%) | 23mo | $165,000 | $143 | 59 |
| 10101 S 3rd St | 0.34mi | 2/1.0 (-1) | 1,020 (-11%) | 1mo | $252,000 | $247 | 56 |
| 10029 S First St | 0.47mi | 3/2.0 | 990 (-14%) | 6mo | $229,900 | $232 | 50 |
Match score weights: distance 35% · size 25% · config 20% · recency 20%. Top-matched comps best support the ARV.
Projected returns pro-forma
10.0% appreciation · 3.0% rent growth · sell at horizon
- IRR
- 27.1%
- Equity multiple
- 3.15×
- Total profit
- $135,356
- Equity at exit
- $202,698
- IRR
- 23.6%
- Equity multiple
- 7.16×
- Total profit
- $388,209
- Equity at exit
- $437,126
Cash invested: $63,000 (down + closing). Projections, not guarantees.
Landlord ↔ Tenant lean methodology
- Overall (STATE)
- 87 Strongly Landlord-Friendly
- State Arizona
- 87 Strongly Landlord-Friendly · R+3
- County
- — inherits STATE
- City
- — inherits STATE
ZIP-level market 86333
- Home prices YoY
- 17.3%
- Active inventory
- 242
- Price-to-rent
- 9.7×
Monthly cashflow live
- Estimated rent
- $1,932 medium interval (Pro) →
- Mortgage (P&I)
- −$1,180
- Tax from tax record
- −$50 /mo · $596/yr
- Insurance
- −$94
- HOA
- −$0
- Vacancy / Maint / Mgmt
- −$406
- Net cashflow
- $203
Break-even live
Sensitivity live
| Price | -10% $330 | -5% $267 | +0% $203 | +5% $139 | +10% $76 |
|---|---|---|---|---|---|
| Rent | -10% $50 | -5% $127 | +0% $203 | +5% $279 | +10% $356 |
| Rate | -1.0pp $316 | -0.5pp $260 | base $203 | +0.5pp $145 | +1.0pp $85 |
UW: 25.0% down · 7.5% · 30yr · 1.5% tax · 5.0% vac · 8.0% maint · 8.0% mgmt
Financing live
Cash to close
- Down payment
- $56,250
- Closing costs
- $6,750
- Reserves months
- —
- Total cash needed
- —
Loan-product check · same deal, 3 products live
Conventional
25% down · 7.5% · 30yr
- Down + closing
- —
- Monthly P&I
- —
- Monthly cashflow
- —
- DSCR
- —
- Eligible?
- —
Personal DTI + credit; lowest rate.
DSCR
20% down · 8.5% · 30yr
- Down + closing
- —
- Monthly P&I
- —
- Monthly cashflow
- —
- DSCR
- —
- Eligible?
- —
No personal income docs; deal must DSCR.
Hard money
10% down · 12.0% · 12mo
- Down + closing
- —
- Monthly P&I
- —
- Monthly cashflow
- —
- DSCR
- —
- Eligible?
- —
Short-term bridge; refi at stabilization.
Listing history 18 events
-
2026-04-25status Pending
-
2026-03-10$225,000 Active
-
2026-02-20historical
-
2026-02-12historical Active Under Contract
-
2025-12-03price $225,000
-
2025-10-02$232,000 Active
-
2025-09-16status Pending
-
2025-09-16historical
-
2025-09-05price $232,000
-
2025-08-10price $244,000
-
2025-07-23$245,000 Active
-
2024-03-28soldstatus $200,000 Closed
-
2024-03-13status Pending
-
2024-03-10status Active
-
2024-03-01status Pending
-
2024-02-27$200,000 Active
-
1995-12-04soldstatus $38,000
-
1995-05-05soldstatus $38,000
ⓘ Source: listings_history table (triggers on properties + properties_extension) + one-shot
backfill from property_details.listing_events for pre-trigger history.
Tax reassessment forecast AZ · Resets to sale price
- Current annual tax
- $596 · $50/mo
- Projected year-2 tax
- $1,485 · $124/mo
- Expected delta
- +$889/yr (+$74/mo · 149.2%)
ⓘ Screening estimate from a state-policy table — verify with the county assessor before closing.
Climate risk First Street
- Flood 1/10 Low FEMA zone X (unshaded) · 0% chance over 30 yrs
- Wildfire 8/10 Severe
- Heat 5/10 Major 7 d/yr ≥97°F today · 18 d/yr by 30 yrs out
- Wind 1/10 Low
- Air quality 1/10 Low 0 unhealthy d/yr today · 0 by 30 yrs out
Nearby sold comps map
Loading sold comps map…
Walkable amenities ~0.75 mi
Loading nearby amenities…
Taxation est. · year 1
- Rental income
- $23,184
- − Mortgage interest
- −$12,603
- − Property taxes
- −$596
- − Insurance
- −$1,125
- − Repairs & maintenance
- −$1,855
- − Management
- −$1,855
- − Depreciation
- −$6,545
- Taxable loss
- −$1,395
- Est. tax savings @ 24.0%
- +$335
- After-tax cash flow
- $2,771/yr
For passive investors: Depreciation is non-cash, so a rental often shows a tax loss while cash-flowing — sheltering income. Rental losses are passive: they offset passive income freely, and up to $25,000/yr can offset ordinary (W-2) income if you actively participate and your MAGI is under $100k (phasing out to $0 by $150k); unused losses carry forward. On sale, claimed depreciation is recaptured at up to 25%, and gains may owe capital-gains tax (a 1031 exchange can defer both). Figures are a year-1 estimate at your 24.0% rate — not tax advice; consult a CPA.
Schools (NCES district)
- District
- Mayer Unified School District (4473)
- NCES district ID
- 0404820
- Math proficiency
- 23% ▼ -11.00%
- Reading proficiency
- 26% ▼ -13.00%
- Median HH income
- $35,108
- Composite
- 20.22/100
- National rank
- #8627
- State rank
- #165 of 249 in AZ
Livability — Mayer
- Score
- 62/100
- State rank
- #147
- US rank
- #17284
Category grades
Schools grade is shown separately in the Schools card above.
Census & demographics
- Census place
- Mayer, AZ
- Population (ZIP)
- 6,425
Population outlook (Yavapai County) Hauer SSP2
- Today (2025)
- 241,389 people
- By 2030
- 249,523 · +3.4%
- By 2040
- 259,966 · +7.7%
- By 2050
- 264,736 · +9.7%
- By 2075
- 269,334 · +11.6%
- By 2100
- 256,505 · +6.3%
Race, ethnicity, and origin ACS 2023
- Neighborhood character
- Predominantly White (77%)
- Race & ethnicity
- White 77% Two or more races 15% Hispanic / Latino 14%
- Hispanic origin (detail)
- Mexican 11% Puerto Rican 1%
- Common ancestry
- Lithuanian 6% Iranian 3% Romanian 3%
- Foreign-born
- 5% · Canada
- Languages at home
- 93% English-only · Spanish 6% Russian/Polish/Slavic 1%
Political lean MEDSL · Yavapai
- 2024 margin
- Solid R (+33.9) · D 32.6% · R 66.5%
- 2008→2024 swing
- -9.5pp toward R · 2008: -24.4pp · 2024: -33.9pp
- All cycles
- 2024: R+33.9 2020: R+29.3 2016: R+31.4 2012: R+30.7 2008: R+24.4
Not yet ingested
- Civics
- —
Market trends
- HPI YoY
- ▲ 55.51%
- Current HPI
- 376.0374
- Rent YoY
- —
- Metro
- —
- State GDP YoY
- ▲ 4.54%
- F500 in state
- 20
Industry mix (Fortune 500 HQ in AZ)
| Industry | F500 HQs | Revenue |
|---|---|---|
| Technology | 2 | $13B |
|
||
| Mining / Metals | 1 | $23B |
|
||
| Environmental Services | 1 | $16B |
|
||
| Metals / Steel | 1 | $14B |
|
||
| Technology Distribution | 1 | $9B |
|
||
| Homebuilding | 1 | $8B |
|
||
Price history
+492.1% since first listed18 events — show timeline
- 2026-04-25 Pending — ARMLS
- 2026-03-10 Listed $225,000 ARMLS
- 2026-02-20 Listing Removed — PAARMLS as Distributed by MLS Grid
- 2026-02-12 Contingent — PAARMLS as Distributed by MLS Grid
- 2025-12-03 Price Changed $225,000 PAARMLS as Distributed by MLS Grid
- 2025-10-02 Listed $232,000 PAARMLS as Distributed by MLS Grid
- 2025-09-16 Pending — ARMLS
- 2025-09-16 Listing Removed — ARMLS
- 2025-09-05 Price Changed $232,000 ARMLS
- 2025-08-10 Price Changed $244,000 ARMLS
- 2025-07-23 Listed $245,000 ARMLS
- 2024-03-28 Sold (MLS) $200,000 PAARMLS as Distributed by MLS Grid
- 2024-03-13 Pending — PAARMLS as Distributed by MLS Grid
- 2024-03-10 Relisted — PAARMLS as Distributed by MLS Grid
- 2024-03-01 Pending — PAARMLS as Distributed by MLS Grid
- 2024-02-27 Listed $200,000 PAARMLS as Distributed by MLS Grid
- 1995-12-04 Sold (Public Records) $38,000 Public Records
- 1995-05-05 Sold (Public Records) $38,000 Public Records
Property tax history
+4.5%/yrLatest (2025): $596 · +6.1% YoY. Source: county tax records.
Cash-flow waterfall
monthlySold comps — $/sqft
last 12 mo · ≤1 miLoading sold comps…