 Duplex
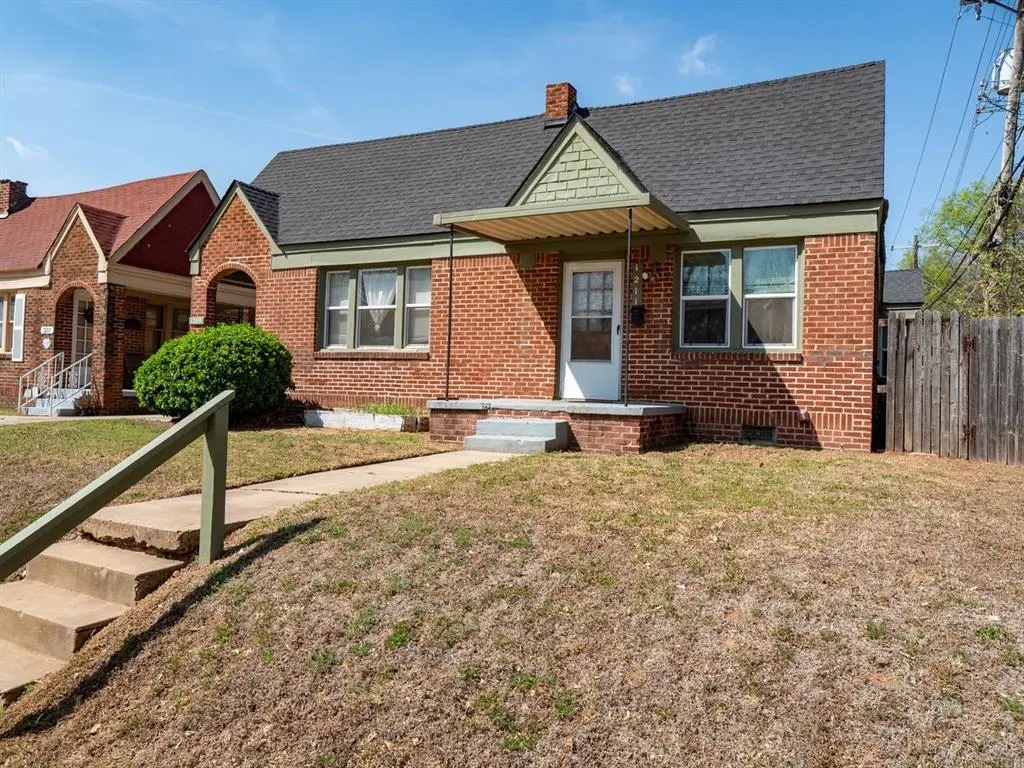
1209 N Villa Ave · Oklahoma City, OK
Flood risk 1/10 · Minimal
- FEMA flood zone
- X (unshaded)
- Chance of flooding over 30 yrs
- 0.0%
- Est. flood insurance / yr
- $507 – $1,088
Fire risk 1/10 · Minimal
- Est. fire insurance / yr
- $2,463 – $4,575
Heat risk 6/10 · Moderate
- Hot days now (above 107°F)
- 7 days/yr
- Hot days in 30 yrs
- 19 days/yr
Wind risk 2/10 · Minimal
- Chance of severe wind over 30 yrs
- 3.0%
Air-quality risk 2/10 · Minimal
- Unhealthy air days now
- 1 days/yr
- Unhealthy air days in 30 yrs
- 2 days/yr
Risk factors via First Street. Map © Google.
Why this score? — see what drove the C- grade
The composite is a weighted blend of 9 inputs, each scored 0–100. Each bar is that input's sub-score; the figure is the points it added to the 100-point composite (weight × sub-score).
- Cash flow +18.4/30.0
- ARV discount +15.0/15.0
- DSCR +5.8/10.0
- Rent growth +4.3/5.0
- 1% rule +4.2/10.0
- Livability +4.0/5.0
- Condition / age +2.5/5.0
- Schools +0.7/10.0
- Appreciation +0.0/10.0
$210,000
🖨 Deal sheet (PDF) 📄 Offer letter ✓ Due diligence
Multi-family units
County records classify this as Multi-Family (2-4 Unit). Listing-text estimate: 2 units. confirmed
Listing remarks MLS
Located at 1209 N Villa Ave in the heart of Oklahoma City, this charming duplex presents a fantastic investment opportunity with both units currently leased and generating income. Built in 1930, the property offers timeless character and charm while having been well maintained over the years. Each unit provides comfortable living spaces for tenants, with one unit featuring a stackable washer and dryer already provided for added convenience. With its classic appeal, solid rental history, and desirable central location, this duplex is a great opportunity for investors looking to expand their portfolio. Don’t miss out, reach out today! Gross monthly income is $1,255
Key facts
- Both units leased
- Solid rental history
- Central location
Tags
Neighborhood map
What this means for you Summary
Snapshot
- This is a 2 × 2-bed/2.0-bath units multifamily listed at $210k.
Deal economics
- At list price, monthly cash flow is $196 ($2k/yr) — positive. Per door: $98/mo.
- The deal already cash-flows at list — no discount required.
- To meet the 1% rule (rent ≥ 1% of price), the offer needs to be $193k (8.3% below list).
- Recommended offer: $193k (8.3% below list) — sets the bar for 1% rule.
- Cap rate 7.4% vs local median 3.7% in Oklahoma City — top-decile yield for the area; either an underpriced asset or a hidden risk that comps aren't pricing in. Stress-test before assuming the spread holds.
Location & tenants
- Location reads 80/100 on livability (#3 in OK, #1,635 nationally) — a professional / high-income tenant draw. Strengths: amenities A+, commute A+, cost of living A+; Watch: schools F, crime F.
- Oklahoma City (urban): math 7% / reading 10% proficiency, ranked #254 of 270 in OK (top 94%) — low school quality limits family demand, transient renter base, plan for 1-2y turnover; 82% free/reduced lunch — lower-income household profile, screen leases tightly.
- Market conditions: Rents rising fast (+7.3%/yr); 221 active listings in the ZIP; 38 comparable units currently listed for rent nearby; rentals at typical pace (median 25d on market — plan ~3-4 weeks tenant-placement turnaround); 47% of comp listings sitting > 30 days — soft ceiling on asking rent; 5,365 units permitted in Oklahoma County in 2024 (569 in 5+ unit buildings).
- This rent runs 41% of the median local income ($57k/yr) — at the standard rent-burdened threshold; future hikes will face affordability resistance.
Forward outlook
- Local home prices are declining (-3.0%/yr); year-one equity from $1k of loan paydown is wiped out by about $6k of value loss. Plan a longer hold.
- Oklahoma County population projected at +41% by 2050 — long-run rental-demand tailwind backs the buy-and-hold thesis.
- At projected returns (-3.0% appreciation + 7.3% rent growth), your $59k cash investment doubles in ~10 years — after that, you're playing with house money.
Negotiation context
- It's been on market 81 days — a 6% lower offer ($197k) is reasonable based on typical stale-listing flexibility.
- 11 sale attempts since 22y ago; this cycle's ask has dropped $30k (12%) from the opening price — seller is motivated, your offer sets the floor, not the list.
- Current owner paid $78k; list at $210k implies a 169% gain — meaningful room to come down on a strong offer.
Risks & watch-outs
- Watch-outs: built in 1930 — expect roof / HVAC / electrical / plumbing capex.
- Climate carrying-cost: extreme-heat days projected 7→19/yr by 2055 (HVAC capex compounding) — expect insurance premiums to compound above CPI over the hold.
Questions for the listing agent
- It's been on market 81 days. Have you received any prior offers? Is the seller open to a 8% concession, seller financing, or rate buy-down credit?
- Can we see the unit-by-unit rent roll, current vacancy, and any below-market leases? What's the average tenancy length?
- What capital expenditures (roof, boiler, parking lot, exteriors) have been made in the last 5 years, and what's planned in the next 2?
- Built in 1930 — when were the roof, HVAC, electrical panel, plumbing, and water heater last replaced?
- Why hasn't it sold? Are there any deal-killer items the seller is aware of (foundation, flood, title, zoning, code violations)?
- Is there a deadline driving the sale (1031 exchange, divorce, estate, relocation)? That informs how much negotiation room exists.
- Schools are F-rated, which usually means shorter tenancies and higher turnover. Who's the typical renter profile here, and what's been the actual vacancy rate?
- Crime grade is F in this area — have there been break-ins, vandalism, or insurance claims at this property in the last 3 years? What carrier currently insures it and at what premium?
- What's the average days-on-market for RENTAL listings here right now (not sales)? A rising rental-DOM trend means longer vacancies and softer asking-rent achievability than the comps imply.
- What's the recent tenant-quality profile in this submarket — average credit score on applications, eviction rate, late-payment / NSF rate, and stable-employment percentage? A property-management company in the area should have these aggregated.
- How much new apartment / multifamily construction is in the pipeline within 1–3 miles? Heavy new supply (>2% of stock underway) typically softens rents 12–24 months out; light construction supports rent growth.
Investment metrics
- 1% rule
- 0.92% ✗
- Cap rate
- 7.42%
- Cash-on-cash
- 4.01%
- DSCR
- 1.18
- GRM
- 9.1
CMA / ARV
- ARV (median comp)
- $272,883
- List price
- $210,000
- Delta
- -23.04%
- Verdict
- UNDERPRICED
- Comps
- 20 within 1.0 mi
Show comp detail 5 sales within ~0.75 mi
| Address | Dist | Beds/Ba | Sqft | Sold | Price | $/sf | Match |
|---|---|---|---|---|---|---|---|
| 2521 NW 12th St | 0.08mi | 2/2.0 | 1,556 (-9%) | 2mo | $210,000 | $135 | 79 |
| 2721 NW 19th St | 0.60mi | 2/2.0 | 1,574 (-8%) | 4mo | $379,000 | $241 | 55 |
| 2854 NW 19th St | 0.70mi | 3/2.0 (+1) | 1,622 (-6%) | 2mo | $233,000 | $144 | 51 |
| 2518 NW 20th St | 0.61mi | 2/2.0 | 1,692 (-1%) | 22mo | $274,000 | $162 | 51 |
| 2519 NW 20th St | 0.64mi | 2/2.0 | 1,512 (-12%) | 12mo | $320,000 | $212 | 41 |
Match score weights: distance 35% · size 25% · config 20% · recency 20%. Top-matched comps best support the ARV.
Projected returns pro-forma
-3.0% appreciation · 7.29% rent growth · sell at horizon
- IRR
- -5.7%
- Equity multiple
- 0.78×
- Total profit
- $-12,892
- Equity at exit
- $31,312
- IRR
- 8.2%
- Equity multiple
- 1.74×
- Total profit
- $43,575
- Equity at exit
- $18,157
Cash invested: $58,800 (down + closing). Projections, not guarantees.
Landlord ↔ Tenant lean methodology
- Overall (STATE)
- 83 Strongly Landlord-Friendly
- State Oklahoma
- 83 Strongly Landlord-Friendly · R+20
- County
- — inherits STATE
- City
- — inherits STATE
ZIP-level market 73107
- Rents YoY
- 7.3%
- Active inventory
- 221
- Price-to-rent
- 18.2×
Monthly cashflow live
- Estimated rent
- $1,926 high interval (Pro) →
- Mortgage (P&I)
- −$1,101
- Tax from tax record
- −$136 /mo · $1,636/yr
- Insurance
- −$88
- HOA
- −$0
- Vacancy / Maint / Mgmt
- −$404
- Net cashflow
- $196
Break-even live
Sensitivity live
| Price | -10% $315 | -5% $256 | +0% $196 | +5% $137 | +10% $78 |
|---|---|---|---|---|---|
| Rent | -10% $44 | -5% $120 | +0% $196 | +5% $273 | +10% $349 |
| Rate | -1.0pp $302 | -0.5pp $250 | base $196 | +0.5pp $142 | +1.0pp $87 |
2-unit breakdown (identical units grouped — click to expand)
| Units | Beds | Baths | Est. rent |
|---|---|---|---|
| 2× units | 2 | 2 | $1,926 |
| #1 | 2 | 2 | $963 |
| #2 | 2 | 2 | $963 |
| Total (2 units) | $1,926 | ||
UW: 25.0% down · 7.5% · 30yr · 1.5% tax · 5.0% vac · 8.0% maint · 8.0% mgmt
Financing live
Cash to close
- Down payment
- $52,500
- Closing costs
- $6,300
- Reserves months
- —
- Total cash needed
- —
Loan-product check · same deal, 3 products live
Conventional
25% down · 7.5% · 30yr
- Down + closing
- —
- Monthly P&I
- —
- Monthly cashflow
- —
- DSCR
- —
- Eligible?
- —
Personal DTI + credit; lowest rate.
DSCR
20% down · 8.5% · 30yr
- Down + closing
- —
- Monthly P&I
- —
- Monthly cashflow
- —
- DSCR
- —
- Eligible?
- —
No personal income docs; deal must DSCR.
Hard money
10% down · 12.0% · 12mo
- Down + closing
- —
- Monthly P&I
- —
- Monthly cashflow
- —
- DSCR
- —
- Eligible?
- —
Short-term bridge; refi at stabilization.
Rent comps 38 comps
| Address | Beds | Baths | Sqft | Rent | $/sqft | DOM | Units | Dist |
|---|---|---|---|---|---|---|---|---|
| 2525 NW 11th St Oklahoma City, OK | 3.0 | 2.0 | 1415 | $1,550 | $1.10 | 45d | 1 | 0.05mi |
| 2519 W Park Pl Oklahoma City, OK | 3.0 | 2.0 | 2000 | $1,900 | $0.95 | 45d | 1 | 0.08mi |
| 1403 N Miller Blvd Oklahoma City, OK | 2.0 | 1.0 | 1200 | $1,100 | $0.92 | 5d | 1 | 0.31mi |
| 1517 N Miller Blvd Oklahoma City, OK | 3.0 | 2.0 | 1968 | $1,650 | $0.84 | 5d | 1 | 0.36mi |
| 2801 NW 11th St Oklahoma City, OK | 2.0 | 1.0 | 1100 | $1,150 | $1.05 | 16d | 1 | 0.37mi |
| 2139 NW 15th St Oklahoma City, OK | 3.0 | 2.0 | 1551 | $1,950 | $1.26 | 45d | 1 | 0.51mi |
| 2820 General Pershing Blvd Oklahoma City, OK | 1.0–3.0 | 1.0–2.0 | 951 | $1,185 | $1.25 | 3d | 39 | 0.68mi |
| 3021 NW 13th St Oklahoma City, OK | 3.0 | 1.0 | 1072 | $995 | $0.93 | 25d | 1 | 0.68mi |
| 2207 NW 19th St Oklahoma City, OK | 1.0 | 1.5 | 1208 | $1,050 | $0.87 | 5d | 1 | 0.70mi |
| 1414 N Drexel Blvd Oklahoma City, OK | 2.0 | 1.0 | 1604 | $1,100 | $0.69 | 3d | 1 | 0.74mi |
| 2748 NW 22nd St Oklahoma City, OK | 2.0 | 1.0 | 1066 | $1,500 | $1.41 | 3d | 1 | 0.80mi |
| 2236 NW 22nd St Oklahoma City, OK | 2.0 | 1.0 | 1200 | $950 | $0.79 | 22d | 1 | 0.80mi |
| 2300 N Youngs Blvd Oklahoma City, OK | 1.0 | 1.0 | 1176 | $865 | $0.74 | 45d | 1 | 0.80mi |
| 1928 NW 18th St Oklahoma City, OK | 3.0 | 2.5 | 1914 | $2,200 | $1.15 | 45d | 1 | 0.84mi |
| 2605 NW 24th St Oklahoma City, OK | 2.0 | 1.0 | 1300 | $1,525 | $1.17 | 3d | 1 | 0.92mi |
| 2808 NW 24th St Unit A Oklahoma City, OK | 3.0 | 1.5 | 1604 | $1,595 | $0.99 | 4d | 1 | 0.97mi |
| 1138 N Blackwelder Ave Unit 3 Oklahoma City, OK | 2.0 | 2.0 | 1250 | $1,599 | $1.28 | 13d | 1 | 1.04mi |
| 1805 N Gatewood Ave Oklahoma City, OK | 2.0 | 1.0 | 1200 | $1,600 | $1.33 | 3d | 1 | 1.06mi |
| 2504 NW 27th St Oklahoma City, OK | 2.0 | 1.0 | 1303 | $1,450 | $1.11 | 45d | 1 | 1.08mi |
| 1721 NW 18th St Oklahoma City, OK | 3.0 | 2.0 | 1900 | $1,300 | $0.68 | 45d | 1 | 1.11mi |
| 3145 NW 21st St Oklahoma City, OK | 3.0 | 2.0 | 1728 | $1,600 | $0.93 | 3d | 1 | 1.12mi |
| 2736 NW 27th St Oklahoma City, OK | 3.0 | 2.0 | 1657 | $1,895 | $1.14 | 3d | 1 | 1.13mi |
| 1625 NW 16th St Unit 2 Oklahoma City, OK | 2.0 | 2.0 | 1136 | $1,850 | $1.63 | 45d | 1 | 1.13mi |
| 1628 NW 17th St Unit 1 Oklahoma City, OK | 2.0 | 1.0 | 1125 | $1,450 | $1.29 | 45d | 1 | 1.13mi |
| 1630 NW 17th St Unit 2 Oklahoma City, OK | 2.0 | 1.0 | 1125 | $1,400 | $1.24 | 45d | 1 | 1.14mi |
| 2301 N Florida Ave Oklahoma City, OK | 2.0 | 1.5 | 1700 | $1,235 | $0.73 | 18d | 1 | 1.23mi |
| 2400 NW 30th St Oklahoma City, OK | 1.0–2.0 | 1.0–2.0 | 801 | $1,279 | $1.60 | 3d | 11 | 1.30mi |
| 1419 NW 17th St Oklahoma City, OK | 1.0 | 1.0 | 1137 | $925 | $0.81 | 45d | 1 | 1.30mi |
| 2400 NW 30th St Oklahoma City, OK | 2.0 | 2.0 | 1078 | $1,289 | $1.20 | 45d | 1 | 1.31mi |
| 1407 1/2 NW 17th St Oklahoma City, OK | 1.0 | 1.0 | 1100 | $875 | $0.80 | 45d | 1 | 1.33mi |
| 1405 NW 17th St Oklahoma City, OK | 1.0 | 1.0 | 1100 | $975 | $0.89 | 45d | 1 | 1.33mi |
| 2004 NW 28th St Oklahoma City, OK | 2.0 | 1.0 | 1425 | $1,195 | $0.84 | 45d | 1 | 1.34mi |
| 1215 NW 13th St Oklahoma City, OK | 3.0 | 1.0 | 1368 | $2,200 | $1.61 | 45d | 1 | 1.37mi |
| 1209 NW 11th St Oklahoma City, OK | 2.0 | 2.5 | 1400 | $1,795 | $1.28 | 5d | 1 | 1.38mi |
| 1209 NW 11th St Oklahoma City, OK | 2.0 | 2.5 | 1400 | $1,795 | $1.28 | 18d | 1 | 1.38mi |
| 1322 NW 17th St Unit B Oklahoma City, OK | 2.0 | 1.0 | 1294 | $1,200 | $0.93 | 45d | 1 | 1.39mi |
| 3228 NW 27th St Oklahoma City, OK | 2.0 | 1.0 | 1088 | $1,195 | $1.10 | 13d | 1 | 1.43mi |
| 1219 NW 18th St Unit 1219 1/2 Oklahoma City, OK | 2.0 | 1.0 | 1200 | $1,400 | $1.17 | 45d | 1 | 1.48mi |
Listing history 41 events
-
2026-06-21days on market $210,000 Active 81 DOM
-
2026-06-18days on market $210,000 Active 78 DOM
-
2026-06-17days on market $210,000 Active 77 DOM
-
2026-06-16days on market $210,000 Active 76 DOM
-
2026-06-15days on market $210,000 Active 75 DOM
-
2026-06-13days on market $210,000 Active 73 DOM
-
2026-06-09days on market $210,000 Active 69 DOM
-
2026-06-08days on market $210,000 Active 68 DOM
-
2026-06-07days on market $210,000 Active 67 DOM
-
2026-06-05days on market $210,000 Active 64 DOM
-
2026-06-03days on market $210,000 Active 63 DOM
-
2026-06-02days on market $210,000 Active 62 DOM
-
2026-06-01days on market $210,000 Active 61 DOM
-
2026-05-31days on market $210,000 Active 60 DOM
-
2026-03-23$239,999 Active 677-char remark
Show marketing remark (677 chars)
Located at 1209 N Villa Ave in the heart of Oklahoma City, this charming duplex presents a fantastic investment opportunity with both units currently leased and generating income. Built in 1930, the property offers timeless character and charm while having been well maintained over the years. Each unit provides comfortable living spaces for tenants, with one unit featuring a stackable washer and dryer already provided for added convenience. With its classic appeal, solid rental history, and desirable central location, this duplex is a great opportunity for investors looking to expand their portfolio. Don’t miss out, reach out today! Gross monthly income is $1,255
-
2014-03-19soldstatus $78,000
-
2014-03-13soldstatus $78,000 126-char remark
Show marketing remark (126 chars)
NIce rental ... stays rented! Great location.... Each unit has 1 bed,1 bath,breakfast nook, living and dining- nice condition!
-
2014-01-28$84,900 126-char remark
Show marketing remark (126 chars)
NIce rental ... stays rented! Great location.... Each unit has 1 bed,1 bath,breakfast nook, living and dining- nice condition!
-
2011-10-17soldstatus $69,000
-
2011-10-12soldstatus $69,000
-
2010-11-11$69,000
-
2010-05-29historical
-
2010-01-11$79,000
-
2009-12-04historical
-
2009-06-03$79,000
-
2009-05-07historical
-
2008-11-07$79,000
-
2008-01-17historical
-
2007-12-19historical
-
2007-12-19historical
-
2007-10-25$89,000
-
2007-04-13$89,000
-
2006-03-24$105,000
-
2004-08-27soldstatus $65,000
-
2004-08-19soldstatus $65,000
-
2004-05-12$79,900
-
2004-02-04soldstatus $52,500
-
2004-01-30soldstatus $52,500
-
2004-01-08$52,500
-
1998-03-11soldstatus $20,000
-
1986-11-01soldstatus $25,000
ⓘ Source: listings_history table (triggers on properties + properties_extension) + one-shot
backfill from property_details.listing_events for pre-trigger history.
Tax reassessment forecast OK · Resets to sale price
- Current annual tax
- $1,636 · $136/mo
- Projected year-2 tax
- $1,890 · $157/mo
- Expected delta
- +$254/yr (+$21/mo · 15.5%)
ⓘ Screening estimate from a state-policy table — verify with the county assessor before closing.
Climate risk First Street
- Flood 1/10 Low FEMA zone X (unshaded) · 0% chance over 30 yrs
- Wildfire 1/10 Low
- Heat 6/10 Major 7 d/yr ≥107°F today · 19 d/yr by 30 yrs out
- Wind 2/10 Low 3% chance of damaging wind over 30 yrs
- Air quality 2/10 Low 1 unhealthy d/yr today · 2 by 30 yrs out
Nearby sold comps map
Loading sold comps map…
Walkable amenities ~0.75 mi
Loading nearby amenities…
Taxation est. · year 1
- Rental income
- $23,112
- − Mortgage interest
- −$11,763
- − Property taxes
- −$1,636
- − Insurance
- −$1,050
- − Repairs & maintenance
- −$1,849
- − Management
- −$1,849
- − Depreciation
- −$6,109
- Taxable loss
- −$1,144
- Est. tax savings @ 24.0%
- +$275
- After-tax cash flow
- $2,632/yr
For passive investors: Depreciation is non-cash, so a rental often shows a tax loss while cash-flowing — sheltering income. Rental losses are passive: they offset passive income freely, and up to $25,000/yr can offset ordinary (W-2) income if you actively participate and your MAGI is under $100k (phasing out to $0 by $150k); unused losses carry forward. On sale, claimed depreciation is recaptured at up to 25%, and gains may owe capital-gains tax (a 1031 exchange can defer both). Figures are a year-1 estimate at your 24.0% rate — not tax advice; consult a CPA.
Schools (NCES district)
- District
- Oklahoma City
- NCES district ID
- 4022770
- Math proficiency
- 7% ▼ -5.00%
- Reading proficiency
- 10% ▼ -6.00%
- Median HH income
- $35,606
- Composite
- 7.0/100
- National rank
- #9970
- State rank
- #254 of 270 in OK
Livability — Oklahoma City
- Score
- 80/100
- State rank
- #3
- US rank
- #1635
Category grades
Schools grade is shown separately in the Schools card above.
Census & demographics
- Census place
- Oklahoma City, OK
- County
- Oklahoma County · 771,644 people
- City population
- 498,656
- Metro
- Oklahoma City, OK
- Population (ZIP)
- 25,791
- Household income
- $56,873
- Rent vs Own
- Severe rent burden
- 1210.0
Population outlook (Oklahoma County) Hauer SSP2
- Today (2025)
- 911,875 people
- By 2030
- 982,413 · +7.7%
- By 2040
- 1,130,468 · +24.0%
- By 2050
- 1,288,422 · +41.3%
- By 2075
- 1,711,482 · +87.7%
- By 2100
- 2,088,448 · +129.0%
Race, ethnicity, and origin ACS 2023
- Neighborhood character
- Diverse neighborhood (Simpson 0.64)
- Race & ethnicity
- White 47% Hispanic / Latino 37% Two or more races 13% Native American 6% Black 5% Asian 2%
- Hispanic origin (detail)
- Mexican 22%
- Common ancestry
- Lithuanian 1% Italian 1% Slovak 1%
- Foreign-born
- 19% · Canada, Vietnam
- Languages at home
- 67% English-only · Spanish 30% Vietnamese 1%
Political lean MEDSL · Oklahoma
- 2024 margin
- Toss-up / Even · D 48.0% · R 49.7% · Other 2.3%
- 2008→2024 swing
- +15.1pp toward D · 2008: -16.8pp · 2024: -1.7pp
- All cycles
- 2024: R+1.7 2020: R+1.1 2016: R+10.5 2012: R+16.7 2008: R+16.8
Not yet ingested
- Civics
- —
Market trends
- HPI YoY
- ▼ -245.03%
- Current HPI
- 274.7844
- Rent YoY
- ▲ 7.29%
- Metro
- Oklahoma City, OK
- State GDP YoY
- ▲ 1.55%
- F500 in state
- 6
Industry mix (Fortune 500 HQ in OK)
| Industry | F500 HQs | Revenue |
|---|---|---|
| Energy | 3 | $48B |
|
||
Price history
+860.0% since first listed27 events — show timeline
- 2026-03-23 Listed $239,999 MLSOK
- 2014-03-19 Sold (Public Records) $78,000 Public Records
- 2014-03-13 Sold (MLS) $78,000 MLSOK
- 2014-01-28 Listed $84,900 MLSOK
- 2011-10-17 Sold (Public Records) $69,000 Public Records
- 2011-10-12 Sold (MLS) $69,000 MLSOK
- 2010-11-11 Listed $69,000 MLSOK
- 2010-05-29 Listing Removed — MLSOK
- 2010-01-11 Listed $79,000 MLSOK
- 2009-12-04 Listing Removed — MLSOK
- 2009-06-03 Listed $79,000 MLSOK
- 2009-05-07 Listing Removed — MLSOK
- 2008-11-07 Listed $79,000 MLSOK
- 2008-01-17 Listing Removed — MLSOK
- 2007-12-19 Listing Removed — MLSOK
- 2007-12-19 Listing Removed — MLSOK
- 2007-10-25 Listed $89,000 MLSOK
- 2007-04-13 Listed $89,000 MLSOK
- 2006-03-24 Listed $105,000 MLSOK
- 2004-08-27 Sold (Public Records) $65,000 Public Records
- 2004-08-19 Sold (MLS) $65,000 MLSOK
- 2004-05-12 Listed $79,900 MLSOK
- 2004-02-04 Sold (Public Records) $52,500 Public Records
- 2004-01-30 Sold (MLS) $52,500 MLSOK
- 2004-01-08 Listed $52,500 MLSOK
- 1998-03-11 Sold (Public Records) $20,000 Public Records
- 1986-11-01 Sold (Public Records) $25,000 Public Records
Property tax history
+5.8%/yrLatest (2025): $1,636 · +4.2% YoY. Source: county tax records.
Cash-flow waterfall
monthlySold comps — $/sqft
last 12 mo · ≤1 miLoading sold comps…