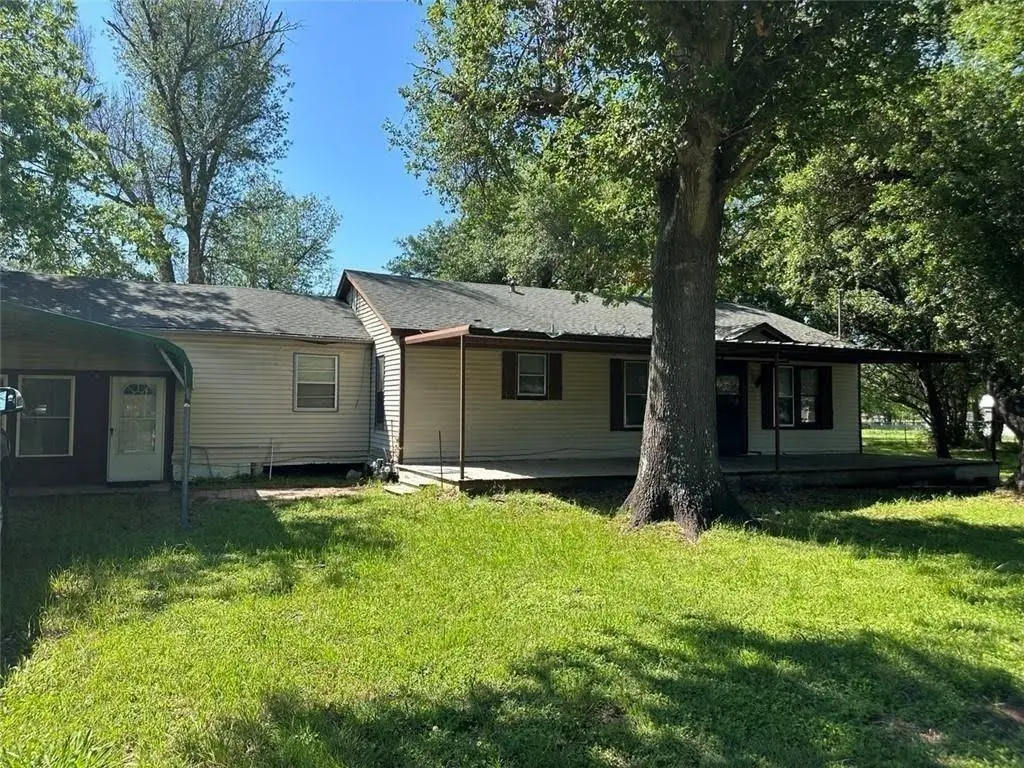
602 S Mignonette St · Kosse, TX
Flood risk 1/10 · Minimal
- FEMA flood zone
- X (unshaded)
- Chance of flooding over 30 yrs
- 0.0%
- Est. flood insurance / yr
- $507 – $1,088
Fire risk 5/10 · Moderate
- Est. fire insurance / yr
- $1,222 – $2,270
Heat risk 7/10 · Major
- Hot days now (above 109°F)
- 7 days/yr
- Hot days in 30 yrs
- 25 days/yr
Wind risk 8/10 · Major
- Chance of severe wind over 30 yrs
- 80.0%
Air-quality risk 1/10 · Minimal
- Unhealthy air days now
- 0 days/yr
- Unhealthy air days in 30 yrs
- 0 days/yr
Risk factors via First Street. Map © Google.
Why this score? — see what drove the A- grade
The composite is a weighted blend of 9 inputs, each scored 0–100. Each bar is that input's sub-score; the figure is the points it added to the 100-point composite (weight × sub-score).
- Cash flow +30.0/30.0
- ARV discount +15.0/15.0
- 1% rule +10.0/10.0
- DSCR +10.0/10.0
- Appreciation +5.3/10.0
- Livability +2.8/5.0
- Rent growth +2.5/5.0
- Schools +2.5/10.0
- Condition / age +2.5/5.0
$79,000
🖨 Deal sheet 📄 Offer letter ✓ Due diligence
Listing remarks
Investor special with exceptional upside in Kosse! Situated on a full acre, this 1,760 sq ft property offers a prime value-add opportunity for fix-and-flip investors or buy-and-hold landlords looking to maximize returns. Featuring 3 bedrooms, 2 full baths, and 2 half baths, the layout provides a solid foundation for renovation and reconfiguration. This property boasts strong bones and a functional footprint, making it an ideal canvas for your next project. With ample space to expand or enhance, there’s significant potential to increase square footage, improve functionality, and drive ARV. The generous lot size opens the door for additional improvements, outdoor upgrades, or even futur
Key facts
- Functional footprint
- Strong bones
- Full acre
Tags
Property features AI
Finance
- Other: Located in Limestone County, subdivision Kosse Div Ix; Directions available to property; Listing arranged as exclusive right to sell
- Financial info: Listing is for cash buyers; Treat as clear loan type; No second mortgage
- HOA & community: No homeowners association
Exterior
- Parking: Covered parking; 1 covered space; 1 carport space
- Utilities: City water; City sewer; Electricity connected; Not in a Municipal Utility District
- Home design: Single family residence; Residential property; Built in 1970
- Construction: Year built: 1970
- Exterior features: Approximately 1 acre lot; Will not subdivide
Interior
- Kitchen: Other appliances
- Bedrooms: 3 bedrooms (primary bedroom on main level)
- Bathrooms: 2 full bathrooms
- Interior features: One-level layout; One living area; One dining area; Other interior features
Neighborhood map
What this means for you Summary
Snapshot
- This is a 3-bed/2.0-bath single-family listed at $79k.
Deal economics
- At list price, monthly cash flow is $589 ($7k/yr) — positive.
- The deal already cash-flows at list — no discount required.
- Meets the 1% rule at list price ($2k rent vs $79k).
- Recommended offer: $78k (1.5% below list) — sets the bar for market timing.
Location & tenants
- Location reads 56/100 on livability (#1,321 in TX) — a working-class tenant base; expect higher turnover. Strengths: cost of living A+, housing A+; Watch: schools F, crime F, amenities F.
- Groesbeck ISD (rural): math 28% / reading 31% proficiency, ranked #634 of 826 in TX (top 77%) — low school quality limits family demand, transient renter base, plan for 1-2y turnover.
- Market conditions: 55 active listings in the ZIP; 1 comparable units currently listed for rent nearby; 17 units permitted in Limestone County in 2024 (0 in 5+ unit buildings).
Forward outlook
- In year one you build about $1k of equity ($546 loan paydown + $502 appreciation (0.6% local appreciation)).
- Limestone County population projected to shrink 4% by 2050 — rents likely to lag national; underwrite the cash flow, not the appreciation.
- At projected returns (0.6% appreciation + 3.0% rent growth), your $22k cash investment doubles in ~3 years — after that, you're playing with house money.
Negotiation context
- It's been on market 29 days — a 2% lower offer ($78k) is reasonable based on typical stale-listing flexibility.
- 10 sale attempts since 3y ago; this cycle's ask has dropped $16k (17%) from the opening price — seller is motivated, your offer sets the floor, not the list.
Risks & watch-outs
- Watch-outs: property tax is 2.9% of price.
- Climate carrying-cost: severe wind risk, 80% chance of damaging wind over 30y; moderate wildfire risk; extreme-heat days projected 7→25/yr by 2055 (HVAC capex compounding) — expect insurance premiums to compound above CPI over the hold.
Questions for the listing agent
- Built in 1970 — when were the roof, HVAC, electrical panel, plumbing, and water heater last replaced?
- Property tax is high relative to price — has the assessment been appealed recently, and will the sale trigger a re-assessment?
- Is there a deadline driving the sale (1031 exchange, divorce, estate, relocation)? That informs how much negotiation room exists.
- Schools are F-rated, which usually means shorter tenancies and higher turnover. Who's the typical renter profile here, and what's been the actual vacancy rate?
- Crime grade is F in this area — have there been break-ins, vandalism, or insurance claims at this property in the last 3 years? What carrier currently insures it and at what premium?
- What's the average days-on-market for RENTAL listings here right now (not sales)? A rising rental-DOM trend means longer vacancies and softer asking-rent achievability than the comps imply.
- What's the recent tenant-quality profile in this submarket — average credit score on applications, eviction rate, late-payment / NSF rate, and stable-employment percentage? A property-management company in the area should have these aggregated.
- How much new for-sale + rental construction is in the pipeline within 1–3 miles? Heavy new supply typically softens prices + rents 12–24 months out; constrained supply supports both.
Investment metrics
- 1% rule
- 1.96% ✓
- Cap rate
- 15.24%
- Cash-on-cash
- 31.97%
- DSCR
- 2.42
- GRM
- 4.2
CMA / ARV
- ARV (median comp)
- $130,292
- List price
- $79,000
- Delta
- -39.37%
- Verdict
- UNDERPRICED
- Comps
- 17 within 1.0 mi
Show comp detail 5 sales within ~0.75 mi
| Address | Dist | Beds/Ba | Sqft | Sold | Price | $/sf | Match |
|---|---|---|---|---|---|---|---|
| 804 S Mignonette St | 0.16mi | 3/2.0 | 1,671 (-5%) | 22mo | $265,000 | $159 | 66 |
| 510 W Washington | 0.44mi | 3/1.0 | 1,680 (-4%) | 4mo | $59,000 | $35 | 65 |
| 803 S Mignonette Hwy | 0.14mi | 2/2.0 (-1) | 1,864 (+6%) | 18mo | $310,000 | $166 | 63 |
| 502 N Mignonette Dr | 0.61mi | 3/2.0 | 1,500 (-15%) | 3mo | $229,000 | $153 | 45 |
| 605 N Myrtle St | 0.69mi | 2/2.0 (-1) | 1,538 (-13%) | 24mo | $135,000 | $88 | 22 |
Match score weights: distance 35% · size 25% · config 20% · recency 20%. Top-matched comps best support the ARV.
Projected returns pro-forma
0.64% appreciation · 3.0% rent growth · sell at horizon
- IRR
- 33.8%
- Equity multiple
- 2.70×
- Total profit
- $37,690
- Equity at exit
- $25,480
- IRR
- 36.5%
- Equity multiple
- 5.28×
- Total profit
- $94,607
- Equity at exit
- $32,737
Cash invested: $22,120 (down + closing). Projections, not guarantees.
Landlord ↔ Tenant lean methodology
- Overall (STATE)
- 87 Strongly Landlord-Friendly
- State Texas
- 87 Strongly Landlord-Friendly · R+5
- County
- — inherits STATE
- City
- — inherits STATE
ZIP-level market 76653
- Home prices YoY
- 0.5%
- Active inventory
- 55
- Price-to-rent
- 4.2×
Monthly cashflow live
- Estimated rent
- $1,550 medium interval (Pro) →
- Mortgage (P&I)
- −$414
- Tax from tax record
- −$188 /mo · $2,256/yr
- Insurance
- −$33
- HOA
- −$0
- Vacancy / Maint / Mgmt
- −$326
- Net cashflow
- $589
Break-even live
UW: 25.0% down · 7.5% · 30yr · 1.5% tax · 5.0% vac · 8.0% maint · 8.0% mgmt
Financing live
Cash to close
- Down payment
- $19,750
- Closing costs
- $2,370
- Reserves months
- —
- Total cash needed
- —
Loan-product check · same deal, 3 products live
Conventional
25% down · 7.5% · 30yr
- Down + closing
- —
- Monthly P&I
- —
- Monthly cashflow
- —
- DSCR
- —
- Eligible?
- —
Personal DTI + credit; lowest rate.
DSCR
20% down · 8.5% · 30yr
- Down + closing
- —
- Monthly P&I
- —
- Monthly cashflow
- —
- DSCR
- —
- Eligible?
- —
No personal income docs; deal must DSCR.
Hard money
10% down · 12.0% · 12mo
- Down + closing
- —
- Monthly P&I
- —
- Monthly cashflow
- —
- DSCR
- —
- Eligible?
- —
Short-term bridge; refi at stabilization.
Rent comps 1 comps
| Address | Beds | Baths | Sqft | Rent | $/sqft | DOM | Units | Dist |
|---|---|---|---|---|---|---|---|---|
| 200 S Narcissus St Kosse, TX | 3.0 | 2.0 | 1456 | $1,550 | $1.06 | 21d | 1 | 0.34mi |
Listing history 29 events
-
2026-06-02days on market $79,000 Active 29 DOM
-
2026-06-01days on market $79,000 Active 28 DOM
-
2026-05-31days on market $79,000 Active 27 DOM
-
2026-05-13price $79,000 993-char remark
-
2026-05-04$94,800 Active 993-char remark
-
2026-04-29status Active
-
2026-04-29historical
-
2026-02-18$89,000 Active
-
2025-06-30historical
-
2025-06-30historical
-
2025-05-12price $90,000
-
2025-05-12price $90,000
-
2025-05-12price $90,000
-
2025-03-15status Active
-
2024-11-01price $96,000
-
2024-11-01price $96,000
-
2024-10-07price $108,000
-
2024-10-07price $108,000
-
2024-07-29status Active
-
2024-07-29status Active
-
2024-06-05status Pending
-
2024-06-05status Pending
-
2024-04-23$115,000 Active
-
2024-04-23$96,000 Active
-
2024-04-23$115,000 Active
-
2024-01-30price $115,000
-
2023-10-20price $129,900
-
2023-09-23$135,000 Active
-
2000-08-03soldstatus
ⓘ Source: listings_history table (triggers on properties + properties_extension) + one-shot
backfill from property_details.listing_events for pre-trigger history.
Tax reassessment forecast TX · Resets to sale price
- Current annual tax
- $2,256 · $188/mo
- Projected year-2 tax
- $2,256 · $188/mo
- Expected delta
- $0/yr ($0/mo · 0.0%)
ⓘ Screening estimate from a state-policy table — verify with the county assessor before closing.
Climate risk First Street
- Flood 1/10 Low FEMA zone X (unshaded) · 0% chance over 30 yrs
- Wildfire 5/10 Major
- Heat 7/10 Severe 7 d/yr ≥109°F today · 25 d/yr by 30 yrs out
- Wind 8/10 Severe 80% chance of damaging wind over 30 yrs
- Air quality 1/10 Low 0 unhealthy d/yr today · 0 by 30 yrs out
Nearby sold comps map
Loading sold comps map…
Walkable amenities ~0.75 mi
Loading nearby amenities…
Taxation est. · year 1
- Rental income
- $18,600
- − Mortgage interest
- −$4,425
- − Property taxes
- −$2,256
- − Insurance
- −$395
- − Repairs & maintenance
- −$1,488
- − Management
- −$1,488
- − Depreciation
- −$2,298
- Taxable income
- $6,250
- Est. tax owed @ 24.0%
- −$1,500
- After-tax cash flow
- $5,572/yr
For passive investors: Depreciation is non-cash, so a rental often shows a tax loss while cash-flowing — sheltering income. Rental losses are passive: they offset passive income freely, and up to $25,000/yr can offset ordinary (W-2) income if you actively participate and your MAGI is under $100k (phasing out to $0 by $150k); unused losses carry forward. On sale, claimed depreciation is recaptured at up to 25%, and gains may owe capital-gains tax (a 1031 exchange can defer both). Figures are a year-1 estimate at your 24.0% rate — not tax advice; consult a CPA.
Schools (NCES district)
- District
- Groesbeck ISD
- NCES district ID
- 4821810
- Math proficiency
- 28% ▼ -10.00%
- Reading proficiency
- 31% ▼ -9.00%
- Median HH income
- $44,929
- Composite
- 25.3/100
- National rank
- #7487
- State rank
- #634 of 826 in TX
Livability — Kosse
- Score
- 56/100
- State rank
- #1321
- US rank
- #22745
Category grades
Schools grade is shown separately in the Schools card above.
Census & demographics
- Census place
- Kosse, TX
- Population (ZIP)
- 1,133
Population outlook (Limestone County) Hauer SSP2
- Today (2025)
- 23,396 people
- By 2030
- 23,214 · -0.8%
- By 2040
- 22,829 · -2.4%
- By 2050
- 22,516 · -3.8%
- By 2075
- 22,088 · -5.6%
- By 2100
- 20,354 · -13.0%
Race, ethnicity, and origin ACS 2023
- Neighborhood character
- Predominantly White (87%)
- Race & ethnicity
- White 87% Two or more races 6% Hispanic / Latino 5% Black 3% Asian 2%
- Hispanic origin (detail)
- Mexican 4%
- Common ancestry
- Romanian 5% Lithuanian 3% Slovak 2%
- Foreign-born
- 2% · South Korea, Vietnam, Canada
- Languages at home
- 98% English-only · Spanish 1% Vietnamese 1%
Political lean MEDSL · Limestone
- 2024 margin
- Solid R (+56.9) · D 21.2% · R 78.1%
- 2008→2024 swing
- -23.4pp toward R · 2008: -33.5pp · 2024: -56.9pp
- All cycles
- 2024: R+56.9 2020: R+50.3 2016: R+52.3 2012: R+40.7 2008: R+33.5
Not yet ingested
- Civics
- —
Market trends
- HPI YoY
- ▲ 0.64%
- Current HPI
- 133.8611
- Rent YoY
- —
- Metro
- —
- State GDP YoY
- ▲ 3.95%
- F500 in state
- 110
Industry mix (Fortune 500 HQ in TX)
| Industry | F500 HQs | Revenue |
|---|---|---|
| Energy | 16 | $1,198B |
|
||
| Technology | 5 | $198B |
|
||
| Engineering / Construction | 4 | $72B |
|
||
| Energy Services | 3 | $60B |
|
||
| Utilities | 3 | $41B |
|
||
| Healthcare | 2 | $330B |
|
||
Price history
-41.5% since first listed26 events — show timeline
- 2026-05-13 Price Changed $79,000 NTREIS
- 2026-05-04 Listed $94,800 NTREIS
- 2026-04-29 Relisted — NTREIS
- 2026-04-29 Listing Removed — NTREIS
- 2026-02-18 Listed $89,000 NTREIS
- 2025-06-30 Listing Removed — CTXMLS
- 2025-06-30 Listing Removed — NTREIS
- 2025-05-12 Price Changed $90,000 NTREIS
- 2025-05-12 Price Changed $90,000 BCSRMLS
- 2025-05-12 Price Changed $90,000 CTXMLS
- 2025-03-15 Relisted — BCSRMLS
- 2024-11-01 Price Changed $96,000 BCSRMLS
- 2024-11-01 Price Changed $96,000 CTXMLS
- 2024-10-07 Price Changed $108,000 BCSRMLS
- 2024-10-07 Price Changed $108,000 CTXMLS
- 2024-07-29 Relisted — BCSRMLS
- 2024-07-29 Relisted — CTXMLS
- 2024-06-05 Pending — BCSRMLS
- 2024-06-05 Pending — CTXMLS
- 2024-04-23 Listed $115,000 BCSRMLS
- 2024-04-23 Listed $115,000 CTXMLS
- 2024-04-23 Listed $96,000 NTREIS
- 2024-01-30 Price Changed $115,000 BCSRMLS
- 2023-10-20 Price Changed $129,900 BCSRMLS
- 2023-09-23 Listed $135,000 BCSRMLS
- 2000-08-03 Sold (Public Records) — Public Records
Property tax history
+4.3%/yrLatest (2025): $2,256 · -32.8% YoY. Source: county tax records.
Cash-flow waterfall
monthlySold comps — $/sqft
last 12 mo · ≤1 miLoading sold comps…