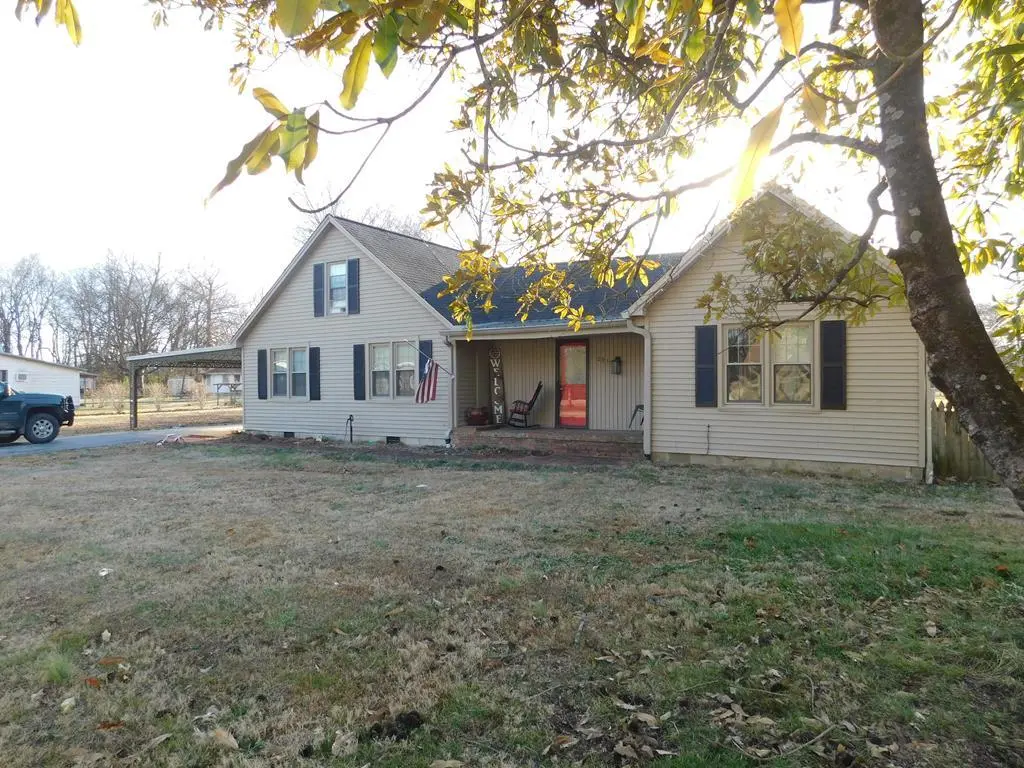
221 N Ewing St · Guthrie, KY
Flood risk 5/10 · Moderate
- FEMA flood zone
- X
- Chance of flooding over 30 yrs
- 0.59%
- Est. flood insurance / yr
- $435 – $905
Fire risk 1/10 · Minimal
- Est. fire insurance / yr
- $839 – $1,559
Heat risk 6/10 · Moderate
- Hot days now (above threshold)
- 7 days/yr
- Hot days in 30 yrs
- 21 days/yr
Wind risk No data
- Chance of severe wind over 30 yrs
- —
Air-quality risk 2/10 · Minimal
- Unhealthy air days now
- 0 days/yr
- Unhealthy air days in 30 yrs
- 1 days/yr
Risk factors via First Street. Map © Google.
Why this score? — see what drove the D- grade
The composite is a weighted blend of 9 inputs, each scored 0–100. Each bar is that input's sub-score; the figure is the points it added to the 100-point composite (weight × sub-score).
- ARV discount +15.0/15.0
- Cash flow +8.4/30.0
- Livability +3.2/5.0
- Schools +2.6/10.0
- Rent growth +2.5/5.0
- Condition / age +2.5/5.0
- 1% rule +2.3/10.0
- DSCR +2.3/10.0
- Appreciation +0.5/10.0
$165,000
🖨 Deal sheet (PDF) 📄 Offer letter ✓ Due diligence
Listing remarks MLS
Welcome to your personal slice of paradise nestled in a tranquil neighborhood, where the charm of country living meets modern conveniences. This 5-bedroom, 2-bathroom house is more than just a home; it's a lifestyle waiting to be embraced. Plenty of room for a garden and chickens!
Key facts
- Room for a garden
- Modern conveniences
- Pool
Tags
Neighborhood map
What this means for you Summary
Snapshot
- This is a 3-bed/1.5-bath single-family listed at $165k.
Deal economics
- At list price, monthly cash flow is $-147 ($-2k/yr) — negative.
- To cash-flow at today's rent, offer at most $139k (15.7% below list).
- To meet the 1% rule (rent ≥ 1% of price), the offer needs to be $120k (27.3% below list).
- Recommended offer: $120k (27.3% below list) — sets the bar for 1% rule.
- Cap rate 5.2% vs local median 1.6% in Guthrie — top-decile yield for the area; either an underpriced asset or a hidden risk that comps aren't pricing in. Stress-test before assuming the spread holds.
Location & tenants
- Location reads 63/100 on livability (#328 in KY) — a middle-class / working-renter tenant base. Strengths: crime A+, cost of living A+, housing A+; Watch: schools C-, amenities F, commute F.
- Todd County (rural): math 23% / reading 39% proficiency, ranked #99 of 165 in KY (top 60%) — families likely to look elsewhere, expect single-tenant / working-renter base with shorter leases.
- Market conditions: 14 active listings in the ZIP; 1 comparable units currently listed for rent nearby; 42 units permitted in Todd County in 2024 (0 in 5+ unit buildings).
Forward outlook
- Local home prices are declining (-3.0%/yr); year-one equity from $1k of loan paydown is wiped out by about $5k of value loss. Plan a longer hold.
- Todd County population projected at -15% by 2050 — secular population decline; favor cash flow + early exit over multi-decade hold.
Negotiation context
- It's been on market 148 days — a 12% lower offer ($145k) is reasonable based on typical stale-listing flexibility.
- 6 sale attempts since 4y ago; this cycle's ask has dropped $84k (34%) from the opening price — seller is motivated, your offer sets the floor, not the list.
Risks & watch-outs
- Climate carrying-cost: moderate flood risk; extreme-heat days projected 7→21/yr by 2055 (HVAC capex compounding) — expect insurance premiums to compound above CPI over the hold.
Questions for the listing agent
- What do current leases actually rent for vs. the listed asking? Can we see a recent rent roll and the last 12 months of T-12 income?
- It's been on market 148 days. Have you received any prior offers? Is the seller open to a 27% concession, seller financing, or rate buy-down credit?
- Built in 1960 — when were the roof, HVAC, electrical panel, plumbing, and water heater last replaced?
- Why hasn't it sold? Are there any deal-killer items the seller is aware of (foundation, flood, title, zoning, code violations)?
- Is there a deadline driving the sale (1031 exchange, divorce, estate, relocation)? That informs how much negotiation room exists.
- The area grade is low — what's the realistic commute time and amenity access for the typical tenant pool here? Any planned neighborhood developments (good or bad) we should know about?
- What's the average days-on-market for RENTAL listings here right now (not sales)? A rising rental-DOM trend means longer vacancies and softer asking-rent achievability than the comps imply.
- What's the recent tenant-quality profile in this submarket — average credit score on applications, eviction rate, late-payment / NSF rate, and stable-employment percentage? A property-management company in the area should have these aggregated.
- How much new for-sale + rental construction is in the pipeline within 1–3 miles? Heavy new supply typically softens prices + rents 12–24 months out; constrained supply supports both.
Investment metrics
- 1% rule
- 0.73% ✗
- Cap rate
- 5.23%
- Cash-on-cash
- -3.81%
- DSCR
- 0.83
- GRM
- 11.5
CMA / ARV
- ARV (median comp)
- $224,633
- List price
- $165,000
- Delta
- -26.55%
- Verdict
- UNDERPRICED
- Comps
- 4 within 1.0 mi
Show comp detail 5 sales within ~0.75 mi
| Address | Dist | Beds/Ba | Sqft | Sold | Price | $/sf | Match |
|---|---|---|---|---|---|---|---|
| 363 Third St | 0.27mi | 3/2.0 | 1,850 (+1%) | 2mo | $92,000 | $50 | 82 |
| 206 N Ewing St | 0.22mi | 4/1.0 (+1) | 1,600 (-13%) | 2mo | $200,000 | $125 | 60 |
| 249 Summer St | 0.57mi | 3/2.0 | 1,716 (-6%) | 2mo | $465,000 | $271 | 59 |
| 418 Second St | 0.24mi | 3/1.0 | 1,569 (-14%) | 12mo | $182,200 | $116 | 53 |
| 514 Edlin St | 0.44mi | 3/2.5 | 1,628 (-11%) | 11mo | $299,000 | $184 | 48 |
Match score weights: distance 35% · size 25% · config 20% · recency 20%. Top-matched comps best support the ARV.
Projected returns pro-forma
-3.0% appreciation · 3.0% rent growth · sell at horizon
- IRR
- -22.7%
- Equity multiple
- 0.22×
- Total profit
- $-36,082
- Equity at exit
- $24,602
- IRR
- -17.1%
- Equity multiple
- 0.06×
- Total profit
- $-43,481
- Equity at exit
- $14,266
Cash invested: $46,200 (down + closing). Projections, not guarantees.
Landlord ↔ Tenant lean methodology
- Overall (STATE)
- 83 Strongly Landlord-Friendly
- State Kentucky
- 83 Strongly Landlord-Friendly · R+16
- County
- — inherits STATE
- City
- — inherits STATE
ZIP-level market 42234
- Home prices YoY
- -2.9%
- Active inventory
- 14
- Price-to-rent
- 11.5×
Monthly cashflow live
- Estimated rent
- $1,200 medium interval (Pro) →
- Mortgage (P&I)
- −$865
- Tax from tax record
- −$161 /mo · $1,927/yr
- Insurance
- −$69
- HOA
- −$0
- Vacancy / Maint / Mgmt
- −$252
- Net cashflow
- $-147
Break-even live
Sensitivity live
| Price | -10% $-53 | -5% $-100 | +0% $-147 | +5% $-193 | +10% $-240 |
|---|---|---|---|---|---|
| Rent | -10% $-241 | -5% $-194 | +0% $-147 | +5% $-99 | +10% $-52 |
| Rate | -1.0pp $-63 | -0.5pp $-105 | base $-147 | +0.5pp $-189 | +1.0pp $-233 |
UW: 25.0% down · 7.5% · 30yr · 1.5% tax · 5.0% vac · 8.0% maint · 8.0% mgmt
Financing live
Cash to close
- Down payment
- $41,250
- Closing costs
- $4,950
- Reserves months
- —
- Total cash needed
- —
Loan-product check · same deal, 3 products live
Conventional
25% down · 7.5% · 30yr
- Down + closing
- —
- Monthly P&I
- —
- Monthly cashflow
- —
- DSCR
- —
- Eligible?
- —
Personal DTI + credit; lowest rate.
DSCR
20% down · 8.5% · 30yr
- Down + closing
- —
- Monthly P&I
- —
- Monthly cashflow
- —
- DSCR
- —
- Eligible?
- —
No personal income docs; deal must DSCR.
Hard money
10% down · 12.0% · 12mo
- Down + closing
- —
- Monthly P&I
- —
- Monthly cashflow
- —
- DSCR
- —
- Eligible?
- —
Short-term bridge; refi at stabilization.
Rent comps 1 comps
| Address | Beds | Baths | Sqft | Rent | $/sqft | DOM | Units | Dist |
|---|---|---|---|---|---|---|---|---|
| 402 N 2nd St Guthrie, KY | 3.0 | 1.0 | 1537 | $1,200 | $0.78 | 8d | 1 | 0.21mi |
Listing history 33 events
-
2026-06-18days on market $165,000 Active 148 DOM
-
2026-06-17days on market $165,000 Active 147 DOM
-
2026-06-16days on market $165,000 Active 146 DOM
-
2026-06-15pricedays on market $165,000 Active 145 DOM
-
2026-06-14days on market $199,900 Active 143 DOM
-
2026-06-13days on market $199,900 Active 142 DOM
-
2026-06-10days on market $199,900 Active 140 DOM
-
2026-06-09days on market $199,900 Active 139 DOM
-
2026-06-08days on market $199,900 Active 138 DOM
-
2026-06-07days on market $199,900 Active 137 DOM
-
2026-06-02days on market $199,900 Active 132 DOM
-
2026-06-01days on market $199,900 Active 131 DOM
-
2026-05-31days on market $199,900 Active 130 DOM
-
2026-05-30days on market $199,900 Active 129 DOM
-
2026-04-01price $199,900 281-char remark
Show marketing remark (281 chars)
Welcome to your personal slice of paradise nestled in a tranquil neighborhood, where the charm of country living meets modern conveniences. This 5-bedroom, 2-bathroom house is more than just a home; it's a lifestyle waiting to be embraced. Plenty of room for a garden and chickens!
-
2026-02-21price $224,900 281-char remark
Show marketing remark (281 chars)
Welcome to your personal slice of paradise nestled in a tranquil neighborhood, where the charm of country living meets modern conveniences. This 5-bedroom, 2-bathroom house is more than just a home; it's a lifestyle waiting to be embraced. Plenty of room for a garden and chickens!
-
2026-01-21$248,900 Active 281-char remark
Show marketing remark (281 chars)
Welcome to your personal slice of paradise nestled in a tranquil neighborhood, where the charm of country living meets modern conveniences. This 5-bedroom, 2-bathroom house is more than just a home; it's a lifestyle waiting to be embraced. Plenty of room for a garden and chickens!
-
2025-10-03historical
-
2025-09-04status Active
-
2025-05-22historical Active Under Contract
-
2025-05-12$249,900 Active
-
2024-01-20historical
-
2024-01-12status Active
-
2023-12-31historical Active Under Contract
-
2023-12-11price $275,000
-
2023-11-14price $284,000
-
2023-11-07$295,000 Active
-
2023-11-06historical
-
2022-05-20soldstatus $229,900
-
2022-05-18soldstatus $229,900
-
2022-03-25$229,900
-
2018-10-10soldstatus $119,000
-
2016-12-29soldstatus $100,000
ⓘ Source: listings_history table (triggers on properties + properties_extension) + one-shot
backfill from property_details.listing_events for pre-trigger history.
Tax reassessment forecast KY · Resets to sale price
- Current annual tax
- $1,927 · $161/mo
- Projected year-2 tax
- $1,927 · $161/mo
- Expected delta
- $0/yr ($0/mo · 0.0%)
ⓘ Screening estimate from a state-policy table — verify with the county assessor before closing.
Climate risk First Street
- Flood 5/10 Major FEMA zone X · 59% chance over 30 yrs
- Wildfire 1/10 Low
- Heat 6/10 Major
- Air quality 2/10 Low 0 unhealthy d/yr today · 1 by 30 yrs out
Nearby sold comps map
Loading sold comps map…
Walkable amenities ~0.75 mi
Loading nearby amenities…
Taxation est. · year 1
- Rental income
- $14,400
- − Mortgage interest
- −$9,243
- − Property taxes
- −$1,927
- − Insurance
- −$825
- − Repairs & maintenance
- −$1,152
- − Management
- −$1,152
- − Depreciation
- −$4,800
- Taxable loss
- −$4,698
- Est. tax savings @ 24.0%
- +$1,128
- After-tax cash flow
- $-631/yr
For passive investors: Depreciation is non-cash, so a rental often shows a tax loss while cash-flowing — sheltering income. Rental losses are passive: they offset passive income freely, and up to $25,000/yr can offset ordinary (W-2) income if you actively participate and your MAGI is under $100k (phasing out to $0 by $150k); unused losses carry forward. On sale, claimed depreciation is recaptured at up to 25%, and gains may owe capital-gains tax (a 1031 exchange can defer both). Figures are a year-1 estimate at your 24.0% rate — not tax advice; consult a CPA.
Schools (NCES district)
- District
- Todd County
- NCES district ID
- 2105550
- Math proficiency
- 23% ▼ -16.00%
- Reading proficiency
- 39% ▼ -15.00%
- Median HH income
- $39,989
- Composite
- 26.01/100
- National rank
- #7315
- State rank
- #99 of 165 in KY
Livability — Guthrie
- Score
- 63/100
- State rank
- #328
- US rank
- #15684
Category grades
Schools grade is shown separately in the Schools card above.
Census & demographics
- Census place
- Guthrie, KY
- Population (ZIP)
- 2,299
Population outlook (Todd County) Hauer SSP2
- Today (2025)
- 12,073 people
- By 2030
- 11,770 · -2.5%
- By 2040
- 11,082 · -8.2%
- By 2050
- 10,250 · -15.1%
- By 2075
- 8,037 · -33.4%
- By 2100
- 5,654 · -53.2%
Race, ethnicity, and origin ACS 2023
- Neighborhood character
- Predominantly White (69%)
- Race & ethnicity
- White 69% Black 18% Hispanic / Latino 10% Two or more races 4%
- Hispanic origin (detail)
- Mexican 8%
- Common ancestry
- Slovak 1% Polish 1% Lithuanian 1%
- Foreign-born
- 4% · Canada
- Languages at home
- 77% English-only · German/W. Germanic 16% Spanish 7%
Political lean MEDSL · Todd
- 2024 margin
- Solid R (+57.9) · D 20.6% · R 78.4% · Other 1.0%
- 2008→2024 swing
- -21.6pp toward R · 2008: -36.3pp · 2024: -57.9pp
- All cycles
- 2024: R+57.9 2020: R+53.3 2016: R+53.9 2012: R+39.1 2008: R+36.3
Not yet ingested
- Civics
- —
Market trends
- HPI YoY
- ▼ -8.98%
- Current HPI
- 299.0887
- Rent YoY
- —
- Metro
- —
- State GDP YoY
- ▲ 1.81%
- F500 in state
- 4
Industry mix (Fortune 500 HQ in KY)
| Industry | F500 HQs | Revenue |
|---|---|---|
| Healthcare | 1 | $118B |
|
||
| Food / Beverage | 1 | $7B |
|
||
Price history
+99.9% since first listed19 events — show timeline
- 2026-04-01 Price Changed $199,900 HCTCBOR
- 2026-02-21 Price Changed $224,900 HCTCBOR
- 2026-01-21 Listed $248,900 HCTCBOR
- 2025-10-03 Listing Removed — REALTRACS as Distributed by MLS Grid
- 2025-09-04 Relisted — REALTRACS as Distributed by MLS Grid
- 2025-05-22 Contingent — REALTRACS as Distributed by MLS Grid
- 2025-05-12 Listed $249,900 REALTRACS as Distributed by MLS Grid
- 2024-01-20 Listing Removed — REALTRACS as Distributed by MLS Grid
- 2024-01-12 Relisted — REALTRACS as Distributed by MLS Grid
- 2023-12-31 Contingent — REALTRACS as Distributed by MLS Grid
- 2023-12-11 Price Changed $275,000 REALTRACS as Distributed by MLS Grid
- 2023-11-14 Price Changed $284,000 REALTRACS as Distributed by MLS Grid
- 2023-11-07 Listed $295,000 REALTRACS as Distributed by MLS Grid
- 2023-11-06 Coming Soon — REALTRACS as Distributed by MLS Grid
- 2022-05-20 Sold (Public Records) $229,900 Public Records
- 2022-05-18 Sold (MLS) $229,900 HCTCBOR
- 2022-03-25 Listed $229,900 HCTCBOR
- 2018-10-10 Sold (Public Records) $119,000 Public Records
- 2016-12-29 Sold (Public Records) $100,000 Public Records
Property tax history
+16.5%/yrLatest (2023): $1,927 · +66.7% YoY. Source: county tax records.
Cash-flow waterfall
monthlySold comps — $/sqft
last 12 mo · ≤1 miLoading sold comps…