 Duplex
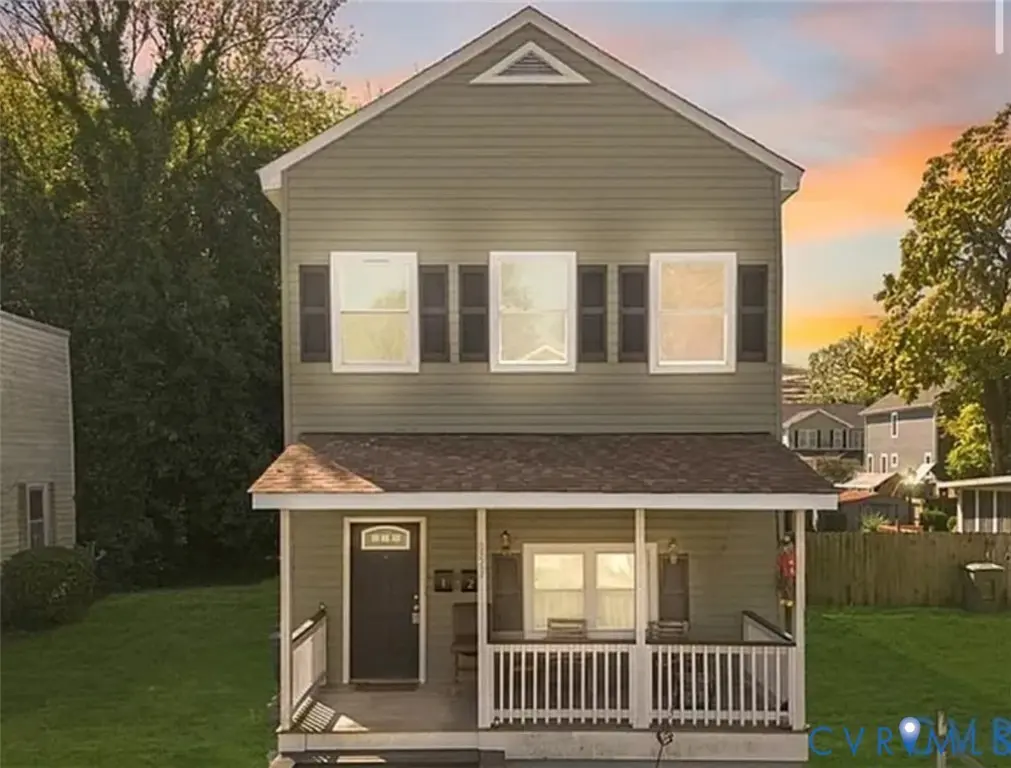
859 Lexington St · Norfolk, VA
Flood risk 6/10 · Moderate
- FEMA flood zone
- X (unshaded)
- Chance of flooding over 30 yrs
- 0.72%
- Est. flood insurance / yr
- $507 – $1,088
Fire risk 1/10 · Minimal
- Est. fire insurance / yr
- $666 – $1,236
Heat risk 9/10 · Severe
- Hot days now (above 106°F)
- 7 days/yr
- Hot days in 30 yrs
- 16 days/yr
Wind risk 8/10 · Major
- Chance of severe wind over 30 yrs
- 80.0%
Air-quality risk 3/10 · Minor
- Unhealthy air days now
- 2 days/yr
- Unhealthy air days in 30 yrs
- 5 days/yr
Risk factors via First Street. Map © Google.
Why this score? — see what drove the B+ grade
The composite is a weighted blend of 9 inputs, each scored 0–100. Each bar is that input's sub-score; the figure is the points it added to the 100-point composite (weight × sub-score).
- Cash flow +30.0/30.0
- ARV discount +12.1/15.0
- DSCR +10.0/10.0
- 1% rule +9.5/10.0
- Livability +4.2/5.0
- Rent growth +4.0/5.0
- Schools +3.5/10.0
- Condition / age +2.5/5.0
- Appreciation +0.0/10.0
$218,000
🖨 Deal sheet (PDF) 📄 Offer letter ✓ Due diligence
Multi-family units
County records classify this as Multi-Family (2-4 Unit). Listing-text estimate: 2 units. confirmed
Listing remarks MLS
Welcome to 859 Lexington St, Norfolk VA — a RARE VACANT DUPLEX OPPORTUNITY that’s perfect for investors or first-time homebuyers looking to house hack. Each spacious unit offers 3 bedrooms and 1 bathroom, totaling 1,200 sq ft per unit. This property is move-in and rent-ready with major upgrades completed in 2021: newer roof, newer HVAC, updated siding, newer windows, New water heater and newly built front & back porches. All that’s left is cosmetic TLC, giving you the chance to add value without the big-ticket expenses. Located in a highly desirable area known for strong rental demand and consistent cash flow, this duplex delivers excellent ROI potential. Whether you’re building your portfolio or buying your first home with rental income to offset your mortgage, this property checks all the boxes. Even better — it will pass FHA and VA financing, making it accessible to more buyers. Don't miss out, Make an offer today!! Don’t miss this chance to own a solid, income-producing property in Norfolk.
Key facts
- Updated siding
- Newer roof
- Newer windows
Tags
Neighborhood map
What this means for you Summary
Snapshot
- This is a 2 × 3-bed/1.0-bath units multifamily listed at $218k.
Deal economics
- At list price, monthly cash flow is $1k ($12k/yr) — positive. Per door: $510/mo.
- The deal already cash-flows at list — no discount required.
- Meets the 1% rule at list price ($3k rent vs $218k).
- Recommended offer: $211k (3.0% below list) — sets the bar for market timing.
- Cap rate 11.9% vs local median 4.0% in Norfolk — top-decile yield for the area; either an underpriced asset or a hidden risk that comps aren't pricing in. Stress-test before assuming the spread holds.
Location & tenants
- Location reads 83/100 on livability (#43 in VA, #1,026 nationally) — a professional / high-income tenant draw. Strengths: amenities A+, commute A+, health & safety A+; Watch: employment C-, crime F.
- Norfolk City Public School District (urban): math 27% / reading 56% proficiency, ranked #118 of 131 in VA (top 90%) — families likely to look elsewhere, expect single-tenant / working-renter base with shorter leases.
- Zoned schools: Jacox Elementary (math 5% / reading 20%, grade F, #1,107 of 1,108 statewide, top 100%, 568 students, 99% FRL); Blair Middle (math 29% / reading 57%, grade D-, #288 of 342 statewide, top 85%, 1,149 students, 92% FRL); Granby High (math 33% / reading 80%, grade C, #270 of 319 statewide, top 86%, 1,837 students, 94% FRL) — zoned schools average 95% FRL vs 59% district-wide (36 pts higher); higher-poverty schools than district average — tighter screening recommended.
- Market conditions: Rents rising fast (+6.1%/yr); 122 active listings in the ZIP; 3 comparable units currently listed for rent nearby; rentals at typical pace (median 26d on market — plan ~3-4 weeks tenant-placement turnaround); lower-income renter base — watch delinquency; 438 units permitted in Norfolk city in 2024 (273 in 5+ unit buildings).
- At $3,156/mo this rent would consume 85% of the median local household income ($45k/yr) (locally 1531% of renters already pay >50% of income on rent) — very limited rent-growth headroom before tenants either downsize or default.
Forward outlook
- Local home prices are declining (-3.0%/yr); year-one equity from $2k of loan paydown is wiped out by about $7k of value loss. Plan a longer hold.
- At projected returns (-3.0% appreciation + 6.1% rent growth), your $61k cash investment doubles in ~6 years — after that, you're playing with house money.
Negotiation context
- It's been on market 55 days — a 3% lower offer ($211k) is reasonable based on typical stale-listing flexibility.
- 6 sale attempts since 6y ago with the ask held roughly flat each time — persistent listings suggest the price (not the market) is what's stuck; bring a comps-based counter.
- Current owner paid $189k; 15% above their basis — modest negotiation headroom, anchor on the comps not their cost.
Risks & watch-outs
- Watch-outs: built in 1899 — expect roof / HVAC / electrical / plumbing capex.
- Climate carrying-cost: major flood risk; severe wind risk, 80% chance of damaging wind over 30y; extreme-heat days projected 7→16/yr by 2055 (HVAC capex compounding) — expect insurance premiums to compound above CPI over the hold.
Questions for the listing agent
- It's been on market 55 days. Have you received any prior offers? Is the seller open to a 3% concession, seller financing, or rate buy-down credit?
- Can we see the unit-by-unit rent roll, current vacancy, and any below-market leases? What's the average tenancy length?
- What capital expenditures (roof, boiler, parking lot, exteriors) have been made in the last 5 years, and what's planned in the next 2?
- Built in 1899 — when were the roof, HVAC, electrical panel, plumbing, and water heater last replaced?
- Is there a deadline driving the sale (1031 exchange, divorce, estate, relocation)? That informs how much negotiation room exists.
- Schools are A-rated — typically a magnet for longer-tenancy family renters. What's the average tenant stay here, and is there a school-zone premium baked into asking?
- Crime grade is F in this area — have there been break-ins, vandalism, or insurance claims at this property in the last 3 years? What carrier currently insures it and at what premium?
- What's the average days-on-market for RENTAL listings here right now (not sales)? A rising rental-DOM trend means longer vacancies and softer asking-rent achievability than the comps imply.
- What's the recent tenant-quality profile in this submarket — average credit score on applications, eviction rate, late-payment / NSF rate, and stable-employment percentage? A property-management company in the area should have these aggregated.
- How much new apartment / multifamily construction is in the pipeline within 1–3 miles? Heavy new supply (>2% of stock underway) typically softens rents 12–24 months out; light construction supports rent growth.
Investment metrics
- 1% rule
- 1.45% ✓
- Cap rate
- 11.91%
- Cash-on-cash
- 20.07%
- DSCR
- 1.89
- GRM
- 5.8
CMA / ARV
- ARV (median comp)
- $243,000
- List price
- $218,000
- Delta
- -10.29%
- Verdict
- UNDERPRICED
- Comps
- 11 within 1.0 mi
Show comp detail 4 sales within ~0.75 mi
| Address | Dist | Beds/Ba | Sqft | Sold | Price | $/sf | Match |
|---|---|---|---|---|---|---|---|
| 816 Johnson Ave | 0.12mi | 6/2.0 | 2,502 (+4%) | 13mo | $157,500 | $63 | 77 |
| 804 E 26th St | 0.59mi | 5/2.0 (-1) | 2,485 (+4%) | 6mo | $270,000 | $109 | 56 |
| 1519 Jamaica Ave | 0.67mi | 6/2.2 | 2,288 (-5%) | 6mo | $417,000 | $182 | 55 |
| 1521 Cary Ave | 0.67mi | 7/2.0 (+1) | 2,231 (-7%) | 2mo | $359,900 | $161 | 50 |
Match score weights: distance 35% · size 25% · config 20% · recency 20%. Top-matched comps best support the ARV.
Projected returns pro-forma
-3.0% appreciation · 6.12% rent growth · sell at horizon
- IRR
- 15.7%
- Equity multiple
- 1.65×
- Total profit
- $39,925
- Equity at exit
- $32,505
- IRR
- 26.5%
- Equity multiple
- 3.68×
- Total profit
- $163,283
- Equity at exit
- $18,849
Cash invested: $61,040 (down + closing). Projections, not guarantees.
Landlord ↔ Tenant lean methodology
- Overall (STATE)
- 55 Moderately Landlord-Leaning
- State Virginia
- 55 Moderately Landlord-Leaning · D+2
- County
- — inherits STATE
- City
- — inherits STATE
ZIP-level market 23504
- Home prices YoY
- -6.2%
- Rents YoY
- 6.1%
- Active inventory
- 122
- Price-to-rent
- 11.5×
Monthly cashflow live
- Estimated rent
- $3,156 high interval (Pro) →
- Mortgage (P&I)
- −$1,143
- Tax from tax record
- −$239 /mo · $2,862/yr
- Insurance
- −$91
- HOA
- −$0
- Vacancy / Maint / Mgmt
- −$663
- Net cashflow
- $1,021
Break-even live
Sensitivity live
| Price | -10% $1,144 | -5% $1,082 | +0% $1,021 | +5% $959 | +10% $897 |
|---|---|---|---|---|---|
| Rent | -10% $771 | -5% $896 | +0% $1,021 | +5% $1,145 | +10% $1,270 |
| Rate | -1.0pp $1,130 | -0.5pp $1,076 | base $1,021 | +0.5pp $964 | +1.0pp $907 |
2-unit breakdown (identical units grouped — click to expand)
| Units | Beds | Baths | Est. rent |
|---|---|---|---|
| 2× units | 3 | 1 | $3,156 |
| #1 | 3 | 1 | $1,578 |
| #2 | 3 | 1 | $1,578 |
| Total (2 units) | $3,156 | ||
UW: 25.0% down · 7.5% · 30yr · 1.5% tax · 5.0% vac · 8.0% maint · 8.0% mgmt
Financing live
Cash to close
- Down payment
- $54,500
- Closing costs
- $6,540
- Reserves months
- —
- Total cash needed
- —
Loan-product check · same deal, 3 products live
Conventional
25% down · 7.5% · 30yr
- Down + closing
- —
- Monthly P&I
- —
- Monthly cashflow
- —
- DSCR
- —
- Eligible?
- —
Personal DTI + credit; lowest rate.
DSCR
20% down · 8.5% · 30yr
- Down + closing
- —
- Monthly P&I
- —
- Monthly cashflow
- —
- DSCR
- —
- Eligible?
- —
No personal income docs; deal must DSCR.
Hard money
10% down · 12.0% · 12mo
- Down + closing
- —
- Monthly P&I
- —
- Monthly cashflow
- —
- DSCR
- —
- Eligible?
- —
Short-term bridge; refi at stabilization.
Rent comps 3 comps
| Address | Beds | Baths | Sqft | Rent | $/sqft | DOM | Units | Dist |
|---|---|---|---|---|---|---|---|---|
| 219 W 27th St Norfolk, VA | 5.0 | 3.5 | 2268 | $2,900 | $1.28 | 25d | 1 | 0.90mi |
| 632 Redgate Ave Norfolk, VA | 5.0 | 3.5 | 2943 | $3,300 | $1.12 | 25d | 1 | 1.28mi |
| 3126 Marne Ave Norfolk, VA | 5.0 | 2.0 | 1943 | $3,000 | $1.54 | 45d | 1 | 1.42mi |
Listing history 16 events
-
2026-04-04status Active 1055-char remark
Show marketing remark (1055 chars)
Welcome to 859 Lexington St, Norfolk VA — a RARE VACANT DUPLEX OPPORTUNITY that’s perfect for investors or first-time homebuyers looking to house hack. Each spacious unit offers 3 bedrooms and 1 bathroom, totaling 1,200 sq ft per unit. This property is move-in and rent-ready with major upgrades completed in 2021: newer roof, newer HVAC, updated siding, newer windows, New water heater and newly built front & back porches. All that’s left is cosmetic TLC, giving you the chance to add value without the big-ticket expenses. Located in a highly desirable area known for strong rental demand and consistent cash flow, this duplex delivers excellent ROI potential. Whether you’re building your portfolio or buying your first home with rental income to offset your mortgage, this property checks all the boxes. Even better — it will pass FHA and VA financing, making it accessible to more buyers. Don't miss out, Make an offer today!! Don’t miss this chance to own a solid, income-producing property in Norfolk.
-
2026-03-24status Pending 1055-char remark
Show marketing remark (1055 chars)
Welcome to 859 Lexington St, Norfolk VA — a RARE VACANT DUPLEX OPPORTUNITY that’s perfect for investors or first-time homebuyers looking to house hack. Each spacious unit offers 3 bedrooms and 1 bathroom, totaling 1,200 sq ft per unit. This property is move-in and rent-ready with major upgrades completed in 2021: newer roof, newer HVAC, updated siding, newer windows, New water heater and newly built front & back porches. All that’s left is cosmetic TLC, giving you the chance to add value without the big-ticket expenses. Located in a highly desirable area known for strong rental demand and consistent cash flow, this duplex delivers excellent ROI potential. Whether you’re building your portfolio or buying your first home with rental income to offset your mortgage, this property checks all the boxes. Even better — it will pass FHA and VA financing, making it accessible to more buyers. Don't miss out, Make an offer today!! Don’t miss this chance to own a solid, income-producing property in Norfolk.
-
2026-03-21$218,000 Active 1055-char remark
Show marketing remark (1055 chars)
Welcome to 859 Lexington St, Norfolk VA — a RARE VACANT DUPLEX OPPORTUNITY that’s perfect for investors or first-time homebuyers looking to house hack. Each spacious unit offers 3 bedrooms and 1 bathroom, totaling 1,200 sq ft per unit. This property is move-in and rent-ready with major upgrades completed in 2021: newer roof, newer HVAC, updated siding, newer windows, New water heater and newly built front & back porches. All that’s left is cosmetic TLC, giving you the chance to add value without the big-ticket expenses. Located in a highly desirable area known for strong rental demand and consistent cash flow, this duplex delivers excellent ROI potential. Whether you’re building your portfolio or buying your first home with rental income to offset your mortgage, this property checks all the boxes. Even better — it will pass FHA and VA financing, making it accessible to more buyers. Don't miss out, Make an offer today!! Don’t miss this chance to own a solid, income-producing property in Norfolk.
-
2026-03-21historical
Show marketing remark (1055 chars)
Welcome to 859 Lexington St, Norfolk VA — a RARE VACANT DUPLEX OPPORTUNITY that’s perfect for investors or first-time homebuyers looking to house hack. Each spacious unit offers 3 bedrooms and 1 bathroom, totaling 1,200 sq ft per unit. This property is move-in and rent-ready with major upgrades completed in 2021: newer roof, newer HVAC, updated siding, newer windows, New water heater and newly built front & back porches. All that’s left is cosmetic TLC, giving you the chance to add value without the big-ticket expenses. Located in a highly desirable area known for strong rental demand and consistent cash flow, this duplex delivers excellent ROI potential. Whether you’re building your portfolio or buying your first home with rental income to offset your mortgage, this property checks all the boxes. Even better — it will pass FHA and VA financing, making it accessible to more buyers. Don't miss out, Make an offer today!! Don’t miss this chance to own a solid, income-producing property in Norfolk.
-
2025-11-12price $236,900
-
2025-11-01price $237,000
-
2025-10-07status Active
-
2025-09-21status Pending
-
2025-09-19$252,000 Active
-
2021-12-06soldstatus $189,000
-
2021-11-05status Under Contract
-
2021-10-24historical Active Under Contract
-
2021-10-18$189,000 Active
-
2020-06-11historical
-
2020-05-22$160,000 Active
-
1999-04-06soldstatus $150,000
ⓘ Source: listings_history table (triggers on properties + properties_extension) + one-shot
backfill from property_details.listing_events for pre-trigger history.
Tax reassessment forecast VA · Resets to sale price
- Current annual tax
- $2,862 · $239/mo
- Projected year-2 tax
- $2,862 · $239/mo
- Expected delta
- $0/yr ($0/mo · 0.0%)
ⓘ Screening estimate from a state-policy table — verify with the county assessor before closing.
Climate risk First Street
- Flood 6/10 Major FEMA zone X (unshaded) · 72% chance over 30 yrs
- Wildfire 1/10 Low
- Heat 9/10 Extreme 7 d/yr ≥106°F today · 16 d/yr by 30 yrs out
- Wind 8/10 Severe 80% chance of damaging wind over 30 yrs
- Air quality 3/10 Moderate 2 unhealthy d/yr today · 5 by 30 yrs out
Nearby sold comps map
Loading sold comps map…
Walkable amenities ~0.75 mi
Loading nearby amenities…
Taxation est. · year 1
- Rental income
- $37,872
- − Mortgage interest
- −$12,211
- − Property taxes
- −$2,862
- − Insurance
- −$1,090
- − Repairs & maintenance
- −$3,030
- − Management
- −$3,030
- − Depreciation
- −$6,342
- Taxable income
- $9,307
- Est. tax owed @ 24.0%
- −$2,234
- After-tax cash flow
- $10,014/yr
For passive investors: Depreciation is non-cash, so a rental often shows a tax loss while cash-flowing — sheltering income. Rental losses are passive: they offset passive income freely, and up to $25,000/yr can offset ordinary (W-2) income if you actively participate and your MAGI is under $100k (phasing out to $0 by $150k); unused losses carry forward. On sale, claimed depreciation is recaptured at up to 25%, and gains may owe capital-gains tax (a 1031 exchange can defer both). Figures are a year-1 estimate at your 24.0% rate — not tax advice; consult a CPA.
Schools (NCES district)
- District
- Norfolk City Public School District
- NCES district ID
- 5102670
- Math proficiency
- 27% ▼ -44.00%
- Reading proficiency
- 56% ▼ -10.00%
- Median HH income
- $44,358
- Composite
- 35.08/100
- National rank
- #5026
- State rank
- #118 of 131 in VA
Livability — Norfolk
- Score
- 83/100
- State rank
- #43
- US rank
- #1026
Category grades
Schools grade is shown separately in the Schools card above.
Census & demographics
- Census place
- Norfolk, VA
- County
- Norfolk City · 214,042 people
- City population
- 214,042
- Metro
- Virginia Beach-Norfolk-Newport News, VA-NC
- Population (ZIP)
- 23,502
- Household income
- $44,659
- Rent vs Own
- Severe rent burden
- 1531.0
Population outlook (Norfolk County) Hauer SSP2
- Today (2025)
- 249,032 people
- By 2030
- 252,347 · +1.3%
- By 2040
- 253,644 · +1.9%
- By 2050
- 251,913 · +1.2%
- By 2075
- 245,281 · -1.5%
- By 2100
- 219,548 · -11.8%
Race, ethnicity, and origin ACS 2023
- Neighborhood character
- Predominantly Black (78%)
- Race & ethnicity
- Black 78% White 12% Two or more races 5% Hispanic / Latino 3%
- Common ancestry
- Lithuanian 1% Slovak 1%
- Foreign-born
- 3% · Canada
- Languages at home
- 94% English-only · Spanish 4% French/Haitian/Cajun 1%
Political lean MEDSL · Norfolk
- 2024 margin
- Solid D (+41.5) · D 70.0% · R 28.5% · Other 1.6%
- 2008→2024 swing
- -1.4pp toward R · 2008: 43.0pp · 2024: 41.5pp
- All cycles
- 2024: D+41.5 2020: D+45.6 2016: D+42.0 2012: D+44.0 2008: D+43.0
Not yet ingested
- Civics
- —
Market trends
- HPI YoY
- ▼ -21.60%
- Current HPI
- 327.2374
- Rent YoY
- ▲ 6.12%
- Metro
- Virginia Beach-Norfolk-Newport News, VA-NC
- State GDP YoY
- ▲ 2.40%
- F500 in state
- 50
Industry mix (Fortune 500 HQ in VA)
| Industry | F500 HQs | Revenue |
|---|---|---|
| Aerospace / Defense | 4 | $236B |
|
||
| Technology / Defense | 3 | $32B |
|
||
| Financial Services | 2 | $176B |
|
||
| Utilities | 2 | $27B |
|
||
| Insurance | 2 | $25B |
|
||
| Technology | 2 | $15B |
|
||
Price history
+45.3% since first listed16 events — show timeline
- 2026-04-04 Relisted — CVRMLS
- 2026-03-24 Pending — CVRMLS
- 2026-03-21 Listing Removed — CVRMLS
- 2026-03-21 Listed $218,000 CVRMLS
- 2025-11-12 Price Changed $236,900 CVRMLS
- 2025-11-01 Price Changed $237,000 CVRMLS
- 2025-10-07 Relisted — CVRMLS
- 2025-09-21 Pending — CVRMLS
- 2025-09-19 Listed $252,000 CVRMLS
- 2021-12-06 Sold (Public Records) $189,000 Public Records
- 2021-11-05 Pending — REINMLS
- 2021-10-24 Contingent — REINMLS
- 2021-10-18 Listed $189,000 REINMLS
- 2020-06-11 Listing Removed — REINMLS
- 2020-05-22 Listed $160,000 REINMLS
- 1999-04-06 Sold (Public Records) $150,000 Public Records
Property tax history
+5.9%/yrLatest (2025): $2,862 · +6.8% YoY. Source: county tax records.
Cash-flow waterfall
monthlySold comps — $/sqft
last 12 mo · ≤1 miLoading sold comps…