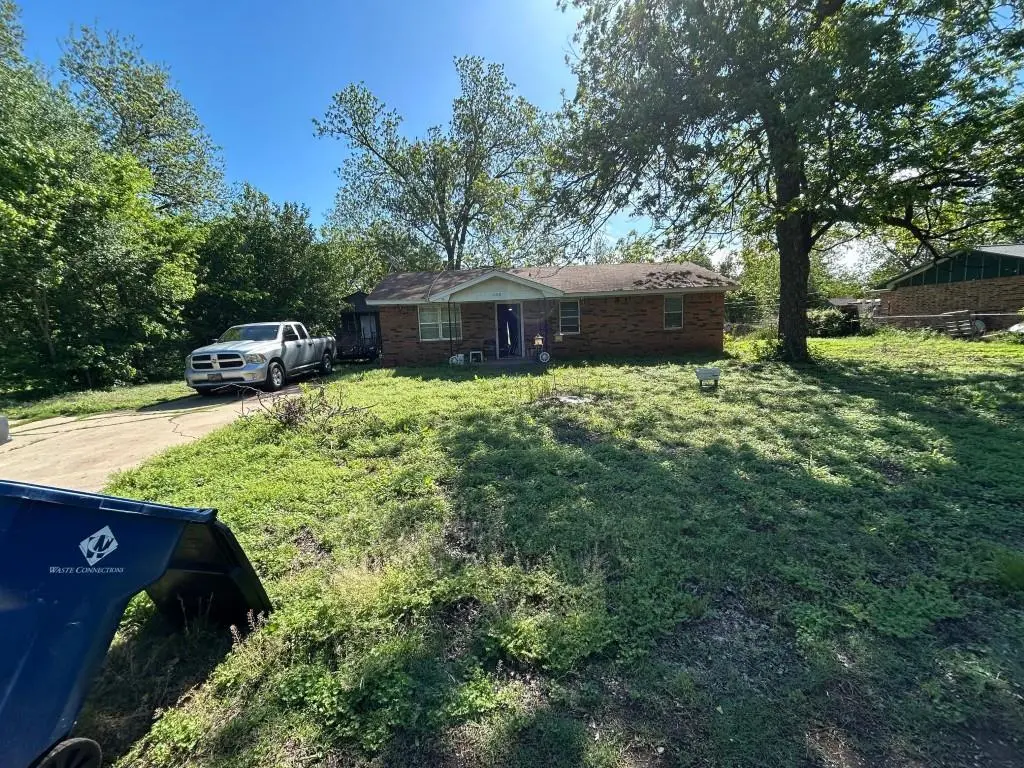
1106 N 11th St · Chickasha, OK
Flood risk No data
- FEMA flood zone
- —
- Chance of flooding over 30 yrs
- —
- Est. flood insurance / yr
- —
Fire risk No data
- Est. fire insurance / yr
- —
Heat risk No data
- Hot days now (above threshold)
- —
- Hot days in 30 yrs
- —
Wind risk No data
- Chance of severe wind over 30 yrs
- —
Air-quality risk No data
- Unhealthy air days now
- —
- Unhealthy air days in 30 yrs
- —
Risk factors via First Street. Map © Google.
Why this score? — see what drove the B- grade
The composite is a weighted blend of 9 inputs, each scored 0–100. Each bar is that input's sub-score; the figure is the points it added to the 100-point composite (weight × sub-score).
- Cash flow +30.0/30.0
- 1% rule +10.0/10.0
- DSCR +10.0/10.0
- ARV discount +7.5/15.0
- Livability +3.3/5.0
- Rent growth +2.5/5.0
- Condition / age +2.5/5.0
- Schools +2.1/10.0
- Appreciation +0.0/10.0
$89,900
🖨 Deal sheet (PDF) 📄 Offer letter ✓ Due diligence
Listing remarks
This charming home features a 2018 HVAC and water heater, updated kitchen appliances, and public utilities. Well-maintained with a spacious layout, this brick residence offers great potential. No HOA. Sold as-is
Key facts
- 2018 hvac
- Brick residence
- Water heater
Tags
Property features AI
Finance
- Other: Homestead not claimed
- Financial info: Not assumable
- HOA & community: No mandatory association dues
Exterior
- Utilities: Living area source: Assessor
- Home design: Single family residence; One level
- Construction: Brick and frame construction; Other roof type; Slab foundation; Built (existing)
- Exterior features: No notable exterior features listed; Lot features: Other
Interior
- Bedrooms: 3 bedrooms
- Bathrooms: 1 full bathroom
- Heating & cooling: Electric heating
- Interior features: One living area; No fireplace; Existing property
Neighborhood map
What this means for you Summary
Snapshot
- This is a 3-bed/2.0-bath single-family listed at $90k.
Deal economics
- At list price, monthly cash flow is $531 ($6k/yr) — positive.
- The deal already cash-flows at list — no discount required.
- Meets the 1% rule at list price ($1k rent vs $90k).
- Recommended offer: $87k (3.0% below list) — sets the bar for market timing.
- Cap rate 13.4% vs local median 4.8% in Chickasha — top-decile yield for the area; either an underpriced asset or a hidden risk that comps aren't pricing in. Stress-test before assuming the spread holds.
Location & tenants
- Location reads 66/100 on livability (#117 in OK) — a middle-class / working-renter tenant base. Strengths: cost of living A+, housing A+; Watch: amenities F, commute F, health & safety F.
- Chickasha (town): math 23% / reading 27% proficiency, ranked #115 of 270 in OK (top 43%) — low school quality limits family demand, transient renter base, plan for 1-2y turnover; 64% free/reduced lunch — lower-income household profile, screen leases tightly.
- Zoned schools: Chickasha Hs (math 12% / reading 27%, grade F, #296 of 447 statewide, top 67%, 749 students, 0% FRL) — zoned schools average 0% FRL vs 64% district-wide (64 pts lower); this property's tenant base skews higher-income than the district average.
- Market conditions: 203 active listings in the ZIP; 4 comparable units currently listed for rent nearby; rentals leasing fast (median 4d on market — plan ~1-2 weeks tenant-placement turnaround); 224 units permitted in Grady County in 2024 (0 in 5+ unit buildings).
Forward outlook
- Local home prices are declining (-3.0%/yr); year-one equity from $622 of loan paydown is wiped out by about $3k of value loss. Plan a longer hold.
- Grady County population projected at +20% by 2050 — long-run rental-demand tailwind backs the buy-and-hold thesis.
- At projected returns (-3.0% appreciation + 3.0% rent growth), your $25k cash investment doubles in ~5 years — after that, you're playing with house money.
Negotiation context
- It's been on market 58 days — a 3% lower offer ($87k) is reasonable based on typical stale-listing flexibility.
- Current owner paid $26k; list at $90k implies a 239% gain — meaningful room to come down on a strong offer.
Questions for the listing agent
- It's been on market 58 days. Have you received any prior offers? Is the seller open to a 3% concession, seller financing, or rate buy-down credit?
- Built in 1978 — when were the roof, HVAC, electrical panel, plumbing, and water heater last replaced?
- Is there a deadline driving the sale (1031 exchange, divorce, estate, relocation)? That informs how much negotiation room exists.
- Schools are D-rated, which usually means shorter tenancies and higher turnover. Who's the typical renter profile here, and what's been the actual vacancy rate?
- What's the average days-on-market for RENTAL listings here right now (not sales)? A rising rental-DOM trend means longer vacancies and softer asking-rent achievability than the comps imply.
- What's the recent tenant-quality profile in this submarket — average credit score on applications, eviction rate, late-payment / NSF rate, and stable-employment percentage? A property-management company in the area should have these aggregated.
- How much new for-sale + rental construction is in the pipeline within 1–3 miles? Heavy new supply typically softens prices + rents 12–24 months out; constrained supply supports both.
Investment metrics
- 1% rule
- 1.52% ✓
- Cap rate
- 13.38%
- Cash-on-cash
- 25.30%
- DSCR
- 2.13
- GRM
- 5.5
CMA / ARV
- ARV (on-the-fly)
- $34,452
- Comps found
- 2
Show comp detail 2 sales within ~0.75 mi
| Address | Dist | Beds/Ba | Sqft | Sold | Price | $/sf | Match |
|---|---|---|---|---|---|---|---|
| 1016 El Reno Ave | 0.26mi | 2/1.5 (-1) | 1,174 (-1%) | 8mo | $34,500 | $29 | 72 |
| 823 W Oklahoma Ave | 0.41mi | 3/1.0 | 1,276 (+7%) | 16mo | $18,000 | $14 | 51 |
Match score weights: distance 35% · size 25% · config 20% · recency 20%. Top-matched comps best support the ARV.
Projected returns pro-forma
-3.0% appreciation · 3.0% rent growth · sell at horizon
- IRR
- 18.8%
- Equity multiple
- 1.76×
- Total profit
- $19,205
- Equity at exit
- $13,404
- IRR
- 27.2%
- Equity multiple
- 3.39×
- Total profit
- $60,144
- Equity at exit
- $7,773
Cash invested: $25,172 (down + closing). Projections, not guarantees.
Landlord ↔ Tenant lean methodology
- Overall (STATE)
- 83 Strongly Landlord-Friendly
- State Oklahoma
- 83 Strongly Landlord-Friendly · R+20
- County
- — inherits STATE
- City
- — inherits STATE
ZIP-level market 73018
- Home prices YoY
- -21.1%
- Active inventory
- 203
- Price-to-rent
- 5.5×
Monthly cashflow live
- Estimated rent
- $1,365 medium interval (Pro) →
- Mortgage (P&I)
- −$471
- Tax from tax record
- −$39 /mo · $468/yr
- Insurance
- −$37
- HOA
- −$0
- Vacancy / Maint / Mgmt
- −$287
- Net cashflow
- $531
Break-even live
Sensitivity live
| Price | -10% $582 | -5% $556 | +0% $531 | +5% $505 | +10% $480 |
|---|---|---|---|---|---|
| Rent | -10% $423 | -5% $477 | +0% $531 | +5% $585 | +10% $639 |
| Rate | -1.0pp $576 | -0.5pp $554 | base $531 | +0.5pp $507 | +1.0pp $484 |
UW: 25.0% down · 7.5% · 30yr · 1.5% tax · 5.0% vac · 8.0% maint · 8.0% mgmt
Financing live
Cash to close
- Down payment
- $22,475
- Closing costs
- $2,697
- Reserves months
- —
- Total cash needed
- —
Loan-product check · same deal, 3 products live
Conventional
25% down · 7.5% · 30yr
- Down + closing
- —
- Monthly P&I
- —
- Monthly cashflow
- —
- DSCR
- —
- Eligible?
- —
Personal DTI + credit; lowest rate.
DSCR
20% down · 8.5% · 30yr
- Down + closing
- —
- Monthly P&I
- —
- Monthly cashflow
- —
- DSCR
- —
- Eligible?
- —
No personal income docs; deal must DSCR.
Hard money
10% down · 12.0% · 12mo
- Down + closing
- —
- Monthly P&I
- —
- Monthly cashflow
- —
- DSCR
- —
- Eligible?
- —
Short-term bridge; refi at stabilization.
Rent comps 4 comps
| Address | Beds | Baths | Sqft | Rent | $/sqft | DOM | Units | Dist |
|---|---|---|---|---|---|---|---|---|
| 810 W Illinois Ave Chickasha, OK | 2.0 | 2.0 | 1100 | $1,250 | $1.14 | 4d | 1 | 0.73mi |
| 810 W Illinois Ave Chickasha, OK | 2.0 | 2.0 | 1100 | $1,250 | $1.14 | 24d | 1 | 0.73mi |
| 1223 W Colorado Ave Chickasha, OK | 2.0 | 2.0 | 864 | $1,275 | $1.48 | 2d | 1 | 1.14mi |
| 519 W Minnesota Ave Chickasha, OK | 2.0 | 2.0 | 1100 | $1,250 | $1.14 | 2d | 1 | 1.38mi |
Listing history 16 events
-
2026-06-18days on market $89,900 Active 58 DOM
-
2026-06-17days on market $89,900 Active 57 DOM
-
2026-06-16days on market $89,900 Active 56 DOM
-
2026-06-15days on market $89,900 Active 55 DOM
-
2026-06-13days on market $89,900 Active 53 DOM
-
2026-06-09days on market $89,900 Active 49 DOM
-
2026-06-08days on market $89,900 Active 48 DOM
-
2026-06-07days on market $89,900 Active 47 DOM
-
2026-06-05days on market $89,900 Active 44 DOM
-
2026-06-03days on market $89,900 Active 43 DOM
-
2026-06-02days on market $89,900 Active 42 DOM
-
2026-06-01days on market $89,900 Active 41 DOM
-
2026-05-31days on market $89,900 Active 40 DOM
-
2026-05-11price $89,900
-
2026-04-21$99,900 Active
-
1996-04-18soldstatus $26,500
ⓘ Source: listings_history table (triggers on properties + properties_extension) + one-shot
backfill from property_details.listing_events for pre-trigger history.
Tax reassessment forecast OK · Resets to sale price
- Current annual tax
- $468 · $39/mo
- Projected year-2 tax
- $809 · $67/mo
- Expected delta
- +$341/yr (+$28/mo · 72.9%)
ⓘ Screening estimate from a state-policy table — verify with the county assessor before closing.
Nearby sold comps map
Loading sold comps map…
Walkable amenities ~0.75 mi
Loading nearby amenities…
Taxation est. · year 1
- Rental income
- $16,383
- − Mortgage interest
- −$5,036
- − Property taxes
- −$468
- − Insurance
- −$450
- − Repairs & maintenance
- −$1,311
- − Management
- −$1,311
- − Depreciation
- −$2,615
- Taxable income
- $5,193
- Est. tax owed @ 24.0%
- −$1,246
- After-tax cash flow
- $5,121/yr
For passive investors: Depreciation is non-cash, so a rental often shows a tax loss while cash-flowing — sheltering income. Rental losses are passive: they offset passive income freely, and up to $25,000/yr can offset ordinary (W-2) income if you actively participate and your MAGI is under $100k (phasing out to $0 by $150k); unused losses carry forward. On sale, claimed depreciation is recaptured at up to 25%, and gains may owe capital-gains tax (a 1031 exchange can defer both). Figures are a year-1 estimate at your 24.0% rate — not tax advice; consult a CPA.
Schools (NCES district)
- District
- Chickasha
- NCES district ID
- 4007560
- Math proficiency
- 23% ▼ -11.00%
- Reading proficiency
- 27% ▼ -8.00%
- Median HH income
- $38,561
- Composite
- 20.95/100
- National rank
- #8476
- State rank
- #115 of 270 in OK
Livability — Chickasha
- Score
- 66/100
- State rank
- #117
- US rank
- #11902
Category grades
Schools grade is shown separately in the Schools card above.
Census & demographics
- Census place
- Chickasha, OK
- County
- Grady County · 20,505 people
- City population
- 20,505
- Metro
- Oklahoma City, OK
- Population (ZIP)
- 20,505
- Household income
- $56,484
- Rent vs Own
- Severe rent burden
- 685.0
Population outlook (Grady County) Hauer SSP2
- Today (2025)
- 59,962 people
- By 2030
- 62,513 · +4.3%
- By 2040
- 67,338 · +12.3%
- By 2050
- 71,719 · +19.6%
- By 2075
- 82,684 · +37.9%
- By 2100
- 89,387 · +49.1%
Race, ethnicity, and origin ACS 2023
- Neighborhood character
- Predominantly White (74%)
- Race & ethnicity
- White 74% Two or more races 11% Hispanic / Latino 9% Black 5% Native American 5%
- Hispanic origin (detail)
- Mexican 6%
- Common ancestry
- Slovak 2% Iranian 2% Italian 2%
- Foreign-born
- 2% · Canada
- Languages at home
- 96% English-only · Spanish 3%
Political lean MEDSL · Grady
- 2024 margin
- Solid R (+62.7) · D 17.9% · R 80.6% · Other 1.5%
- 2008→2024 swing
- -16.0pp toward R · 2008: -46.7pp · 2024: -62.7pp
- All cycles
- 2024: R+62.7 2020: R+62.3 2016: R+60.3 2012: R+51.2 2008: R+46.7
Not yet ingested
- Civics
- —
Market trends
- HPI YoY
- ▼ -66.82%
- Current HPI
- 249.6051
- Rent YoY
- —
- Metro
- Oklahoma City, OK
- State GDP YoY
- ▲ 1.55%
- F500 in state
- 6
Industry mix (Fortune 500 HQ in OK)
| Industry | F500 HQs | Revenue |
|---|---|---|
| Energy | 3 | $48B |
|
||
Price history
+239.2% since first listed3 events — show timeline
- 2026-05-11 Price Changed $89,900 MLSOK
- 2026-04-21 Listed $99,900 MLSOK
- 1996-04-18 Sold (Public Records) $26,500 Public Records
Property tax history
+6.3%/yrLatest (2025): $468 · +4.2% YoY. Source: county tax records.
Cash-flow waterfall
monthlySold comps — $/sqft
last 12 mo · ≤1 miLoading sold comps…